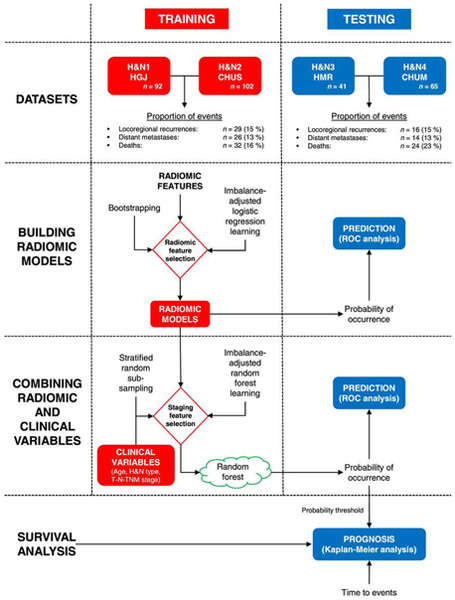
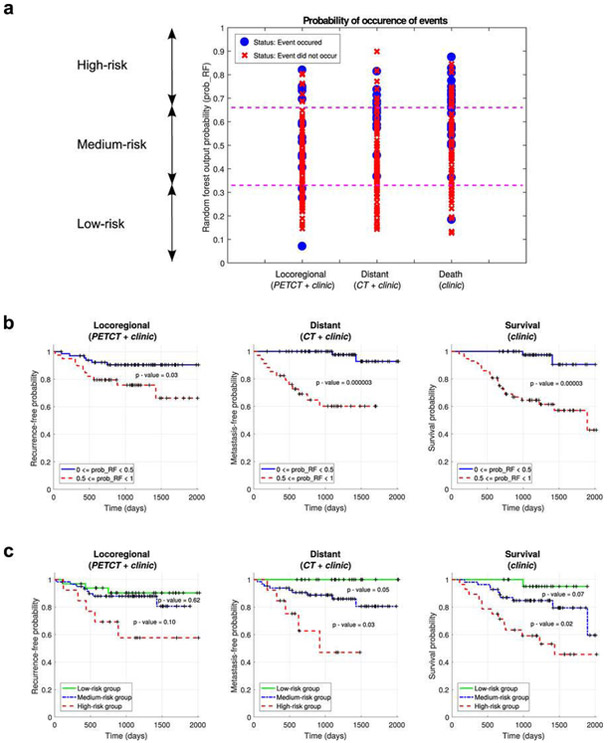
Fig. 5.
(a)[Left] The workflow of the model built by Vallieres et al. [41] The best combinations of radiomic features were selected in the training set, where these radiomic features were then combined with selected clinical variables in the training set. Independent prediction analysis was later performed in the testing set for all classifiers fully constructed in the training set. (b)[Right] Risk assessment of tumor outcomes in [41]. (1) Probability of occurrence of events for each patient of the testing set. The output probability of occurrence of events of random forests allows for risk stratification. (2) Kaplan-Meier curves of the testing set using a risk stratification into two groups as defined by a random forest output probability threshold of 0.5. All curves show significant prognostic performance. (3) Kaplan-Meier curves of the testing set using a risk stratification into three groups as defined by random forest output probability thresholds of 1/3 and 2/3.


