

Abstract
Aims
A dramatic increase in newborn infants with neonatal abstinence syndrome has been observed and these neonates are frequently treated with complex methadone dosing schemes to control their withdrawal symptoms. Despite its abundant use, hardly any data on the pharmacokinetics (PK) of methadone is available in preterm neonates. Therefore we investigated developmental PK of methadone and evaluated current dosing strategies and possible simplification in this vulnerable population.
Methods
A single‐centre open‐label prospective study was performed to collect PK data after a single oral dose of methadone in preterm neonates. A population PK model was built to characterize developmental PK of (R)‐ and (S)‐methadone. Model‐based simulations were performed to identify a simplified dosing strategy to reach and maintain target methadone exposure.
Results
A total of 121 methadone concentrations were collected from 31 preterm neonates. A one‐compartment model with first order absorption and elimination kinetics best described PK data for (R)‐ and (S)‐methadone. Clearance increases with advancing gestational age and differs between R‐ and S‐enantiomer, being slightly higher for the former (0.244 vs 0.167 L/h). Preterm neonates reached target exposure after 48 hours with currently used dosing schedules. Output from simulations revealed that target exposures can be achieved with a simplified dosing strategy during the first 4 days of treatment.
Conclusion
Methadone clearance in preterm neonates increases with advancing gestational age and its disposition is influenced by its chirality. Simulations that account for developmental PK changes indicate a shorter methadone dosing strategy can maintain target exposure to control withdrawal symptoms.
Keywords: dosing optimization, gestational age, methadone, neonatal abstinence syndrome, preterm neonates
What is already known about this subject
The disposition of methadone is influenced by its chirality.
Polymorphisms of the CYP2B6 enzyme alters the disposition of methadone and influences plasma concentrations.
Current dosing recommendations for methadone are often complex and require a taper or weaning period.
What this study adds
The clearance of methadone increases with advancing gestational age.
Pharmacokinetic differences between the two methadone enantiomers were observed (higher clearance and volume of distribution for (R)‐methadone).
Complex dosing schemes can be replaced by a simplified and shortened dosing strategy.
1. INTRODUCTION
In the current prescription opioid epidemic, a dramatic increase in pregnant women who use these opioids (e.g. hydrocodone) is observed, resulting in drug dependence and addiction in their fetuses.1, 2, 3 Methadone is frequently used after birth to treat these infants, who are often preterm, and whose withdrawal symptoms are caused by the abrupt discontinuation of prolonged in utero drug exposure.4 Use of narcotics by pregnant women remains a serious public health concern, primarily due to the increased risk of birth defects, but also because of the socioeconomic burden caused by the increasing need for medical and social support.4, 5 According to a recent study, maternal opioid use increased from 1.2 mothers to 5.6 mothers per 1000 live births in the period between 2000 and 2009. During this time, neonates diagnosed with neonatal abstinence syndrome (NAS) increased correspondingly from 1.2 to 3.4 per 1000 live births in the United States.6 NAS is characterized by a wide range of clinical symptoms including tremors, respiratory distress, hypertonia and excessive crying, and is mostly treated to prevent seizures.7 Despite the development of various standardized scoring scales (e.g. Finnegan Neonatal Abstinence Severity Score or Neonatal Narcotic Withdrawal Index) and the careful training of staff utilizing these scoring tools, the observation of response to treatment of neonates with NAS remains to a large extent subjective.8, 9 In addition, these scoring systems are generally developed for term neonates, whereas preterm neonates exhibit different signs of withdrawal and, for instance, less severe symptoms of withdrawal may be observed due to neurologic immaturity.10, 11 As a result, these scoring systems might under‐ or overpredict the severity of NAS.
Opiates such as methadone and morphine belong to the first‐line treatment for neonates with NAS.10, 12 A recent study has shown that short‐term outcomes were better in infants who were treated with methadone as compared to morphine.13 Although no universally accepted treatment protocol exists, methadone dosage is tapered gradually to help wean the neonate off the drug once the signs of withdrawal are under control. As a consequence, current dosing recommendations for methadone are often quite complex and require a taper or weaning period.11, 14, 15 Despite the abundant use of methadone, very little data on the pharmacokinetics (PK) of this drug is available in preterm neonates.
Methadone is a racemic stereoselective opioid agonist with a relative long half‐life of approximately 25–32 hours and is mainly converted by hepatic metabolism via N‐demethylation to the inactive metabolite 2‐ethylidene‐1,5‐dimethyl‐3,3‐diphenylpyrrolidine (EDDP) and subsequently to 2‐ethyl‐5‐methyl‐3,3‐diphenylpyrroline (EMDP).10, 16 Methadone is administered as a racemic mixture of (R)‐ and (S)‐methadone, although the former enantiomer accounts for most opioid effects and is highly bound to plasma proteins, with α1‐acid glycoprotein being the most relevant one.17 The enzymes that metabolize methadone have been extensively studied by Kharasch et al., and although the metabolism has been attributed to cytochrome P450 3A4 (CYP3A4) for many years, it was found that CYP2B6 is the major enzyme responsible for the biotransformation of methadone and that CYP3A4 plays only a minor role in methadone N‐demethylation.16, 18 The activity of CYP2B6 varies significantly among individuals, and neonates present complex and unpredictable maturation profiles of drug metabolizing enzymes (DMEs).19 These enzymes do not develop at the same rates and can be altered by the in utero exposure of maternal drugs. Although the PK profiles of oral and intravenous methadone have been described for adults receiving methadone as treatment for opioid dependence, these profiles cannot simply be extrapolated to preterm neonates.20, 21, 22
Today, the paucity of information concerning the developmental aspects on the exposure of methadone in preterm neonates highlights the need for additional studies to investigate the complex pharmacology of methadone and its large inter‐individual variability in PK.10, 15, 16 This study aimed at (i) characterizing the PK of oral methadone in preterm neonates using population PK modelling, (ii) assessing the influence of demographic characteristics on PK parameters, and (iii) evaluating current dosing strategies and target exposure.
2. METHODS
2.1. Characterization of pharmacokinetic data
Data on methadone concentrations used for this analysis originates from a single‐centre open‐label prospective PK study conducted at Shahid Akbarabadi Hospital in Tehran, Iran. The study was approved by the local ethics committee. After informed consent was obtained, one dose of standard opioid medication (fentanyl or morphine), which was prescribed for clinical reasons and is not expected to modify the PK of methadone, was replaced by one dose of 0.1 mg/kg orally administered methadone. The study aimed at a sample size of 60 neonates with a postnatal age (PNA) less than 3 months. Patient demographics such as bodyweight (BW), gestational age (GA), PNA, sex and maternal age at birth were included in the analysis. Plasma (R)‐ and (S)‐methadone levels were quantified in plasma samples (200 μL) after administration of methadone and concentrations were analysed by high‐performance liquid chromatography coupled with mass spectrometry (HPLC‐MS/MS).
2.2. Population pharmacokinetic model
Population PK parameter estimates were obtained using nonlinear mixed effects modelling software (NONMEM v7.4.1; ICON Development Solutions, Ellicott City, MD).23 A first‐order estimation method with interaction (FOCE‐I) was applied and the subroutine ADVAN13 TOL3 was used to solve the ordinary differential equations. We applied a three‐step approach to identify the model that best describes available methadone data. First, the structural population PK model was developed; second, various covariate models were tested; and third, the population PK model was evaluated.
Numerical and graphical diagnostic information were created using R (version 3.4.4).24 Plasma concentration measurements that were below the lower limit of quantification (LLOQ; 0.25 ng/mL) were excluded from analysis. Methadone can be transferred to the newborn (via breastmilk or via placental transfer) during pregnancy. As no information was available as to whether the pregnant women were under methadone maintenance treatment, all pre‐dose measurements were excluded from analysis. Methadone was only administered orally and therefore estimated parameters represent apparent values. Since methadone is a racemic mixture of two enantiomers (50:50) and both these enantiomers display different pharmacokinetic properties, they were modelled separately.
2.2.1. Development of structural population pharmacokinetic model
Both one‐ and two‐compartment models were assessed as the structural model including appropriate absorption and elimination processes for methadone.25, 26, 27 Estimated parameters included absorption rate constant (ka), volume of distribution (Vd) and clearance (CL). Log‐normally distributed inter‐individual variability on all population parameters was investigated. Additive, proportional and combined residual error models were investigated to describe the residual variability. Different models were compared with increasing complexity in structural model and number of random effects. Quality of fit of the model to the data was sought by means of the objective function value and by means of visual examination of diagnostic plots. Statistically significant improvement of the model was considered when the objection function value (OFV) decreased by at least 3.84 points for one additional parameter (χ2 distribution, α = 0.05).28 Additionally, numerical diagnostics were obtained in order to guide model acceptance.
2.2.2. Testing of covariate models
Exponential, power and linear model functions were tested to describe covariate effects of continuous variables such as weight and age variables (GA, PNA and maternal age).26 In addition, effect of GA was tested by means of a sigmoidal function. Standard allometric scaling was tested by fixing the exponent of the power model to 0.75 and 1 for CL and Vd, respectively.
2.2.3. Evaluation of final population PK model
Stability and performance of the final population PK model were validated by bootstrap analysis in order to evaluate parameter uncertainty. A total of 1000 replications were used to obtain parameter confidence intervals (95% CI) and the median of estimated parameters. The final model was internally evaluated; observed concentrations were compared with the 95% prediction intervals of simulation percentiles.
2.3. Simulations to evaluate methadone dosing recommendations
In addition to model development, simulation techniques were applied to evaluate reported dosing scenarios, investigate methadone exposure levels and examine the feasibility of simplified dosing recommendations. In order to investigate the methadone exposure levels, target area under the curve (AUC) was calculated. As in this study no pharmacodynamics assessment was performed, target AUC was retrieved from an earlier study conducted in term neonates by Wiles et al.15 This study determined target exposure (985 mcg*h/L) by analysing and correlating the AUC to a marker for clinical response (Finnegan scoring system) to describe the drug effect after 24 hours. Cumulative AUC was assessed at each day of tapering period according to various dosing scenarios in order to evaluate the exposure of methadone over time.
3. RESULTS
First, we describe the analysis dataset, structural population PK models, covariate models and evaluation of the final population model. Second, we summarize the results from simulations we performed to evaluate various dosing strategies in preterm neonates.
3.1. Dataset analysis and population pharmacokinetics
3.1.1. Dataset analysis
Sixty patients were included in the study after giving informed consent. Fifty‐three of them were included in the data analysis after exclusion of pre‐dose measurements (n = 57, 12%) and LLOQ data (n = 35, 19%). Based on an exploratory analysis of the PK data and prior knowledge of the PK physicochemical properties of methadone, the following exclusion criteria were applied: patients with less than three measurements, patients with an unexpected increase of 30% in the elimination phase, and patients with t max (time point at which maximum concentration is reached) after 48 hours. In total, 31 patients with 121 (R)‐ and (S)‐methadone plasma levels were included in the analysis dataset for the development of the population PK model.
Plasma concentrations of R‐ and S‐methadone were highly variable, with a range of 0.251–15.49 mcg/L (Figure 1). Measurements were taken over a period of 72 hours. Neonates included for the population PK analysis were considered preterm as the overall GA range was 26–36 weeks with a median of 32 weeks (Table 1). The median bodyweight was 1.6 kg (0.93–2.7 kg). The median PNA was 3 days (0–15 days). Of the patients included for analysis, 65% were male. The median maternal age was 25.5 years (17–34 years).
Figure 1.
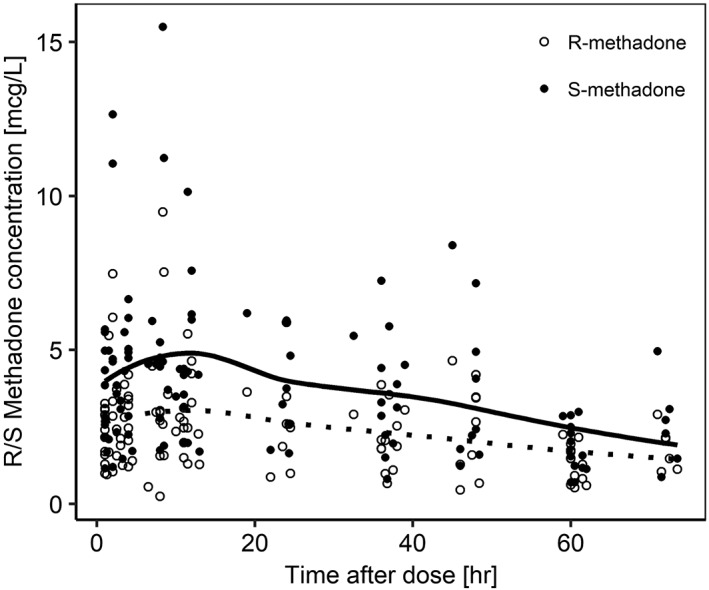
Observed plasma concentrations versus time after single oral dose of methadone. Smoothed conditioned means for (R)‐methadone and (S)‐methadone are presented by dotted and solid lines, respectively
Table 1.
Demographic characteristics of study participants (n = 31) included in population PK analysis
| Characteristics | n (min–max) |
|---|---|
| Bodyweight (kg) | 1.6 (0.93–2.7) |
| Gestational age (weeks) | 32 (26–36) |
| Postnatal age (days) | 3 (0–15) |
| Post menstrual age (weeks) | 32 (26–37) |
| Maternal age (years) | 25 (17–34) |
| Sex | |
| Female | 10 [32%] |
| Male | 20 [65%] |
| Unknown | 1 [3%] |
3.1.2. Structural population pharmacokinetic model
A one‐compartment model with first order absorption and elimination kinetics best described the data for (R)‐ and (S)‐methadone (Equations 1–3). Log‐normal inter‐individual variability attributed on both R‐ and S‐enantiomers and on all parameters significantly improved the model with a fixed inter‐individual variability for absorption rate constant of 0.05. The residual variability for methadone of both enantiomers was best described by a proportional error model. Two subjects were excluded from further analysis as they were identified as outliers based on conditional weighted residuals with interaction (CRWESI) vs time diagnostic plots.
| (1) |
| (2) |
| (3) |
3.1.3. Covariate models
Implementation of bodyweight by allometric scaling (with 0.75 as scaling exponent) did not capture the bodyweight effect on CL (= ke*Vd) and no decline in coefficient of variation for Vd and CL was observed. Allometric scaling was therefore not incorporated in the final model. Including GA on CL by a general power function and on Vd in a linear relationship improved the model fit, described by
| (4) |
where P i represents the parameter in the ith individual, ϴ 1 is the population parameter estimate (typical value for a patient) and ϴ 2 is the exponent (fixed to 1 for the linear model). Clearance for both (R)‐ and (S)‐methadone increased with advancing GA and was observed to be higher for (R)‐methadone compared to (S)‐methadone (0.244 vs 0.167 L/h) (Figure 2). It is important to mention that bodyweight and GA are highly correlated in this investigated population (r = 0.82). Since the range of PNA was limited (15 days) it was not possible to identify an effect of PNA on estimated parameters. No further covariates were identified or included in the final model.
Figure 2.
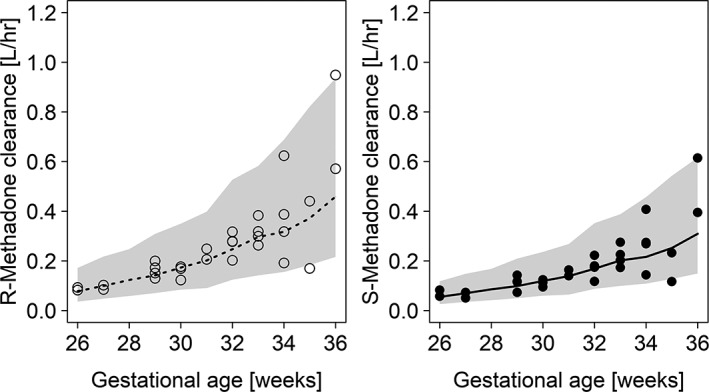
(R)/(S)‐methadone clearance values for different weeks of gestational age. (R)‐methadone and (S)‐methadone values are presented by open and black circles, respectively. Medians for (R)‐methadone and (S)‐methadone clearance are presented by dotted and solid lines, respectively. Prediction intervals (95%) are obtained by model‐based simulations based on all included subjects and presented for (R)‐ and (S)‐methadone
3.1.4. Final population pharmacokinetic model
A one‐compartment model with first‐order absorption and elimination kinetics best described the data, including GA on CL by a power function and on Vd in a linear relationship. Final parameter estimates of developed models for (R)‐methadone and (S)‐methadone are shown in Supplementary Table S1. The population parameter values for apparent Vd and apparent CL for (R)‐methadone and (S)‐methadone corresponded to 26.9 L and 0.244 L/h and 18 L and 0.167 L/h, respectively.
Goodness‐of‐fit plots for the (R)‐ and (S)‐methadone (Supplementary Figure S1) data points show negligible bias around the line of unity, indicating that the model accurately describes the observations. Considering the conditional weighted residuals with interaction over time after dose, a small bias was retained in the model, which could not be further improved by additional model development. Results obtained from bootstrap analysis are provided in Supplementary Table S1. Parameters estimates of the final model are within the 95% CIs and median values are in accordance with final parameter estimates. Additional sensitivity analysis, where patients with 30% increase in elimination phase were included in the final PK model, had minimal impact on the clearance estimates. For a typical patient (32 weeks GA), an increase of 1.9% and 18% of (R)‐ and (S)‐methadone clearance was observed, respectively. As these results show minimal influence on the final model estimates, these individuals were not included in analysis dataset.
3.2. Simulations to evaluate methadone dosing recommendations
Model‐based simulations were performed to investigate the concentration–time profiles of methadone based on different dosing scenarios, and the proportion of preterm neonates reaching the methadone target exposure (985 mcg*h/L) were examined. Multiple dosing scenarios as proposed in Table 2, where the duration of the weaning period and dosage of methadone vary, were applied to all patients included in the study and methadone concentration–time profiles were obtained. Figure 3 shows the R/S‐methadone plasma concentrations from 100 simulations with the predicted median and range (5th and 95th percentiles) for Scenario 1a and 3, respectively. It can be observed that after administering methadone according to Scenario 3, methadone concentrations decrease slightly more rapidly compared to the weaning regimen as suggested in Scenario 1a, despite the fact that both dosing scenarios achieve similar percentages (59% and 62%) of patients reaching target concentrations after 48 hours (Table 3). It is demonstrated that the target AUC of 985 mcg*h/L is reached in approximately 60% of patients after 48 hours for Scenario 1a, 2 and 3, whereas it has been shown that this target exposure is reached after 24 hours for term neonatal patients.15 Considering Scenarios 1c and 4, where the loading dose is increased by two‐fold (0.2 mg/kg) in the first 24 hours, approximately 90% of patients are expected to achieve target exposure after 48 hours (Table 3). In addition, it is observed that a large number of patients (70%) are still above target level even after 14 days, although methadone administration has been stopped at Day 8 (Scenario 1a). When the tapering dosing regimen is stopped after 4 days (Scenario 3), 56% of patients maintain an effective methadone exposure for 2 weeks after start of treatment.
Table 2.
Dosing scenarios (in mg/kg) applied for methadone simulations. Scenarios 1a–1c are derived and adjusted from Wiles et al. 15 Scenarios 2–4 represent simplified dosing strategies
| Tapering |
Scenario 1a |
Scenario 1b |
Scenario 1c |
Scenario 2 |
Scenario 3 |
Scenario 4 |
Frequency |
|---|---|---|---|---|---|---|---|
| Day 1 | 0.1 | 0.15 | 0.2 | 0.1 | 0.1 | 0.2 | q6 × 4 |
| Day 2 | 0.075 | 0.075 | 0.075 | 0.1 | 0.1 | 0.1 | q12 × 2 |
| Day 3 | 0.05 | 0.05 | 0.05 | 0.05 | 0.05 | 0.05 | q12 × 2 |
| Day 4 | 0.04 | 0.04 | 0.04 | 0.01 | 0.01 | 0.01 | q12 × 2 |
| Day 5 | 0.03 | 0.03 | 0.03 | 0.01 | – | – | q12 × 2 |
| Day 6 | 0.02 | 0.02 | 0.02 | 0.01 | – | – | q12 × 2 |
| Day 7 | 0.01 | 0.01 | 0.01 | 0.01 | – | – | q12 × 2 |
| Day 8 | 0.01 | 0.01 | 0.01 | 0.01 | – | – | q24 × 1 |
Figure 3.
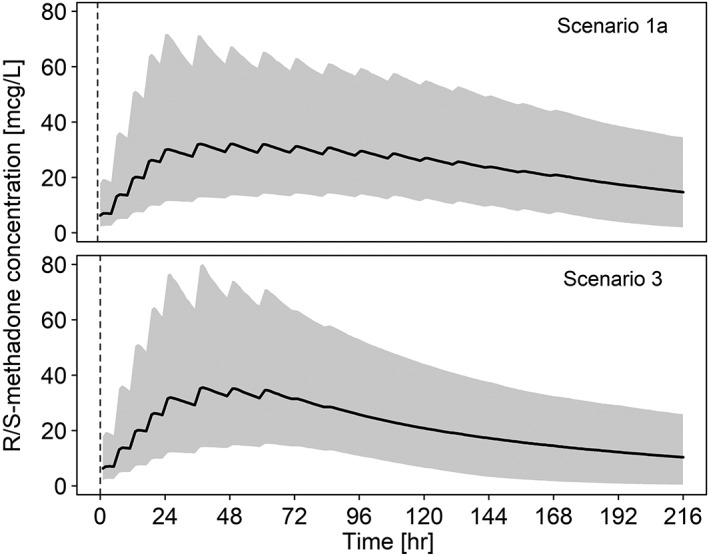
Simulated (R)/(S)‐methadone concentrations over nine days according to dosing Scenarios 1a and 3. Medians for (R)/(S)‐methadone concentrations are presented by black lines, respectively. Prediction intervals (95%) are obtained by model‐based simulations based on all included subjects and presented for (R)‐ and (S)‐methadone
Table 3.
Percentage of preterm neonates reaching target exposure of 985 mcg*h/L (cumulative area under the curve) after applying various dosing scenarios according to Table 2. Day 8 was chosen as cut‐off due to the length of dosing recommendation published by Wiles et al. 15
| Dosing protocol | Percentage reaching target exposure | |||||||||||
|---|---|---|---|---|---|---|---|---|---|---|---|---|
|
Day
1 |
Day
2 |
Day
3 |
Day
4 |
Day
5 |
Day
6 |
Day
7 |
Day
8 |
Day
1–8 |
Days
8–14 |
Days
14–21 |
Days
21–28 |
|
| Scenario 1a | 5 | 59 | 89 | 97 | 99 | 100 | 100 | 100 | 100 | 70 | 37 | 17 |
| Scenario 1b | 8 | 80 | 96 | 99 | 100 | 100 | 100 | 100 | 100 | 74 | 42 | 21 |
| Scenario 1c | 34 | 90 | 98 | 100 | 100 | 100 | 100 | 100 | 100 | 76 | 46 | 24 |
| Scenario 2 | 5 | 62 | 91 | 97 | 99 | 100 | 100 | 100 | 100 | 64 | 33 | 14 |
| Scenario 3 | 5 | 62 | 91 | 97 | 99 | 100 | 100 | 100 | 100 | 56 | 27 | 11 |
| Scenario 4 | 34 | 91 | 99 | 100 | 100 | 100 | 100 | 100 | 100 | 68 | 40 | 20 |
4. DISCUSSION
This is the first clinical investigation that describes the PK of a single dose of oral methadone in preterm neonates using a quantitative approach for both enantiomers. We found that the clearance of methadone increases with advancing GA and differs slightly between R‐ and S‐enantiomer, being slightly higher for the former (Figure 2). The CL of (R)‐methadone in preterm neonates shows a five‐fold increase between gestational weeks 26 and 36 (0.0997–0.5574 L/h). For (S)‐methadone, the CL values increase from 0.0692 to 0.3708 L/h in these preterm neonates. The disposition of methadone is influenced by its chirality, and the volume of distribution for (R)‐methadone appears to be higher than for (S)‐methadone (26.9 vs 18 L), which is in agreement with other studies in (term) neonates and in adults.17, 29, 30, 31
A previously published study reported clearance values for term neonates after multiple dosing of oral methadone of 8.94 L/h/70 kg.15 In addition, Ward et al. investigated the pharmacokinetics of methadone and its metabolites after intravenous administration and demonstrated formation CL values of 7.25 and 8.19 L/h/70 kg for (R)‐ and (S)‐methadone to its corresponding metabolites, respectively.29 In addition, CL of the methadone metabolites is described by 18.3 and 15.3 L/h/70 kg for R‐ and S‐enantiomer, respectively. Converting our retrieved CL values to comparable units, we obtain 10.67 and 7.31 L/h/70 kg for (R)‐ and (S)‐methadone, respectively. Variations in CL values can be observed and might be a possible result of the distinctive investigated populations and their corresponding variability (term vs preterm neonates) and variations in route of administration (intravenous vs oral).
Research has shown that CYP2B6 activity increases through infancy and by age of 1 year CYP2B6 levels and activity reached those of adults. This is also supported by the substrate efavirenz, which showed an increase in clearance with body weight and age, reaching 90% of its mature level by 9 months.32, 33, 34 This study showed that clearance of methadone increases with advancing GA, although the variability of methadone disposition cannot be completely explained by this age effect. Unexplained variability can be a result of, for example, genetic differences in drug transport or in neonatal drug metabolism.35 Extended research has been performed on genetic variants (polymorphisms) of the major drug metabolizing enzyme, CYP2B6.18, 36 Polymorphisms of the CYP2B6 enzyme alter the disposition of methadone and influence the plasma concentrations, with greater influence for oral administration compared to intravenous administration.36 CYP2B6*6 allele carriers, particularly homozygous, were observed to have higher methadone concentrations and decreased elimination, while CYP2B6*4 carriers had lower concentrations and increased elimination.37 CYP2B6*5 appeared not to alter methadone concentrations, although it has to be noted that few subjects were studied.36 In addition to polymorphisms, other factors might have an impact on the disposition of methadone in preterm neonates, for instance the influence of a combination of maternal drugs, whether the neonate is fed by breastfeeding, and the pH of the urine of the neonate.
Although it has been shown that methadone is transferred to neonates through breastfeeding, the absolute amount is small (< 0.2 mg/day).38 In addition, the number of women in methadone programmes who breastfeed their newborn has been low and more than half of them discontinue breastfeeding after 6 days.39 However, a pharmacodynamic effect has been observed as breastfed neonates have a decreased severity of NAS. It can be debated whether this effect is caused by a very small amount of methadone, or because of the calming and nursing effect of breastfeeding.14, 40 In addition, a study has shown that urine pH has a significant effect on the renal clearance of methadone, although methadone is a lipid soluble basic drug with a pKa of 9.2 and elimination is mostly due to hepatic metabolism.17, 31 When urine pH is 5.2 (acidic), the contribution of renal clearance becomes significant and accounts for around 30% of the total body clearance. When urine pH greater than 7, renal clearance can be neglected from the total body clearance of methadone.31, 41 Extremely low birth weight neonates showed higher urine pH values compared to <1500 g birth weight infants, indicating the possible lesser extent of renal clearance of methadone clearance in extremely low birth weight neonates.42 Therefore, renal clearance may only become of quantitative importance when the urinary pH is below 6.41 In order to obtain a transparent insight, additional studies need to be performed and it is of relevance to collect information on the following aspects; plasma and urine samples of methadone and its two metabolites (EDDP and EDMP) for a considerable period of time (at least one half‐life for metabolites). In addition, the fraction of the enzymatic pathway (due to CYP2B6) and renal excretion can be estimated and investigated. Subsequently, it might be beneficial to collect genetic information concerning the known impact of polymorphisms.
Target exposure for the mitigation of withdrawal symptoms was retrieved and applied from earlier research where it was shown that term neonates achieving the target exposure of 985 mcg*h/L were able to control their withdrawal signals 24 hours after start of treatment.15 To our knowledge, there is currently no target exposure for preterm neonates available. In addition, it should be recognized that scoring systems for the diagnosis of NAS are generally developed for term neonates, whereas preterm neonates exhibit different signs of withdrawal (e.g. less severe symptoms due to neurologic immaturity).11 This reflects the urgent need for the development of new scoring systems, especially for preterm neonates.
In total, six different dosing scenarios were investigated and the exposure of methadone in preterm neonates was simulated (Table 2). The exposure of methadone (not the dose) generates the pharmacodynamic effect, which in this case is the control of withdrawal symptoms. When applying weaning dosing Scenario 1a, the target exposure is reached after 48 hours for 59% of the preterm neonates. Focusing on Scenario 1c, where the dosages in the first 24 hours are increased by two‐fold, ensures that 90% of patients will achieve target AUC exposure after 48 hours, but only 34% reaches this target after 24 hours (Table 3). It can be questioned whether it is harmless to increase the first four dosages by two‐fold (0.1 mg kg−1 to 0.2 mg kg−1 q6 × 4) in order to control withdrawal symptoms without jeopardizing safety (Scenario 1c and 4). Although a recent study administered higher methadone dosages, further research should elaborate on this safety concern.13 When administering methadone for only 4 days (Scenarios 3 and 4), still 62% and 91% of preterm neonates will, respectively, achieve target exposure after 48 hours. Focusing on the methadone exposure (cumulative AUC) in the first 8 days after start of treatment, it can be observed that all dosing strategies are able to achieve effective exposure in all preterm neonates (Table 3). On the other hand, when applying extensive weaning protocols (Scenarios 1a, 1b and 1c), it can be observed that approximately 70% of preterm patients still maintain an effective exposure after 8 days of treatment, even though no dosages of methadone are given in this period. To our current knowledge, it remains unclear whether this extended and prolonged methadone exposure could have beneficial consequences such as the absence of withdrawal symptoms in the following days (and weeks), although it is debatable whether being exposed to methadone for such a long time could have negative consequences for further development of the preterm neonate (e.g. maturation of central nervous system).
We have shown that 62% of neonates reach target methadone exposure after 48 hours after start of treatment when applying Scenario 3. Additionally, we have observed that a dosing regimen of 4 days maintains effective target attainment in the first week of treatment. Applying such a simplified, but still efficacious, dosing strategy has numerous advantages such as fewer interventions for the patient and reduced risk of administrative errors related to complex dosing schedules. In addition, it should also be recognized that shortened treatment of methadone could have a positive impact on likelihood of opioid dependence. One possible reason that methadone requires less frequent dosing in preterm neonates is the relatively long half‐life. In this analysis it is assumed that the target exposure remains the same over the entire period. It can be hypothesized that the target exposure fluctuates over time because of developing physiology; further research is required to clarify this assumption.
This clinical investigation demonstrates that the clearance of methadone increases with advancing gestational age and higher clearance values and volumes of distribution can be observed for (R)‐methadone as compared to (S)‐methadone in preterm neonates. Simulations that account for developmental PK indicate that current complex dosing schemes might be replaced by a simplified and shortened dosing strategy. Such dosing strategy will not only reduce the risk of measurement errors related to complex dosing schedules, but also lower the number of interventions in these preterm patients. Additional clinical studies are warranted to better understand different metabolites of methadone, investigate genetic variants of the relevant drug‐metabolizing enzymes such as CYP2B6, and evaluate clinical benefits of a simplified methadone dosing strategy in preterm neonates.
COMPETING INTERESTS
M.P. has part‐time employment with the consulting company Certara, USA.
CONTRIBUTORS
S.S.‐Z. and J.v.d.A. designed the study. S.S.‐Z., M.K. and A.B. collected the data. T.v.D. and G.K. performed the analysis. T.v.D., G.K., M.P. and J.v.d.A. contributed to the interpretation of the results. All authors provided critical feedback and helped shape the research, analysis and manuscript.
Supporting information
FIGURE S1
Goodness‐of‐fit plots for final models for (R)‐ and (S)‐methadone. (R)‐methadone and (S)‐methadone values are presented by open and black circles, respectively. A: Observed concentrations vs population predicted concentrations. B: Observed concentrations vs individual predicted concentrations. C: Conditional weighted residuals with interaction (CWRESI) vs population predictions. D: Conditional weighted residuals with interaction vs time after dose
FIGURE S2 Percentage of patients reaching target exposure of 985 mcg/h/L according to different dosing scenarios represented in Table 2. Cumulative area under the curve is calculated for each day, until day seven and thereafter illustrated for four different time periods (e.g. week 1 to week 4)
TABLE S1 Parameters for final population PK model for (R)‐ and (S)‐methadone. RSE, relative standard error; CI, confidence interval; Ka, absorption rate constant; Vd, volume of distribution; CL, clearance; F, bioavailability (unknown because only oral administration); *CV, coefficient of variation (%) presented instead of RSE for values for inter‐individual variability
ACKNOWLEDGEMENTS
T.v.D., M.P., G.K., J.v.d.A would like to thank the Eckenstein‐Geigy Foundation, Basel, Switzerland for their financial support. J.v.d.A. and S.S.‐Z. were also supported by the National Institute of Drug Addiction (K24DA027992).
van Donge T, Samiee‐Zafarghandy S, Pfister M, et al. Methadone dosing strategies in preterm neonates can be simplified. Br J Clin Pharmacol. 2019;85:1348–1356. 10.1111/bcp.13906
PI statement: The authors confirm that the PI for this paper is Dr. Majid Kalani; he had direct clinical responsibility for patients.
Trial registration: Clinicaltrials.gov: NCT01327079
REFERENCES
- 1. Krans EE, Patrick SW. Opioid use disorder in pregnancy: Health policy and practice in the midst of an epidemic. Obstet Gynecol. 2016;128(1):4–10. [DOI] [PMC free article] [PubMed] [Google Scholar]
- 2. Huybrechts KF, Bateman BT, Desai RJ, et al. Risk of neonatal drug withdrawal after intrauterine co‐exposure to opioids and psychotropic medications: Cohort study. BMJ. 2017;358:j3326. [DOI] [PMC free article] [PubMed] [Google Scholar]
- 3. Desai RJ, Hernandez‐Diaz S, Bateman BT, Huybrechts KF. Increase in prescription opioid use during pregnancy among Medicaid‐enrolled women. Obstet Gynecol. 2014;123(5):997–1002. [DOI] [PMC free article] [PubMed] [Google Scholar]
- 4. Ross EJ, Graham DL, Money KM, Stanwood GD. Developmental consequences of fetal exposure to drugs: What we know and what we still must learn. Neuropsychopharmacology. 2015;40(1):61–87. [DOI] [PMC free article] [PubMed] [Google Scholar]
- 5. Stover MW, Davis JM. Opioids in pregnancy and neonatal abstinence syndrome. Semin Perinatol. 2015;39(7):561–565. [DOI] [PMC free article] [PubMed] [Google Scholar]
- 6. Patrick SW, Schumacher RE, Benneyworth BD, Krans EE, McAllister JM, Davis MM. Neonatal abstinence syndrome and associated health care expenditures: United States, 2000–2009. JAMA. 2012;307(18):1934–1940. [DOI] [PubMed] [Google Scholar]
- 7. Jones HE, Fielder A. Neonatal abstinence syndrome: Historical perspective, current focus, future directions. Prev Med. 2015;80:12–17. [DOI] [PubMed] [Google Scholar]
- 8. Finnegan L, Connaughton JJ, Kron R, Emich J. Neonatal abstinence syndrome: Assessment and management. Addict Dis. 1975;2(1–2):141–158. [PubMed] [Google Scholar]
- 9. Green M, Suffet F. The Neonatal Narcotic Withdrawal Index: A device for the improvement of care in the abstinence syndrome. Am J Drug Alcohol Abuse. 1981;8(2):203–213. [DOI] [PubMed] [Google Scholar]
- 10. Wiles JR, Isemann B, Ward LP, Vinks AA, Akinbi H. Current management of neonatal abstinence syndrome secondary to intrauterine opioid exposure. J Pediatr. 2014;165(3):440–446. [DOI] [PMC free article] [PubMed] [Google Scholar]
- 11. Hudak ML, Tan RC. Neonatal drug withdrawal. Pediatrics. 2012;129(2):e540 10.1542/peds.2011-3212 [DOI] [PubMed] [Google Scholar]
- 12. Osborn DA, Jeffery HE, Cole MJ. Opiate treatment for opiate withdrawal in newborn infants. Cochrane Database Syst Rev. 2010;10, CD002059. [DOI] [PubMed] [Google Scholar]
- 13. Davis JM, Shenberger J, Terrin N, et al. Comparison of safety and efficacy of methadone vs morphine for treatment of neonatal abstinence syndrome: A randomized clinical trial. JAMA Pediatr. 2018;172(8):741–748. [DOI] [PMC free article] [PubMed] [Google Scholar]
- 14. Kraft WK, van den Anker JN. Pharmacologic management of the opioid neonatal abstinence syndrome. Pediatr Clin North Am. 2012;59(5):1147–1165. [DOI] [PMC free article] [PubMed] [Google Scholar]
- 15. Wiles JR, Isemann B, Mizuno T, et al. Pharmacokinetics of oral methadone in the treatment of neonatal abstinence syndrome: A pilot study. J Pediatr. 2015;167:1214–1220.e3. [DOI] [PMC free article] [PubMed] [Google Scholar]
- 16. Kharasch ED. Current concepts in methadone metabolism and transport. Clin Pharmacol Drug Dev. 2017;6(2):125–134. [DOI] [PMC free article] [PubMed] [Google Scholar]
- 17. Eap CB, Buclin T, Baumann P. Interindividual variability of the clinical pharmacokinetics of methadone. Clin Pharmacokinet. 2002;41(14):1153–1193. [DOI] [PubMed] [Google Scholar]
- 18. Kharasch ED, Stubbert K. Role of cytochrome P4502B6 in methadone metabolism and clearance. J Clin Pharmacol. 2013;53(3):305–313. [DOI] [PMC free article] [PubMed] [Google Scholar]
- 19. van den Anker J, Reed MD, Allegaert K, Kearns GL. Developmental changes in pharmacokinetics and pharmacodynamics. J Clin Pharmacol. 2018;58:S10–S25. [DOI] [PubMed] [Google Scholar]
- 20. Foster DJ, Somogyi AA, Dyer KR, White JM, Bochner F. Steady‐state pharmacokinetics of (R)‐and (S)‐methadone in methadone maintenance patients. Br J Clin Pharmacol. 2000;50(5):427–440. [DOI] [PMC free article] [PubMed] [Google Scholar]
- 21. Kharasch ED, Hoffer C, Whittington D, Walker A, Bedynek PS. Methadone pharmacokinetics are independent of cytochrome P4503A (CYP3A) activity and gastrointestinal drug transport: Insights from methadone interactions with ritonavir/indinavir. Anesthesiology. 2009;110:660–672. [DOI] [PMC free article] [PubMed] [Google Scholar]
- 22. Dale O, Sheffels P, Kharasch ED. Bioavailabilities of rectal and oral methadone in healthy subjects. Br J Clin Pharmacol. 2004;58(2):156–162. [DOI] [PMC free article] [PubMed] [Google Scholar]
- 23. Owen JS, Fiedler‐Kelly J. Introduction to population pharmacokinetic/pharmacodynamic analysis with nonlinear mixed effects models. Hoboken, NJ: John Wiley & Sons; 2014. [Google Scholar]
- 24. R Core Team . R: A Language and Environment for Statistical Computing, R Foundation for Statistical Computing, Vienna, Austria. 2018. http://www.R‐project.org/
- 25. Mould D, Upton R. Basic concepts in population modeling, simulation, and model‐based drug development. CPT Pharmacometrics Syst Pharmacol. 2012;1:1–14. [DOI] [PMC free article] [PubMed] [Google Scholar]
- 26. Mould D, Upton RN. Basic concepts in population modeling, simulation, and model‐based drug development—Part 2: Introduction to pharmacokinetic modeling methods. CPT Pharmacometrics Syst Pharmacol. 2013;2:1–14. [DOI] [PMC free article] [PubMed] [Google Scholar]
- 27. Koch G, Schropp J. Mathematical concepts in pharmacokinetics and pharmacodynamics with application to tumor growth In: Kloeden P, Pötzsche C, eds. Nonautonomous Dynamical Systems in the Life Sciences. New York, NY: Springer; 2013:225–250. [Google Scholar]
- 28. Bonate PL, Steimer J‐L. Pharmacokinetic‐Pharmacodynamic Modeling and Simulation. New York, NY: Springer; 2011. [Google Scholar]
- 29. Ward RM, Drover DR, Hammer GB, et al. The pharmacokinetics of methadone and its metabolites in neonates, infants, and children. Pediatric Anesthesia. 2014;24(6):591–601. [DOI] [PMC free article] [PubMed] [Google Scholar]
- 30. Kristensen K, Blemmer T, Angelo HR, et al. Stereoselective pharmacokinetics of methadone in chronic pain patients. Ther Drug Monit. 1996;18(3):221–227. [DOI] [PubMed] [Google Scholar]
- 31. Yang F, Tong X, McCarver DG, Hines RN, Beard DA. Population‐based analysis of methadone distribution and metabolism using an age‐dependent physiologically based pharmacokinetic model. J Pharmacokinet Pharmacodyn. 2006;33(4):485–518. [DOI] [PubMed] [Google Scholar]
- 32. Salem AH, Fletcher CV, Brundage RC. Pharmacometric characterization of efavirenz developmental pharmacokinetics and pharmacogenetics in HIV‐infected children. Antimicrob Agents Chemother. 2014;58(1):136–143. [DOI] [PMC free article] [PubMed] [Google Scholar]
- 33. Pearce RE, Gaedigk R, Twist GP, et al. Developmental expression of CYP2B6: A comprehensive analysis of mRNA expression, protein content and bupropion hydroxylase activity and the impact of genetic variation. Drug Metab Dispos. 2016;44(7):948–958. [DOI] [PMC free article] [PubMed] [Google Scholar]
- 34. Tateishi T, Nakura H, Asoh M, et al. A comparison of hepatic cytochrome P450 protein expression between infancy and postinfancy. Life Sci. 1997;61(26):2567–2574. [DOI] [PubMed] [Google Scholar]
- 35. Cole F, Wegner DJ, Davis JM. The genomics of neonatal abstinence syndrome. Front Pediatr. 2017;5:176. [DOI] [PMC free article] [PubMed] [Google Scholar]
- 36. Kharasch ED, Regina KJ, Blood J, Friedel C. Methadone pharmacogenetics: CYP2B6 polymorphisms determine plasma concentrations, clearance, and metabolism. Anesthesiology. 2015;123(5):1142–1153. [DOI] [PMC free article] [PubMed] [Google Scholar]
- 37. Rotger M, Tegude H, Colombo S, et al. Predictive value of known and novel alleles of CYP2B6 for efavirenz plasma concentrations in HIV‐infected individuals. Clin Pharmacol Ther. 2007;81(4):557–566. [DOI] [PubMed] [Google Scholar]
- 38. Jansson LM, Choo R, Velez ML, et al. Methadone maintenance and breastfeeding in the neonatal period. Pediatrics. 2008;121(1):106–114. [DOI] [PubMed] [Google Scholar]
- 39. Wachman EM, Byun J, Philipp BL. Breastfeeding rates among mothers of infants with neonatal abstinence syndrome. Breastfeed Med. 2010;5(4):159–164. [DOI] [PubMed] [Google Scholar]
- 40. Ryan G, Dooley J, Gerber Finn L, Kelly L. Nonpharmacological management of neonatal abstinence syndrome: A review of the literature. J Matern Fetal Neonatal Med. 2018;32(10):1735–1740. [DOI] [PubMed] [Google Scholar]
- 41. Nilsson M‐I, Widerlöv E, Meresaar U, Änggård E. Effect of urinary pH on the disposition of methadone in man. Eur J Clin Pharmacol. 1982;22(4):337–342. [DOI] [PubMed] [Google Scholar]
- 42. Sato T, Takahashi N, Komatsu Y, et al. Urinary acidification in extremely low birth weight infants. Early Hum Dev. 2002;70(1–2):15–24. [DOI] [PubMed] [Google Scholar]
Associated Data
This section collects any data citations, data availability statements, or supplementary materials included in this article.
Supplementary Materials
FIGURE S1
Goodness‐of‐fit plots for final models for (R)‐ and (S)‐methadone. (R)‐methadone and (S)‐methadone values are presented by open and black circles, respectively. A: Observed concentrations vs population predicted concentrations. B: Observed concentrations vs individual predicted concentrations. C: Conditional weighted residuals with interaction (CWRESI) vs population predictions. D: Conditional weighted residuals with interaction vs time after dose
FIGURE S2 Percentage of patients reaching target exposure of 985 mcg/h/L according to different dosing scenarios represented in Table 2. Cumulative area under the curve is calculated for each day, until day seven and thereafter illustrated for four different time periods (e.g. week 1 to week 4)
TABLE S1 Parameters for final population PK model for (R)‐ and (S)‐methadone. RSE, relative standard error; CI, confidence interval; Ka, absorption rate constant; Vd, volume of distribution; CL, clearance; F, bioavailability (unknown because only oral administration); *CV, coefficient of variation (%) presented instead of RSE for values for inter‐individual variability