

Abstract

Burn injury can be a devastating traumatic injury, with long-term personal and social implications for the patient. The many complex local and disseminating pathological processes underlying burn injury’s clinical challenges are orchestrated from the site of injury and develop over time, yet few studies of the molecular basis of these mechanisms specifically explore the local signaling environment. Those that do are typically destructive in nature and preclude the collection of longitudinal temporal data. Burn injury therefore exemplifies a superficial temporally dynamic pathology for which experimental sampling typically prioritizes either specificity to the local burn site or continuous collection from circulation. Here, we present an exploratory approach to the targeted elucidation of complex, local, acutely temporally dynamic interstitia through its application to burn injury. Subcutaneous microdialysis is coupled with ultraperformance liquid chromatography–mass spectrometry (UPLC–MS) analysis, permitting the application of high-throughput metabolomic profiling to samples collected both continuously and specifically from the burn site. We demonstrate this workflow’s high yield of burn-altered metabolites including the complete structural elucidation of niacinamide and uric acid, two compounds potentially involved in the pathology of burn injury. Further understanding the metabolic changes induced by burn injury will help to guide therapeutic intervention in the future. This approach is equally applicable to the analysis of other tissues and pathological conditions, so it may further improve our understanding of the metabolic changes underlying a wide variety of pathological processes.
Microdialysis is a sampling method allowing in vivo collection of solutes primarily from the extracellular interstitium.1 The technique consists of inserting a porous probe into a target tissue and perfusing it with physiological saline, allowing passive uptake of molecules from the extracellular milieu. This sampling method enables the collection of continuous, longitudinal data from specific sites and can be applied to elucidating localized and temporally dynamic physiological or pathophysiological processes. Microdialysis has been used extensively to explore molecular mechanisms in a variety of pathologies and tissues including skin,2 adipose tissue,3 muscle,4 liver,5 heart,6 eye, and brain.7,8
Microdialysate is traditionally analyzed using targeted analytical platforms such as radioimmunoassays or enzyme-linked immunosorbent assays (ELISAs).9 By design, this restricts the range of measured analytes to those included in the assay. Conversely, untargeted “omics” techniques are not limited to analyzing a predetermined selection of molecules; they characteristically measure as many molecules as possible without bias. Such “global” profiling approaches generally attain a high yield of data, exceeding the capacity of targeted assays.10−12 Further, because of the platforms’ exploratory approach, these data typically include molecules not previously considered or identified within the given tissue or pathology. Among the “omics” techniques, metabolomics, the study of small (typically <2 kDa) molecules, has proven viable in elucidating the chemical composition of various sample types with both targeted13 and global14 experimental designs. Specifically, global metabolomics has been applied to microdialysates collected from various tissues such as muscle,4 liver,5 and brain,15 but not yet to skin microdialysate. Global metabolomics typically utilizes one of two analytical platforms: mass spectrometry (MS) preceded by a separation method such as liquid or gas chromatography, or nuclear magnetic resonance (NMR) spectroscopy.14,16,17 While NMR has the advantage of being nondestructive, ultraperformance liquid chromatography (UPLC)–MS is capable of higher resolution multivariate data acquisition18,19 and can detect lower analyte concentrations from smaller sample volumes than other platforms.19,20 In order to achieve maximum metabolome coverage, platform selection should therefore depend on the characteristics of the sample. Microdialysate is typically collected in the low microliter per minute range and dilutes the uptaken molecules during recovery,1 indicating that assay sensitivity should be a priority.
Burn injury, one of the most common traumatic skin pathologies, can induce severe tissue denaturation and local inflammatory reactions, significantly altering the chemical composition of the cutaneous interstitium. These changes can underlie the development of excruciating pain and progress to life-threatening systemic inflammatory states.21 Despite significant advances in burn care and mortality reduction, effective treatment of burn injury-associated systemic inflammatory response syndrome (SIRS) and pain remains a major clinical challenge. This may be addressed with an enhanced understanding of the chemical characteristics of the postburn interstitium. Here, the viability of global metabolomics was considered as a tool for measuring burn injury-induced time-dependent changes in the cutaneous interstitial metabolite profile. Specifically, UPLC–MS was applied to the analysis of continuously collected microdialysates sampled simultaneously from naive and burn-injured skin for the identification of changes to the interstitial metabolomic profile over time, enabling the measurement of individual metabolites discriminating between physiological and pathological tissue states. Both polar analytes and lipids were profiled in a single analysis—with a run time of 12 min—and key metabolites discriminating between burn-injured and control sites were structurally elucidated. The discovery of these molecules should enhance our understanding of the changes in metabolic processes occurring in burn injury and may ultimately enable guidance of therapeutic interventions.
Experimental Section
Materials
The drugs used for anesthesia were isoflurane (Abbott, Maidenhead, U.K.) and urethane (Sigma, Gillingham, U.K.). Ringer’s solution (sodium chloride, potassium chloride, calcium chloride, and sodium bicarbonate) used as microdialysis perfusate was obtained from Baxter (Northampton, U.K.). Solvents for metabolite extraction from microdialysates (LC–MS grade water and methanol) were obtained from Sigma (Gillingham, U.K.). Prepared samples were placed in Total Recovery MS vials (Waters) for UPLC–MS analysis. The chromatography solvents were water (LC–MS Chromasolv grade; Sigma) and methanol (LC–MS Chromasolv grade; Sigma), used with an HSS T3 column (1.8 μm, 100 mm × 2.1 mm; Waters Corporation, U.S.A.). Formic acid, leucine enkephalin, and sodium formate were obtained from Sigma. Nicotinamide (niacinamide) and uric acid, used as standards, were also obtained from Sigma.
Animals
All procedures were performed in accordance with the U.K. Animals (Scientific Procedures) Act 1986, the revised National Institutes of Health Guide for the Care and Use of Laboratory Animals, the Directive 2010/63/EU of the European Parliament and of the Council on the Protection of Animals Used for Scientific Purposes, and the guidelines of the Committee for Research and Ethical Issues of IASP published in Pain, 1983, 16, 109–1106877845. We observed good laboratory practice, and all procedures on animals were approved by veterinary services (Central Biological Services) at Imperial College London, U.K.
Four male Sprague–Dawley rats (125–200 g) were housed in climate-controlled rooms on a 12 h light/dark cycle and with food and water ad libitum. They were briefly sedated with inhalational isoflurane (5%) before induction of general anesthesia with 1.5 g/kg urethane by intraperitoneal (ip) injection. Body temperature was monitored and maintained at 37 °C with a heat blanket, rectal thermometer, and homeothermic control unit (50-7061-F; Harvard Apparatus). Animals were terminally anesthetized by intraperitoneal sodium pentobarbital (40 mg) and decapitated upon completion of microdialysis.
Microdialysis and Burn Model
Microdialysis was conducted with 400 μm 3000 kDa (3 MDa) cutoff microdialysis catheters (Dermal Dialysis, Erlanger, Germany). The probes had an inner diameter of 340 μm, a membrane thickness of 50 μm, and a pore size of 0.3 μm and were perfused with Ringer’s solution at 2 μL/min with a model “22” syringe pump (Harvard Apparatus). Microdialysis probes were briefly perfused to lubricate their exteriors, easing insertion. Probes were then inserted into the dermis of the dorsal aspects of both hind paws, leaving the skin through exit punctures with an active uptake distance of 10 mm. The attached 25 G insertion needles were subsequently removed to expose the probe outlets for sample collection.
Probes were inserted into the skin prior to the burn in order to allow for both a 20 min equilibration period, during which outflow rates stabilize, and a 30 min “flush” period, during which the interstitium recovers from probe insertion. This flush period will be referred to as the “postprobe insertion baseline”. Equilibration period microdialysates were discarded, while postprobe insertion baseline microdialysates were used for comparison of the preburn metabolic profiles between both microdialysis sites. While 30 min has proven sufficient for fluidics and tissue stabilization following probe insertion,22 microdialysis was presently conducted for a combined total of 50 min prior to burn induction.
The deep partial-thickness burn was induced as described previously by submerging one hind paw in 60 °C saline to the ankle for 2 min while the contralateral paw was simultaneously submerged in room temperature saline.23,24 Microdialysis was conducted for 0.5 h preburn and 3 h postburn. Microdialysates were collected in half hour fractions for time series analysis (Figure 1) and were stored at −80 °C. Microdialysis sites were excised for verification of probe depth after the animal was sacrificed. A full description of all samples collected and analyzed using UPLC–MS is given in Table S1.
Figure 1.
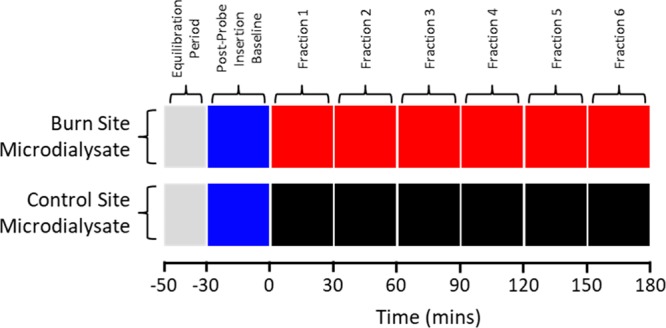
Classes of microdialysate fractions collected over the course of each experiment and their corresponding time points for both burn and control sites. The colors correspond to the data derived from these samples presented in Figure 4.
Sample Collection
The resistance to manual insertion of the guide needle was lower in the subcutis than in the dermis and could be used as a guide for probe depth during insertion. Probes were inserted such that the semipermeable membrane began at the skin border and the proximal portion was entirely enclosed by nonpermeable polypropylene tubing. The probe was shortened distal to the active uptake site to further minimize exposure of the semipermeable membrane to the outer environment and therefore evaporation. Histological analysis confirmed the positioning of the probe at the dermal border of the subcutaneous tissue and the deep partial thickness of the burn, which extended to the reticular dermis.23
Sample Preparation
Half-hour microdialysate fractions (∼50 μL, following an apparent loss of ∼10 μL perfusate to the tissue and/or evaporation) first underwent protein precipitation by dilution 1:3 in −20 °C methanol and vortexing for 20 s.25 The resulting 240 μL samples were stored at −20 °C for 20 min before being centrifuged for 10 min at 12 000 rpm for the removal of insoluble precipitates and protein. Supernatants were transferred to clean tubes and dried in a vacuum concentrator (Eppendorf Concentrator Plus “Speed Vac”) in V-AQ mode at 45 °C for 2 h. Dried samples were resuspended and sonicated in 50 μL of LC–MS grade water (Sigma) before transfer to Total Recovery vials (Waters Corp., U.S.A.). Quality control samples (QCs) were prepared by combining 5 μL from each sample to form a representative pool.26 The complete workflow is illustrated in Figure 2.
Figure 2.

Microdialysate sampling and analysis workflow, showing the major steps progressing to metabolite identification.
UPLC–MS Analysis
UPLC–MS analysis was performed using an Acquity UPLC system (Waters Corp., U.S.A.) with an HSS T3 column (1.8 μm; 100 mm × 2.1 mm, Waters Corp., U.S.A.) coupled to a Synapt G2-S Q-TOF mass spectrometer (Waters MS Technologies, U.K.) operating in both positive (ESI+) and negative (ESI−) electrospray ionization modes. Chromatography was performed with a 5 μL injection volume at 40 °C and a flow rate of 400 μL/min with solvents A (0.1% formic acid in water) and B (0.1% formic acid in methanol). The 12 min gradient, concluding with 2 min of re-equilibration, was designed as follows: 0–1 min, 1% B (hold); 1–3 min, 1–15% B (linear); 3–6 min, 15–50% B (linear); 6–9 min, 50–95% B (linear); 9–10 min, 95% B (hold); 10–10.1 min, 1% B (linear), 10.1–12 min, 1% B (hold). ESI+ and ESI– modes were both performed with a 30 V cone voltage, 120 °C source temperature, 450 °C desolvation temperature, 900 L/h desolvation gas flow, and 50 L/h cone gas flow but with capillary voltages of 1 and −1 kV, respectively. The Synapt was operated in sensitivity mode with acquisition ranging between m/z 100 and 1200, a scan time of 0.1 s, an interscan delay of 0.01 s, and centroid mode data collection. Leucine enkephalin (MW 555.62; 200 pg/μL in 50:50 acetonitrile/water) was used as the lock mass with an analyte-to-reference scan ratio of 10:1. Lock mass scans were collected every 30 s and averaged over three scans to perform mass correction. Prior to the analysis, the instrument was calibrated using 0.5 mM sodium formate. The QC sample was first used to condition the column with 10 consecutive injections, and then subsequently injected after every 10 sample injections to monitor system stability and run time effects.26 The sample run order was randomized.
Data Processing and Statistical Analysis
Data (ESI+ and ESI– mode) were converted to netCDF format using DataBridge within MassLynx software v4.1 (Waters Inc.) and exported for use with the freeware XCMS.27 XCMS detected peaks within the raw data using the centWave algorithm28 with a 3–15 s peak width window and a 30 ppm mass accuracy window. A 0.1 Da m/z width was used for grouping, which prior to retention time correction employed a 10 s bandwidth. Following retention time correction, the bandwidth was determined by a specific feature’s retention time deviation profile. Data were normalized via median fold normalization to control for any variation in overall sample concentration and underwent a variance-stabilizing transformation to convert multiplicative noise into additive noise.29 The XCMS output consisted of a table of metabolite features reported by mass-to-charge ratio (m/z) value, retention time, and peak area and contained isotopes, adducts, and fragments as separate features. This output was analyzed in Simca V.13.0.3 (Umetrics, Sweden) using principal components analysis (PCA). Data underwent pareto scaling and a logarithmic transformation [10 log(peak height +20)]. Scores plots were used to examine the interrelationship—or lack thereof—between data grouped into three classes: (preburn) postprobe insertion baseline microdialysates (from both burn and control sites), burn microdialysates, and control microdialysates. After confirming separation between the burn and control data, partial least-squares discriminant analysis (PLS-DA) was applied to rank variables (metabolite features) contributing to the difference via their variable influence on projection (VIP) values; a cutoff of >2 was considered sufficient for further evaluation. Model robustness was evaluated based on R2X values reflecting the fraction of X variables that are explained by the model, and R2Y values reflecting the fraction of variation of Y values that are explained by the model. Cross-validation analysis of variance (CV-ANOVA), a diagnostic tool for assessing the reliability of PLS models, was applied for model validation.
Metabolite Structural Assignment
The m/z measurements of features meeting the PLS-DA VIP cutoff (>2.0) were screened for likely parent ions by excluding isotopes, adducts, and fragments among feature groups with a shared retention time. From these, candidates for structural elucidation via tandem mass spectrometry (MS/MS) were selected on the basis of signal and VIP strength and, in some cases, further sharing an m/z ratio with a potentially clinically relevant metabolite as returned by searches of the HMDB30,31 and Metlin32 databases.
MS/MS was performed using the same Acquity UPLC system (Waters Corp., U.S.A.) with an HSS T3 column (1.8 μm, 100 mm × 2.1 mm, 1.7 μm; Waters Corp., U.S.A.) coupled to a Synapt G2-S Q-TOF (Waters MS Technologies, U.K.). Chromatographic and MS source parameters were the same as for the MS experiments, though with a collision energy ramp of 10–40 V. The fragmentation profiles obtained for each feature were compared with those available in the above databases for entries with matching m/z measurements, or with previously published spectra. Further MS/MS analysis was performed, in which microdialysate samples were analyzed alongside authentic standards under identical UPLC–MS/MS conditions. The m/z measurements, chromatographic retention times, and fragmentation profiles of the features within the sample and the standard solution were compared to confirm or exclude the target’s proposed molecular structure.
Data Availability
Data will be deposited in Metabolights (https://www.ebi.ac.uk/metabolights/) to be made publicly available.
Results and Discussion
Sampling Considerations
The selection of a perfusion rate balances the inverse relationship between relative recovery (the solute concentration in the microdialysate relative to the tissue) and absolute recovery (the total amount of solute recovered), which is complicated by the increasing influence of solvent ultrafiltration and convection (“solvent drag”) with higher perfusion rates. Here, relative recovery was prioritized over absolute recovery, and hence sample concentration over volume, in utilizing a low perfusion rate (2 μL/min). While robust experimental designs employing UPLC–MS require repeated sample injections for multiple analytical steps and can further apply alternative protocols increasing coverage (e.g., additional ionization modes), the platform’s sensitivity still allows for low perfusion rates and sample volumes such as those in the present work. The probe’s MW cutoff, which far exceeds the size of the intended analytes at 3000 kDa, is evidently viable for the recovery of metabolites. Similarly, the perfusate (Ringer’s solution), sample storage temperature (−80 °C) and preparation, and the active probe uptake length (10 mm) prove applicable for microdialysate analysis by UPLC–MS.
Analytical Considerations
Reliable metabotype definition requires consistent analyte separation and detection. Chromatographic performance was evaluated by the intensity (peak area) and spread of chromatographic peaks across the run time, indicating gradient suitability and confirming the recovery of analytes through microdialysis at concentrations detectable by UPLC–MS using both positive- and negative-mode ionization (Figure 3, parts A and B). Both water-soluble and moderately polar analytes—rather than hydrophobic metabolites—were retained and detected as expected due to the fluid state of the interstitium. However, the overlapping early eluting peaks indicate the presence of many hydrophilic compounds; these could be separated via hydrophilic interaction chromatography (HILIC), enhancing metabolome coverage with the present sample preparation in combination with reversed-phase (RP) chromatography. The present peak separation supports the viability of our gradient’s design in extending denser elution periods (Figure 3, parts A and B), along with all associated performance parameters.
Figure 3.
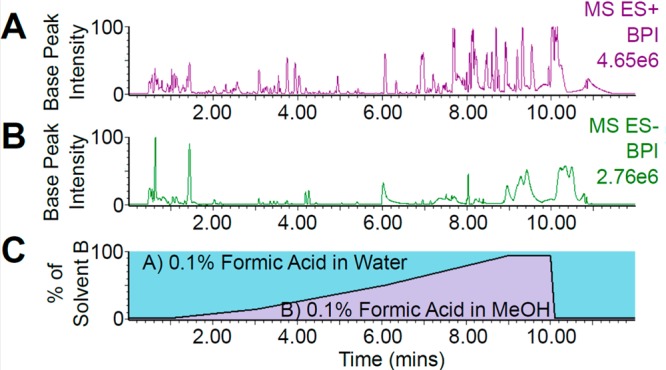
UPLC–MS (ESI+ and ESI−) chromatograms of burn site microdialysate and solvent gradient. The presence and intensity of peaks recorded from a a single burn site microdialysate fraction in ESI+ (A) and ESI– mode (B) and the spread of elution times indicates the viability of both ionization modes and the present solvent gradient (C) for wide metabolome coverage. t0 = 0.43 min.
Burn Injury Affects the Metabolic Profile of Microdialysate
Having confirmed the separation and detection of potentially hundreds of analytes by UPLC and their presence at concentrations detectable by MS, PCA was applied for multivariate comparison of burn and control data and detection of outliers (Figure 4, parts A and B). The PCA plots were generated via the analysis of 42 364 and 13 829 metabolite features for positive and negative ESI mode, respectively. Whether recorded using ESI+ (Figure 4A) or ESI– (Figure 4B), clear separation can be observed between microdialysates collected from burned tissue and both the postprobe insertion baseline samples (i.e., those collected from either site prior to the burn) and the control site, as evidenced by the clustering in PC1. The grouping of the postprobe insertion baseline samples indicates that both microdialysis sites had a similar metabotype prior to the burn, while the tight QC sample grouping indicates acquisition stability over the course of the experiment. Three samples were outlying in the ESI– data, likely due to sample contamination, and were removed from further analysis. These samples did not show as outliers in the ESI+ data and were therein retained for further analysis.
Figure 4.
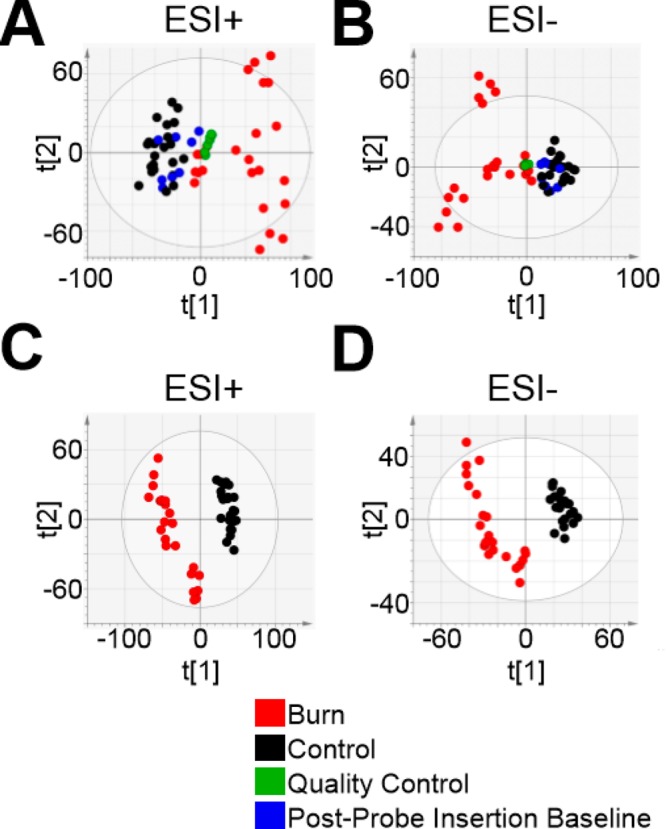
Deep partial-thickness burn injury alters the metabolic profile of subcutaneous microdialysate. PCA scores plots indicate clear separation of burn (red) from control (black) and preinjury (blue) microdialysate samples, as well as tight quality control (QC) sample (green) grouping with both ESI+ (A) and ESI– modes (B). Each data point represents an individual microdialysate fraction. The divergence of the burn site data is consistent with a progressive effect of the burn on the interstitium as all time points are included. PCA t1 and t2 values were 0.196 and 0.109 for the positive-mode PCA and 0.239 and 0.13 for the negative-mode data. Subsequent PLS-DA constructed well-fitting, highly predictive models for both ESI+ [C; R2X(cum) 0.363, R2Y(cum) 0.985, Q2(cum) 0.939] and ESI– [D; R2X(cum) 0.601, R2Y(cum) 0.996, Q2(cum) 0.97] with score plots expressing separation between postburn burn and control site metabolic profiles. Red, burn; black, control; green, quality control; blue, postprobe insertion baseline.
As shown previously,23 probe insertion is itself a pathological event. While trauma can be minimized with careful insertion of a sufficiently thin and lubricated probe, a “flush” period is required for stabilization of the extracellular interstitium. Given the consistency between postprobe insertion baseline (preburn) and control-site metabolic profiles, and their divergence from the burn profiles exhibited via PCA (indicated by their groupings in Figure 4, parts A and B), any effect of probe insertion was negligible compared to that of the burn. In any case, should any transient effect of the probe insertion have been measured, postprobe insertion baseline data were not used to identify metabolites discriminating between burn and control metabolomes.
The spread of samples observed in PC2 of the PCA plots indicates a difference in metabolic profiles within the study groups. A larger difference can be observed within the burn group compared with controls, likely as a consequence of intersubject and time-dependent differences in response to the burn trauma. In particular, three distinct sample groupings can be observed in the ESI– burn data (Figure 4B; red); the two groups furthest removed from the rest of the data represent burn samples from two individual animals, demonstrating the influence of intersubject variability. However, the clarity of the unsupervised separation between burn and control data suggests that the burn is an outstanding source of variation in the data.
Supervised PLS-DA was therefore applied for a comparison specifically between the burn and control data, in which separation was clear and intersubject variability was less evident (indicating continuity between the burn metabolomes of different subjects within this analysis). PLS-DA plots were generated using the same 42 364 and 13 829 features for ESI+ and ESI– mode, respectively. PLS-DA constructed well-fitting, highly predictive models for both ESI+ [Figure 4C; R2X(cum) 0.363, R2Y(cum) 0.985, Q2(cum) 0.939] and ESI– [Figure 4D; R2X(cum) 0.601, R2Y(cum) 0.996, Q2(cum) 0.97] data. Model robustness was affirmed using CV-ANOVA for both ESI+ (p = 6.20095 × 10⁻²²) and ESI– (p = 3.547 × 10⁻¹⁹). Metabolic profile variables representing metabolites (i.e., features) were ranked by their correlation with class separation, quantified as variable influence on projection (VIP) values, to identify those expressing an experimental effect. Features exceeding a predetermined VIP threshold of >2.0 were prioritized for structural elucidation. Both PLS-DA models yielded subsets of burn-altered features that were viable for screening, with 2187 and 757 features exceeding the VIP threshold in the ESI+ and ESI– data, respectively. The top 30 metabolite features—as ranked by their VIP value—are reported for ESI+ and ESI– mode in Table S2. Interestingly, the concentrations of all metabolite features contained in Table S2 and all features selected for structural elucidation were increased at the burn site.
Structural Identification of Metabolites Altered after Burn Injury
Having identified features exhibiting different abundances between burn and control samples via PLS-DA, a subset of features were selected for MS/MS analysis. Each feature was selected for its high VIP value, signal intensity, and level of fragmentation profile detail. Of 84 target metabolites, two included features, m/z 123.1/83 (ESI+) and m/z 167/85 (ESI−), had high respective VIP values of 2.04 and 2.01, as reflected in the clarity of a burn effect in their temporal profiles (Figure 5, parts A and B). Through MS/MS analysis, comparison with fragmentation data from online databases (Figure 6, parts A and B), and consecutive analysis of the target feature and its respective authentic standard under identical UPLC–MS conditions (Figure 6C–F), these two features were confirmed to be niacinamide (Figure 6, parts A, C, and E) and uric acid (Figure 6, parts B, D, and F), respectively. Further identification of altered metabolites is ongoing, in order to gain a deeper understanding of the metabolic changes occurring.
Figure 5.
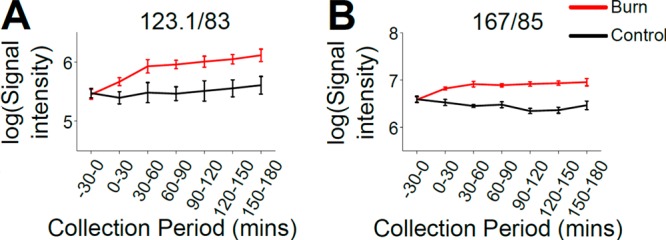
High-VIP metabolite features were elevated in burn injury microdialysates. Features m/z 123.1/83 (A) and 167/85 (B) yielded high VIP values (2.04 and 2.01, respectively), reflecting that they were among the metabolites contributing most to the separation between burn and control data in the PLS-DA. This was evident in the difference between their burn and control site temporal profiles. Signal intensities are log-transformed and expressed as mean ± SEM.
Figure 6.

Microdialysate feature fragmentation profiles and retention times were matched with reference HMDB spectra and authentic standard solutions for the structural elucidation of niacinamide and uric acid as burn-elevated interstitial metabolites. Similar mass spectra were recorded (A and B) between experimental data (red) and reference HMDB spectra (blue), overlaid, indicating the structural similarity of the parent features m/z 123.1/83 (A) and 167/98 (B) to niacinamide (A) and uric acid (B), respectively. Major fragments within these spectra are annotated with their expected molecular structures. Retention times of the endogenous target metabolites were identical to those of niacinamide (C) and uric acid (E), respectively. MS/MS fragmentation profiles were highly reproducible between the target features and their respective standard solutions, confirming the molecular identities of m/z 123.1/83 and 167/98 as niacinamide (D) and uric acid (F), respectively. Red, data recorded presently from unidentified feature; blue, externally sourced profile; black, data from authentic standard solution.
Niacinamide Is Elevated in the Postburn Interstitium
Niacinamide (nicotinamide) is the amide in vivo product of nicotinic acid (niacin, vitamin B3) and is also a precursor of the coenzymes nicotinamide adenine dinucleotide (NAD) and nicotinamide adenine dinucleotide phosphate (NAD-P). Pharmacological applications of niacinamide exert antipruritic, antimicrobial, and vasoactive effects33 and are protective in various inflammatory cutaneous conditions,34−36 though it is not known if these occur at concentrations generated endogenously.33 Niacinamide has not been used to treat burn injury clinically, though it enhances wound healing upon systemic administration37 and corrects postburn nicotinamide coenzyme system imbalances38 experimentally. The present work is therefore the first to report the elevation of niacinamide in burn injury. Given its extensive anti-inflammatory effects39 and protective roles in experimental burn injury,37,38 its potential function as an endogenous regulator of local inflammation and its therapeutic viability for burn injury in clinical settings should be explored.
Interstitial Uric Acid Is Elevated Postburn
Uric acid is a heterocyclic compound generated during purine nucleotide metabolism. It crystallizes at high concentrations, as underlies its principal pathological implication in gout; uric acid crystals deposit in joints, tendons, and surrounding tissues, leading to inflammation.40 Further, excess circulating uric acid has been associated with hypertension, metabolic syndrome, coronary artery disease, cerebrovascular disease, vascular dementia, pre-eclampsia, and kidney disease.41 Circulating uric acid is elevated in the plasma of severely burned patients,42 consistent with its systemic regulation by renal clearance43 and the high frequency of acute kidney injury postburn.44,45 However, its elevation has been implicated in acute kidney injury’s pathogenesis and inflammatory effects and therefore may not simply be a consequence of impaired renal function.46−49 The current findings are consistent with a previous study identifying elevated uric acid in rat plasma, one of few previous metabolomic studies of burn injury.43 However, the present work is the first report of uric acid’s local interstitial increase postburn. The elevation’s specificity to the burn site suggests either that uric acid does not disseminate systemically within the 3 h time course of this experiment, or that uric acid does not perfuse into the subcutis from the circulation. In either case, uric acid sourced at the burn site may both mediate local inflammation and disseminate, contributing to its increased circulatory availability alongside impaired renal clearance and global tissue hypoxia-induced elevation of xanthine oxidase activity.47,49 Exploring the roles of locally sourced uric acid and hypoxia, and their interaction, in postburn inflammation and kidney function could present an avenue for therapeutic intervention in burn injury.
Conclusion
The present work exemplifies a metabolomic analysis applicable to samples collected by microdialysis, demonstrating the viability of various incorporated experimental design elements including the sampling technique, RP chromatography and column choice, the solvent gradient, and application of both ESI+ and ESI– ionization modes. Collectively, these constitute a novel configuration for the collection and metabolomic analysis of interstitial fluid. Importantly, while experimental designs collecting longitudinal data are often limited to systemic sampling methods, microdialysis allows for the collection of continuous data that is specific to the collection site. It is therefore ideal for the investigation of temporally dynamic superficial interstitia, as was exemplified in its present application to deep partial-thickness burn injury. The amount and detail of the metabolic data collected in this context, including the full structural elucidation of two novel local metabolites among extensive further metabolome coverage, demonstrate the viability of UPLC–MS as a highly sensitive exploratory platform for microdialysate analysis. Further investigation of these metabolites, particularly in the context of human studies, can improve our understanding of the complex processes occurring during burn injury and potentially guide therapeutic interventions. We expect that this workflow could be similarly applied to many varying tissues and pathological states and encourage its utilization in further research areas.
Acknowledgments
E.J.W. acknowledges Waters Corporation for funding. D.F. acknowledges the NC3Rs for the funding of his Ph.D. studentship. H.L. acknowledges the Wellcome Trust for funding.
Supporting Information Available
The Supporting Information is available free of charge on the ACS Publications website at DOI: 10.1021/acs.analchem.8b05615.
Description of all samples collected and analyzed and the top 30 metabolite features as ranked by VIP value (PDF)
The authors declare no competing financial interest.
Supplementary Material
References
- Ungerstedt U. Microdialysis--principles and applications for studies in animals and man. J. Intern. Med. 1991, 230 (4), 365–73. 10.1111/j.1365-2796.1991.tb00459.x. [DOI] [PubMed] [Google Scholar]
- Gill C.; Parkinson E.; Church M. K.; Skipp P.; Scott D.; White A. J.; O’Connor C. D.; Clough G. F. A Qualitative and Quantitative Proteomic Study of Human Microdialysate and the Cutaneous Response to Injury. AAPS J. 2011, 13, 309–317. 10.1208/s12248-011-9269-6. [DOI] [PMC free article] [PubMed] [Google Scholar]
- Summers L. K. Adipose tissue metabolism, diabetes and vascular disease--lessons from in vivo studies. Diabetes Vasc. Dis. Res. 2006, 3 (1), 12–21. 10.3132/dvdr.2006.001. [DOI] [PubMed] [Google Scholar]
- Hadrevi J.; Ghafouri B.; Sjors A.; Antti H.; Larsson B.; Crenshaw A. G.; Gerdle B.; Hellstrom F. Comparative metabolomics of muscle interstitium fluid in human trapezius myalgia: an in vivo microdialysis study. Eur. J. Appl. Physiol. 2013, 113 (12), 2977–89. 10.1007/s00421-013-2716-6. [DOI] [PMC free article] [PubMed] [Google Scholar]
- Hrydziuszko O.; Silva M. A.; Perera M. T.; Richards D. A.; Murphy N.; Mirza D.; Viant M. R. Application of metabolomics to investigate the process of human orthotopic liver transplantation: a proof-of-principle study. OMICS 2010, 14 (2), 143–150. 10.1089/omi.2009.0139. [DOI] [PubMed] [Google Scholar]
- Povlsen J. A.; Lofgren B.; Dalgas C.; Birkler R. I.; Johannsen M.; Stottrup N. B.; Botker H. E. Protection against myocardial ischemia-reperfusion injury at onset of type 2 diabetes in Zucker diabetic fatty rats is associated with altered glucose oxidation. PLoS One 2013, 8 (5), e64093. 10.1371/journal.pone.0064093. [DOI] [PMC free article] [PubMed] [Google Scholar]
- Ferrier J.; Bayet-Robert M.; Dalmann R.; El Guerrab A.; Aissouni Y.; Graveron-Demilly D.; Chalus M.; Pinguet J.; Eschalier A.; Richard D.; Daulhac L.; Marchand F.; Balayssac D. Cholinergic Neurotransmission in the Posterior Insular Cortex Is Altered in Preclinical Models of Neuropathic Pain: Key Role of Muscarinic M2 Receptors in Donepezil-Induced Antinociception. J. Neurosci. 2015, 35 (50), 16418–30. 10.1523/JNEUROSCI.1537-15.2015. [DOI] [PMC free article] [PubMed] [Google Scholar]
- Carpenter K. L. H.; Jalloh I.; Gallagher C. N.; Grice P.; Howe D. J.; Mason A.; Timofeev I.; Helmy A.; Murphy M. P.; Menon D. K.; Kirkpatrick P. J.; Carpenter T. A.; Sutherland G. R.; Pickard J. D.; Hutchinson P. J. 13C-labelled microdialysis studies of cerebral metabolism in TBI patients. Eur. J. Pharm. Sci. 2014, 57, 87–97. 10.1016/j.ejps.2013.12.012. [DOI] [PMC free article] [PubMed] [Google Scholar]
- Shippenberg T. S.; Thompson A. C. Overview of Microdialysis. Curr. Protoc. Neurosci. 1997, 00, 7.1.1–7.1.22. 10.1002/0471142301.ns0701s00. [DOI] [PMC free article] [PubMed] [Google Scholar]
- Brewis I. A.; Brennan P. Proteomics technologies for the global identification and quantification of proteins. Adv. Protein Chem. Struct. Biol. 2010, 80, 1–44. 10.1016/B978-0-12-381264-3.00001-1. [DOI] [PubMed] [Google Scholar]
- Patti G. J.; Yanes O.; Siuzdak G. Metabolomics: the apogee of the omic triology. Nat. Rev. Mol. Cell Biol. 2012, 13 (4), 263–269. 10.1038/nrm3314. [DOI] [PMC free article] [PubMed] [Google Scholar]
- Hawkins R. D.; Hon G. C.; Ren B. Next-Generation Genomics: an Integrative Approach. Nat. Rev. Genet. 2010, 11 (7), 476–86. 10.1038/nrg2795. [DOI] [PMC free article] [PubMed] [Google Scholar]
- Roberts L. D.; Souza A. L.; Gerszten R. E.; Clish C. B. Targeted Metabolomics. Curr. Protoc. Mol. Biol. 2012, 98, 30.2.1–30.2.24. 10.1002/0471142727.mb3002s98. [DOI] [PMC free article] [PubMed] [Google Scholar]
- Schrimpe-Rutledge A. C.; Codreanu S. G.; Sherrod S. D.; McLean J. A. Untargeted metabolomics strategies - Challenges and Emerging Directions. J. Am. Soc. Mass Spectrom. 2016, 27 (12), 1897–905. 10.1007/s13361-016-1469-y. [DOI] [PMC free article] [PubMed] [Google Scholar]
- Wibom C.; Surowiec I.; Moren L.; Bergstrom P.; Johansson M.; Antti H.; Bergenheim A. T. Metabolomic patterns in glioblastoma and changes during radiotherapy: a clinical microdialysis study. J. Proteome Res. 2010, 9 (6), 2909–19. 10.1021/pr901088r. [DOI] [PubMed] [Google Scholar]
- Lanza I. R.; Zhang S.; Ward L. E.; Karakelides H.; Raftery D.; Nair K. S. Quantitative Metabolomics by (1)H-NMR and LC-MS/MS Confirms Altered Metabolic Pathways in Diabetes. PLoS One 2010, 5 (5), e10538. 10.1371/journal.pone.0010538. [DOI] [PMC free article] [PubMed] [Google Scholar]
- Nicholson J. K.; Lindon J. C.; Holmes E. ‘Metabonomics’: understanding the metabolic responses of living systems to pathophysiological stimuli via multivariate statistical analysis of biological NMR spectroscopic data. Xenobiotica 1999, 29 (11), 1181–9. 10.1080/004982599238047. [DOI] [PubMed] [Google Scholar]
- Keun H. C.; Athersuch T. J. Nuclear magnetic resonance (NMR)-based metabolomics. Methods Mol. Biol. 2011, 708, 321–34. 10.1007/978-1-61737-985-7_19. [DOI] [PubMed] [Google Scholar]
- Veenstra T. D. Metabolomics: the final frontier?. Genome Med. 2012, 4 (4), 40. 10.1186/gm339. [DOI] [PMC free article] [PubMed] [Google Scholar]
- Liu G.; Wang Y.; Wang Z.; Cai J.; Lv X.; Zhou A. Nuclear magnetic resonance (NMR)-based metabolomic studies on urine and serum biochemical profiles after chronic cysteamine supplementation in rats. J. Agric. Food Chem. 2011, 59 (10), 5572–8. 10.1021/jf104129k. [DOI] [PubMed] [Google Scholar]
- Toliver-Kinsky T.; Kobayashi M.; Suzuki F.; Sherwood E. R.. 19-The Systemic Inflammatory Response Syndrome. In Total Burn Care, 5th ed.; Herndon D. N., Ed.; Elsevier, 2018; pp 205–220; e4. [Google Scholar]
- Chaurasia C. S.; Muller M.; Bashaw E. D.; Benfeldt E.; Bolinder J.; Bullock R.; Bungay P. M.; DeLange E. C.; Derendorf H.; Elmquist W. F.; Hammarlund-Udenaes M.; Joukhadar C.; Kellogg D. L. Jr.; Lunte C. E.; Nordstrom C. H.; Rollema H.; Sawchuk R. J.; Cheung B. W.; Shah V. P.; Stahle L.; Ungerstedt U.; Welty D. F.; Yeo H. AAPS-FDA Workshop White Paper: microdialysis principles, application, and regulatory perspectives. J. Clin. Pharmacol. 2007, 47 (5), 589–603. 10.1177/0091270006299091. [DOI] [PubMed] [Google Scholar]
- Friston D. A.; Junttila S.; Laycock H.; Torres-Perez J. V.; Want E.; Gyenese A.; Nagy I. Submitted for publication.
- Torres-Perez J. V.; Adamek P.; Palecek J.; Vizcaychipi M.; Nagy I.; Varga A. The NAv1.7 blocker protoxin II reduces burn injury-induced spinal nociceptive processing. J. Mol. Med. (Heidelberg, Ger.) 2018, 96 (1), 75–84. 10.1007/s00109-017-1599-0. [DOI] [PMC free article] [PubMed] [Google Scholar]
- Want E. J.; Coen M.; Masson P.; Keun H. C.; Pearce J. T.; Reily M. D.; Robertson D. G.; Rohde C. M.; Holmes E.; Lindon J. C.; Plumb R. S.; Nicholson J. K. Ultra performance liquid chromatography-mass spectrometry profiling of bile acid metabolites in biofluids: application to experimental toxicology studies. Anal. Chem. 2010, 82 (12), 5282–9. 10.1021/ac1007078. [DOI] [PubMed] [Google Scholar]
- Want E. J.; Wilson I. D.; Gika H.; Theodoridis G.; Plumb R. S.; Shockcor J.; Holmes E.; Nicholson J. K. Global metabolic profiling procedures for urine using UPLC-MS. Nat. Protoc. 2010, 5 (6), 1005–18. 10.1038/nprot.2010.50. [DOI] [PubMed] [Google Scholar]
- Smith C. A.; Want E. J.; O’Maille G.; Abagyan R.; Siuzdak G. XCMS: processing mass spectrometry data for metabolite profiling using nonlinear peak alignment, matching, and identification. Anal. Chem. 2006, 78 (3), 779–87. 10.1021/ac051437y. [DOI] [PubMed] [Google Scholar]
- Tautenhahn R.; Böttcher C.; Neumann S. Highly sensitive feature detection for high resolution LC/MS. BMC Bioinf. 2008, 9 (1), 504. 10.1186/1471-2105-9-504. [DOI] [PMC free article] [PubMed] [Google Scholar]
- Veselkov K. A.; Vingara L. K.; Masson P.; Robinette S. L.; Want E.; Li J. V.; Barton R. H.; Boursier-Neyret C.; Walther B.; Ebbels T. M.; Pelczer I.; Holmes E.; Lindon J. C.; Nicholson J. K. Optimized preprocessing of ultra-performance liquid chromatography/mass spectrometry urinary metabolic profiles for improved information recovery. Anal. Chem. 2011, 83 (15), 5864–72. 10.1021/ac201065j. [DOI] [PubMed] [Google Scholar]
- Wishart D. S.; Jewison T.; Guo A. C.; Wilson M.; Knox C.; Liu Y.; Djoumbou Y.; Mandal R.; Aziat F.; Dong E.; Bouatra S.; Sinelnikov I.; Arndt D.; Xia J.; Liu P.; Yallou F.; Bjorndahl T.; Perez-Pineiro R.; Eisner R.; Allen F.; Neveu V.; Greiner R.; Scalbert A. HMDB 3.0--The Human Metabolome Database in 2013. Nucleic Acids Res. 2012, 41 (D1), D801–D807. 10.1093/nar/gks1065. [DOI] [PMC free article] [PubMed] [Google Scholar]
- Wishart D. S.; Knox C.; Guo A. C.; Eisner R.; Young N.; Gautam B.; Hau D. D.; Psychogios N.; Dong E.; Bouatra S.; Mandal R.; Sinelnikov I.; Xia J.; Jia L.; Cruz J. A.; Lim E.; Sobsey C. A.; Shrivastava S.; Huang P.; Liu P.; Fang L.; Peng J.; Fradette R.; Cheng D.; Tzur D.; Clements M.; Lewis A.; De Souza A.; Zuniga A.; Dawe M.; Xiong Y.; Clive D.; Greiner R.; Nazyrova A.; Shaykhutdinov R.; Li L.; Vogel H. J.; Forsythe I. HMDB: a knowledgebase for the human metabolome. Nucleic Acids Res. 2009, 37, D603–D610. 10.1093/nar/gkn810. [DOI] [PMC free article] [PubMed] [Google Scholar]
- Smith C. A.; O’Maille G.; Want E. J.; Qin C.; Trauger S. A.; Brandon T. R.; Custodio D. E.; Abagyan R.; Siuzdak G. METLIN: a metabolite mass spectral database. Ther. Drug Monit. 2005, 27 (6), 747–751. 10.1097/01.ftd.0000179845.53213.39. [DOI] [PubMed] [Google Scholar]
- Wohlrab J.; Kreft D. Niacinamide - mechanisms of action and its topical use in dermatology. Skin Pharmacol Physiol. 2014, 27 (6), 311–5. 10.1159/000359974. [DOI] [PubMed] [Google Scholar]
- Fivenson D. P.; Breneman D. L.; Rosen G. B.; Hersh C. S.; Cardone S.; Mutasim D. Nicotinamide and tetracycline therapy of bullous pemphigoid. Arch. Dermatol. 1994, 130 (6), 753–758. 10.1001/archderm.1994.01690060083010. [DOI] [PubMed] [Google Scholar]
- Zemtsov A.; Neldner K. H. Successful treatment of dermatitis herpetiformis with tetracycline and nicotinamide in a patient unable to tolerate dapsone. J. Am. Acad. Dermatol. 1993, 28 (3), 505–6. 10.1016/S0190-9622(08)81769-0. [DOI] [PubMed] [Google Scholar]
- Handfield-Jones S.; Jones S.; Peachey R. High dose nicotinamide in the treatment of necrobiosis lipoidica. Br. J. Dermatol. 1988, 118 (5), 693–6. 10.1111/j.1365-2133.1988.tb02572.x. [DOI] [PubMed] [Google Scholar]
- Smith Y. R.; Klitzman B.; Nixon Ellis M.; Kull F. C. Jr. The effect of nicotinamide on microvascular density and thermal injury in rats. J. Surg. Res. 1989, 47 (5), 465–469. 10.1016/0022-4804(89)90103-0. [DOI] [PubMed] [Google Scholar]
- Galimov Sh. N.; Kamilov F. Vopr. Med. Khim. 1991, 37 (3), 62–64. [PubMed] [Google Scholar]
- Lappas M.; Permezel M. The anti-inflammatory and antioxidative effects of nicotinamide, a vitamin B(3) derivative, are elicited by FoxO3 in human gestational tissues: implications for preterm birth. J. Nutr. Biochem. 2011, 22 (12), 1195–201. 10.1016/j.jnutbio.2010.10.009. [DOI] [PubMed] [Google Scholar]
- Martinon F. Mechanisms of uric acid crystal-mediated autoinflammation. Immunol. Rev. 2010, 233 (1), 218–32. 10.1111/j.0105-2896.2009.00860.x. [DOI] [PubMed] [Google Scholar]
- Feig D. I.; Kang D. H.; Johnson R. J. Uric Acid and Cardiovascular Risk. N. Engl. J. Med. 2008, 359 (17), 1811–21. 10.1056/NEJMra0800885. [DOI] [PMC free article] [PubMed] [Google Scholar]
- Zhi L.; Hu X.; Han C. Biphasic changes (overreduction and overoxidation) of plasma redox status and clinical implications in early stage of severe burns. J. Crit. Care 2014, 29 (6), 1063–8. 10.1016/j.jcrc.2014.06.013. [DOI] [PubMed] [Google Scholar]
- Liu X. R.; Zheng X. F.; Ji S. Z.; Lv Y. H.; Zheng D. Y.; Xia Z. F.; Zhang W. D. Metabolomic analysis of thermally injured and/or septic rats. Burns. 2010, 36 (7), 992–8. 10.1016/j.burns.2010.03.015. [DOI] [PubMed] [Google Scholar]
- Brusselaers N.; Monstrey S.; Colpaert K.; Decruyenaere J.; Blot S. I.; Hoste E. A. Outcome of acute kidney injury in severe burns: a systematic review and meta-analysis. Intensive Care Med. 2010, 36 (6), 915–25. 10.1007/s00134-010-1861-1. [DOI] [PubMed] [Google Scholar]
- Chertow G. M.; Burdick E.; Honour M.; Bonventre J. V.; Bates D. W. Acute kidney injury, mortality, length of stay, and costs in hospitalized patients. J. Am. Soc. Nephrol. 2005, 16 (11), 3365–70. 10.1681/ASN.2004090740. [DOI] [PubMed] [Google Scholar]
- Lapsia V.; Johnson R. J.; Dass B.; Shimada M.; Kambhampati G.; Ejaz N. I.; Arif A. A.; Ejaz A. A. Elevated uric acid increases the risk for acute kidney injury. Am. J. Med. 2012, 125 (3), 302.e9. 10.1016/j.amjmed.2011.06.021. [DOI] [PubMed] [Google Scholar]
- Ejaz A. A.; Mu W.; Kang D. H.; Roncal C.; Sautin Y. Y.; Henderson G.; Tabah-Fisch I.; Keller B.; Beaver T. M.; Nakagawa T.; Johnson R. J. Could uric acid have a role in acute renal failure?. Clin. J. Am. Soc. Nephrol. 2007, 2 (1), 16–21. 10.2215/CJN.00350106. [DOI] [PubMed] [Google Scholar]
- Sanchez-Lozada L. G.; Tapia E.; Santamaria J.; Avila-Casado C.; Soto V.; Nepomuceno T.; Rodriguez-Iturbe B.; Johnson R. J.; Herrera-Acosta J. Mild hyperuricemia induces vasoconstriction and maintains glomerular hypertension in normal and remnant kidney rats. Kidney Int. 2005, 67 (1), 237–47. 10.1111/j.1523-1755.2005.00074.x. [DOI] [PubMed] [Google Scholar]
- Liang J.; Zhang P.; Hu X.; Zhi L. Elevated serum uric acid after injury correlates with the early acute kidney in severe burns. Burns. 2015, 41 (8), 1724–31. 10.1016/j.burns.2015.09.001. [DOI] [PubMed] [Google Scholar]
Associated Data
This section collects any data citations, data availability statements, or supplementary materials included in this article.
Supplementary Materials
Data Availability Statement
Data will be deposited in Metabolights (https://www.ebi.ac.uk/metabolights/) to be made publicly available.