Summary
Cancer immunotherapy restores and/or enhances effector function of CD8+ T cells in the tumor microenvironment1,2. CD8+ T cells activated by cancer immunotherapy execute tumor clearance mainly by inducing cell death through perforin-granzyme- and Fas/Fas ligand-pathways3,4. Ferroptosis is a form of cell death that differs from apoptosis and results from iron-dependent lipid peroxide accumulation5,6. Although it was mechanistically illuminated in vitro7,8, emerging evidence has shown that ferroptosis may be implicated in a variety of pathological scenarios9,10. However, the involvement of ferroptosis in T cell immunity and cancer immunotherapy is unknown. Here, we find that immunotherapy-activated CD8+ T cells enhance ferroptosis-specific lipid peroxidation in tumor cells, and in turn, increased ferroptosis contributes to the anti-tumor efficacy of immunotherapy. Mechanistically, interferon gamma (IFNγ) released from CD8+ T cells downregulates expression of SLC3A2 and SLC7A11, two subunits of glutamate-cystine antiporter system xc-, restrains tumor cell cystine uptake, and as a consequence, promotes tumor cell lipid peroxidation and ferroptosis. In preclinical models, depletion of cyst(e)ine by cyst(e)inase in combination with checkpoint blockade synergistically enhances T cell-mediated anti-tumor immunity and induces tumor cell ferroptosis. Expression of system xc- is negatively associated with CD8+ T cell signature, IFNγ expression, and cancer patient outcome. Transcriptome analyses before and during nivolumab therapy reveal that clinical benefits correlate with reduced expression of SLC3A2 and increased IFNγ and CD8. Thus, T cell-promoted tumor ferroptosis is a novel anti-tumor mechanism. Targeting tumor ferroptosis pathway constitutes a therapeutic approach in combination with checkpoint blockade.
To study whether ferroptosis involves in the anti-tumor activity of cancer immunotherapy, ID8 ovarian tumor bearing mice were treated with the programmed death-ligand 1 (PD-L1) blockade, and the lipid peroxidation, as a functional marker for ferroptosis5,11, was assessed in single cells. PD-L1 blockade therapy resulted in enhanced lipid reactive oxygen species (ROS) in CD45- ID8 cells (Fig. 1a and Extended Data Fig. 1a), but not in CD45+ cells (Extended Data Fig. 1a), and reduced tumor growth (Fig. 1b and Extended Data Fig. 1b). Similarly, PD-L1 blockade increased lipid ROS in CD45- tumor cells (Fig. 1c) and reduced tumor weight (Fig. 1d) in B16 subcutaneous melanoma model. Adoptive transfusion of ovalbumin (OVA)-specific CD8+ T (OT-I) cells into OVA+ B16 tumor bearing mice also increased lipid ROS in CD45-OVA-H2Kb+ tumor cells (Fig. 1e and Extended Data Fig. 1c), but not in CD45+ cells (Extended Data Fig. 1d). The increased lipid peroxidation in tumor tissues from OT-I transfused mice was further confirmed by malondialdehyde (MDA) assay (Extended Data Fig. 1e). Accompanied with these findings, OT-I cells controlled tumor growth (Fig. 1f and Extended Data Fig. 1f).
Figure 1. Immunotherapy activated CD8+ T cells regulate cancer cell ferroptosis.
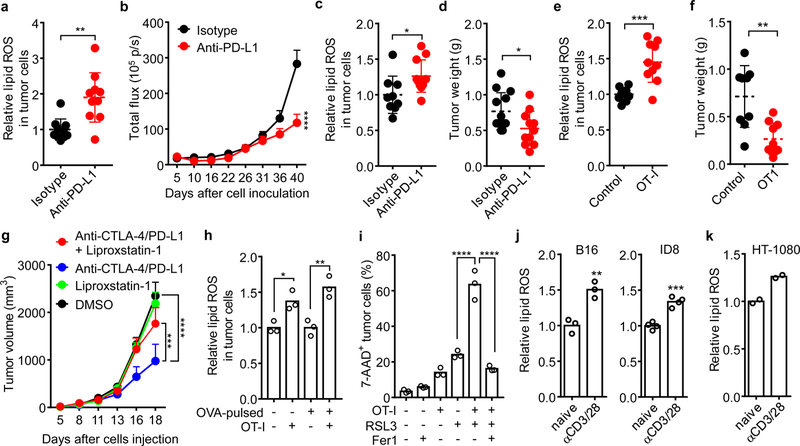
a, b, Tumor lipid ROS (a) and growth (b) in luciferase-expressing ID8 tumor-bearing mice treated with isotype (n = 10) or anti-PD-L1 antibody (n = 10). (a) Relative lipid ROS are expressed as the ratio of oxidized and reduced BODIPY MFI in gated CD45- tumor cells. ** P = 0.0014 as determined by two-tailed t-test. (b) Tumor growth was monitored by quantifying total flux (photos per second). **** P < 0.0001 on day 40 as determined by two-way ANOVA (b).
c, d, Tumor lipid ROS (c) and growth (d) in B16 tumor-bearing mice treated with isotype or anti-PD-L1 antibody. (c) Relative lipid ROS was quantified in CD45- cells (Isotype, n = 9; anti-PD-L1, n = 11; two-tailed t-test; * P = 0.0274). (d) Tumor weight was measured on day 17 (Isotype, n = 13; anti-PD-L1, n = 11; two-tailed t-test; * P = 0.0284).
e, f, Tumor lipid ROS (e) and growth (f) in OVA+ B16 tumor-bearing mice treated with OT-I transfusion. (e) Relative lipid ROS was measured in CD45-H2kb-OVA+ cells. (f) Tumor weight was measured on day 14. Control, n = 9; OT-I, n = 10; *** P = 0.0003 (e) and ** P = 0.0013 (f) are determined by two-tailed t-test.
g, Tumor growth in B16 tumor-bearing mice that were treated with DMSO (n = 10), liproxstatin-1 (n = 9), the anti-CTLA-4 and anti-PD-L1 combination therapy (n = 10) or the combination plus liproxstatin-1 (n = 9). *** P = 0.0008, **** P < 0.0001 as determined by two-way ANOVA.
h, Relative lipid ROS in B16 or OVA-pulsed B16 cells co-cultured with or without activated OT-I (B16: OT-I = 1: 1) for 30 hours. n = 3 biological replicates; * P = 0.0230 and ** P = 0.0027 were determined by one-way ANOVA.
i, Percentage of 7AAD+ B16-OVA cells in the co-cultures with OT-I cells (B16: OT-I = 1: 1) for 24 hours followed by RSL3 (0.2 μM) treatment in the presence of ferrostatin-1 (Fer1) (10 μM) for additional 20 hours. n = 3 biological replicates; **** P < 0.0001 as determined by one-way ANOVA.
j, k, Relative lipid ROS in B16, ID8 (j) or HT-1080 (k) cells treated with the supernatants from naïve or activated mouse (j) or human (k) CD8+ T cells for 30 hours. ** P = 0.0047 (m); *** P = 0.0002 (j) as determined by two-tailed t-test. n = 2, T cells are from two different donors (k).
To further explore whether the increased lipid ROS and ferroptosis contribute to the efficacy of cancer immunotherapy, we generated erastin-resistant (Erastinresis) ID8 cells, which were insensitive to rechallenge of erastin or RSL3, another ferroptosis inducer (Extended Data Fig. 2a), but remained sensitive to doxorubicin and gemcitabine, two apoptosis inducers, as compared to parental cells in vitro (Extended Data Fig. 2b). In vivo, in contrast to the parental cells, Erastinresis ID8 cells failed to respond efficiently to PD-L1 blockade (Extended Data Fig. 2c). Similarly, PD-L1 blockade failed to increase lipid ROS and decrease tumor weight in RSL3-resistant (RSL3resis) B16 cells (Extended Data Fig. 2d, e, f, g). Moreover, we tested the effect of ferroptosis inhibitor liproxstatin-1 on the efficacy of checkpoint blockade in vivo12. The combination of anti-CTLA-4 and anti-PD-L1 efficiently reduced B16 tumor growth, and this effect was attenuated by liproxstatin-1 (Fig. 1g). A recent report demonstrated a key role of long-chain-fatty-acid-CoA ligase 4 (ACSL4) in ferroptosis8. We detected reduced ACSL4 protein level in Erastinresis ID8 and RSL3resis B16 cells (Extended Data Fig. 2h). We generated ACSL4−/− ID8 cells and found that they were resistant to erastin and RSL3-induced cell death in vitro (Extended Data Fig. 2i, j). Wild type, but not ACSL4−/− ID8 tumors responded effectively to PD-L1 blockade in vivo (Extended Data Fig. 2k, l).
We questioned whether immunotherapy-activated CD8+ T cells might directly affect cancer cell ferroptosis. In the co-culture of OVA+ tumor cells with OT-I cells, we found activated OT-I cells enhanced lipid ROS in B16 cells (Fig. 1h) and augmented RSL3-induced cell death in ID8 (Extended Data Fig. 2m) or B16 cells (Fig. 1i), which were reversed by ferrostatin-1 (Fig. 1i). However, in the absence of RSL3, ferrostatin-1 failed to rescue OT-I cell-induced OVA+ B16 cell death in vitro (Extended Data Fig. 2n). The supernatants from activated mouse CD8+ T cells could increase lipid ROS in B16 and ID8 cells (Fig. 1j). Similarly, the supernatants from activated human CD8+ T cells increased lipid ROS in HT-1080 cells (Fig. 1k) and enhanced the toxicity of RSL3 to reduce cell viability, which could be abolished by ferrostatin-1 (Extended Data Fig. 2o).
IFNγ and tumor necrosis factor alpha (TNFα) are two major cytokines released by effector CD8+ T cells4,13. We found that B16 cell lipid ROS induced by CD8+ T-cell supernatant could be abolished by anti-IFNγ antibody, but not by anti-TNFα antibody (Extended Data Fig. 3a). Similarly, IFNγ receptor I (IFNGR1) deficient B16 cells failed to augment ROS expression and cell death in response to OT-I cells and CD8+ T-cell supernatant (Fig. 2a, b, Extended Data Fig. 3b). Treatment with IFNγ increased lipid ROS as assessed by C11-BODIPY in both mouse B16 and human HT-1080 cells (Extended Data Fig. 3c). We also examined the lipid ROS by using another probe LiperFluo14. Increased mean fluorescence intensity (MFI) of LiperFluo was observed in B16 and HT-1080 cells after IFNγ treatment (Extended Data Fig. 3d, e). Pretreatment with IFNγ increased erastin- or RSL3-induced lipid ROS in B16 (Fig. 2c) and HT-1080 cells (Extended Data Fig. 3f), enhanced their sensitivities toward erastin and RSL3 (Extended Data Fig. 3g, h), and increased RSL3- or erastin-induced cell death (Fig. 2d and Extended Data Fig. 3i). Interestingly, a recent study reported a role of IFNγ in promoting human melanoma cell line death induced by erastin in vitro15. In addition, we observed that RSL3- or erastin-induced cell death of IFNγ-primed B16 or HT-1080 cells was blocked by ferrostatin-1 or deferoxamine (DFO) (Extended Data Fig. 3g, h, j, k). The combination of IFNγ and RSL3 induced the highest MFI of LiperFluo and this was blocked by ferrostatin-1 (Extended Data Fig. 3e). Moreover, using liquid chromatography-mass spectrometry (LC-MS)7,8, we detected the increases of oxidized phosphatidylethanolamine (PE) (Extended Data Fig. 3l) and phosphatidylcholine (PC) (Extended Data Fig. 3m) in HT-1080 cells upon IFNγ treatment. When combined with RSL3, IFNγ further increased the content of oxidized PC in HT-1080 cells (Fig. 2e). In addition to erastin and RSL3, IFNγ increased the cell toxicities of several other ferrroptosis inducers, including ML162, ML210, buthionine sulphoximine (BSO), and sulfasalazine (SAS) in HT-1080 or B16 cells (Extended Data Fig. 3n-p). When HT-1080 cells were cultured in low concentrations of cystine, IFNγ dramatically reduced cell viability and this effect was abolished by ferrostatin-1 (Extended Data Fig. 3q). In vivo, high dose of IFNγ decreased HT-1080 tumor volume in NOD-scid IL2Rgnull (NSG) mice, and the anti-tumor effect of IFNγ was abolished by liproxstatin-1 (Fig. 2f). In line with this, low dose of IFNγ enhanced the anti-tumor efficacy of SAS in HT-1080 in vivo (Extended Data Fig. 3r). We then examined whether T cells themselves are susceptible to ferroptosis inducers with or without IFNγ. Naïve human and mouse CD4+ and CD8+ T cells were relatively insensitive to erastin or RSL3-induced cell death, regardless of IFNγ priming (Extended Data Fig. 4a, b). Erastin or RSL3 did not impair IFNγ expression in activated human and mouse CD4+ and CD8+ T cells (Extended Data Fig. 4c, d). Ferrostatin-1 had no effect on T cell survival and IFNγ expression (Extended Data Fig. 4a-d). The data suggests that tumor cells and T cells may have different sensitivities to ferroptosis inducers.
Figure 2. IFNγ sensitizes tumor cells to ferroptosis by inhibiting system xc-.
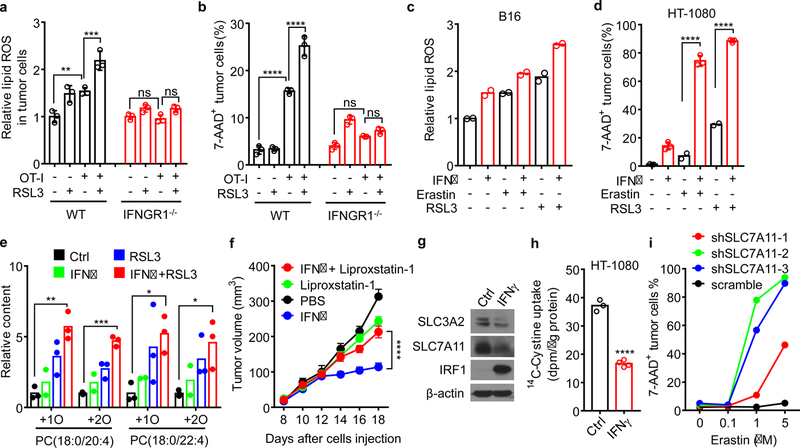
a, b, Relative lipid ROS (a) or the percentage of 7-AAD+ dead cells (b) in OVA-pulsed wild-type or IFNGR1 deficient (IFNGR1−/−) B16 cells co-cultured with OT-I cells (B16: OT-I = 1: 1) for 24 hours followed by treatment with RSL3 (0.1 μM) for additional 20 hours. n = 3 biological replicates. In a, ** P = 0.0012; *** P = 0.0001; ns, P = 0.9995 and 0.4244 were determined by one-way ANOVA. In b, **** P < 0.0001; ns, P = 0.2306 and 0.7842 were determined by one-way ANOVA.
c, Relative lipid ROS of B16 cells primed by IFNγ (10 ng/ml) for 40 hours and followed with erastin (1 μM) or RSL3 (0.1 μM) treatment for 8 hours. n = 2 biological replicates.
d, The percentage of 7-AAD+ HT-1080 cells primed by IFNγ (10 ng/ml) for 40 hours and followed with erastin (4 μM) or RSL3 (0.05 μM) for 20 hours. n = 2 or 3 biological replicates; **** P < 0.0001 as determined by one-way ANOVA.
e, Relative content of oxygenated PC species in HT-1080 cells primed by IFNγ for 40 hours and followed with RSL3 (0.01 μM) for 10 hours. n = 3 biological replicates; ** P = 0.0016; *** P = 0.0001; * P = 0.0440 and * P = 0.0325 were determined by one-way ANOVA.
f, Tumor growth in HT-1080 tumor-bearing NSG mice that were treated with PBS (n = 9), IFNγ (n = 11), liproxstatin-1 (n = 12) or IFNγ plus liproxstatin-1 (n = 11). **** P < 0.0001 as determined by two-way ANOVA.
g, Immunoblots of SLC7A11, SLC3A2, and IRF1 in HT-1080 cells treated with IFNγ (10 ng/ml) for 24 hours. β-actin serves as the loading control. Images are representative of three experiments.
h, 14C-Cystine content in IFNγ-treated HT-1080 cells incubated in 14C-Cystine supplemented medium for 45 minutes. n = 3 or 4 biological replicates; **** P < 0.0001 as determined by two-tailed t-test.
i, The percentage of 7-AAD+ dead cells in HT-1080 expressing scramble shRNA or 3 individual shRNA targeting SLC7A11 (shSLC7A11–1, 2, 3) treated with different concentrations of erastin for 24 hours. One of 3 repeats is shown.
To identify biomarkers of cell ferroptosis, we re-analyzed data from the Cancer Therapeutics Response Portal and evaluated correlations between gene expression profiles across 654 cancer cell lines and cell sensitivities to erastin and RSL316. Overall, we found 16 biomarkers of sensitivity/resistance (Extended Data Fig. 5a). Of those, 12 were highly expressed in cells resistant to ferroptosis inducers and 4 were highly expressed in cells sensitive to ferroptosis inducers. SLC7A11 and SLC3A2 demonstrated an exceptionally strong correlation with resistance to ferroptosis inducers (Extended Data Fig. 5b). We then cross-referenced these ferroptosis biomarkers against genes differentially expressed following IFNγ treatment of HT-1080 cells. Expressions of SLC7A11 and SLC3A2 mRNAs were reduced by IFNγ (Extended Data Fig. 5c). This observation was confirmed by real-time PCR (Extended Data Fig. 5d) and Western blot (Fig. 2g). SLC7A11 and SLC3A2 mediate the exchange of extracellular cystine and intracellular glutamate17. In line with this, IFNγ decreased cystine uptake (Fig. 2h) and synergized the effect of erastin to reduce glutamate release (Extended Data Fig. 5e). In addition, we found that IFNγ combined with erastin synergistically resulted in the depletion of 90% intracellular GSH (Extended Data Fig. 5f).
Knockdown SLC7A11 in HT-1080 cells increased erastin-induced cell death (Fig. 2i and Extended Data Fig. 5g). In contrast, overexpression SLC7A11 rescued erastin-induced cell death and lipid peroxidation in IFNγ-primed HT-1080 cells (Extended Data Fig. 5h, i, j). Similarly, knockdown SLC3A2 in HT-1080 cells increased sensitivity to erastin and RSL3 (Extended Data Fig. 5k, l). The supernatants from activated CD8+ T cells up-regulated interferon regulatory factor 1 (IRF1) and down-regulated SLC7A11 and SLC3A2 (Extended Data Fig. 5m). Moreover, IFNγ inhibited SLC7A11 and SLC3A2 expression in human melanoma A375 cells (Extended Data Fig. 5n), and reduced SLC7A11 mRNA and protein expression in murine B16 cells (Extended Data Fig. 5o, p). Knockdown SLC7A11 in B16 cells resulted in reduced cell viability and increased cell death in the presence of erastin and/or RSL3 (Extended Data Fig. 5q, r, s).
We then explored the molecular mechanism by which IFNγ inhibited system xc-. The precursor mRNA of SLC7A11 was rapidly decreased within 2 hours of IFNγ treatment (Extended Data Fig. 6a), suggesting a potential transcriptional regulation. Janus kinase (JAK) and signal transducer and activator of transcription (STAT) 1 mediate IFNγ-signaling activation and regulate immune response18,19. Two JAK inhibitors, JAK inhibitor I or Ruxolitinib reversed down-regulation of SLC7A11 and prevented up-regulation of IRF1 mediated by IFNγ (Extended Data Fig. 6b, c). It has been reported that STAT3 and STAT5 could bind to SLC7A11 promoter region and reduce the transcription of SLC7A1120. STAT1 chromatin immunoprecipitation (ChIP) followed by quantitative PCR (qPCR) assay demonstrated that IFNγ treatment enhanced STAT1 binding to the SLC7A11 transcription start site (TSS) in HT-1080 cells (Extended Data Fig. 6d). STAT1 deficiency abolished IFNγ-mediated down-regulation of SLC7A11 and up-regulation of IRF1 (Extended Data Fig. 6e-h), and reversed lipid peroxidation induction and erastin- or RSL3-induced cell death in IFNγ-primed HT-1080 cells (Extended Data Fig. 6i-k). In mouse B16 cells, STAT1 deficiency also reversed RSL3-induced cell death in IFNγ-primed cells (Extended Data Fig. 6l).
Cyst(e)inase, an engineered enzyme that degrades cystine as well as cysteine, efficiently induces oxidative stress and results in cell death21,22. Cyst(e)inase induced dramatic cell death in HT-1080, which was blocked by 3 ferroptosis inhibitors, ferrostatin-1, DFO or GSH (Fig. 3a). Cyst(e)inase-induced cell death was further enhanced by IFNγ priming (Fig. 3b). In mouse ID8 and B16 cells, IFNγ cooperated with cyst(e)inase to increase lipid peroxidation and induce cell death (Fig. 3c, d and Extended Data Fig. 7a, b). Cell death was reversed by ferrostatin-1 (Extended Data Fig. 7c) and knockout STAT1 (Extended Data Fig. 7d). We used bovine serum albumin (BSA) and heat-inactivated cyst(e)inase as additional controls, and confirmed specific regulation of IFNγ and cyst(e)inase on lipid peroxidation and ferroptosis in tumor cells (Extended Data Fig. 7e, f). We then tested the anti-tumor effect of PD-L1 blockade in combination with cyst(e)inase in vivo. ID8 tumor growth was comparably reduced in mice treated with either PD-L1 blockade or cyst(e)inase alone, but was strongly inhibited in mice treated with their combination (Fig. 3e and Extended Data Fig. 7g). The combination therapy dramatically increased lipid peroxidation in tumor cells in vivo (Fig. 3f) and enhanced the percentages of CD8+ and CD4+ T cells (Fig. 3g), and the percentages of IFNγ+ and TNFα+ CD8+ and CD4+ T cells in the tumor microenvironment compared to control groups (Fig. 3h, i). Furthermore, the therapeutic efficacy of the combination of cyst(e)inase and PD-L1 blockade was partially reversed by liproxstatin-1 (Extended Data Fig. 7h). These results suggest that cyst(e)ine deprivation by cyst(e)inase can synergize with checkpoint blockade to induce potent anti-tumor immunity through induction of ferroptosis.
Figure 3. Cyst(e)inase and PD-L1 blockade synergistically induce ferroptosis.
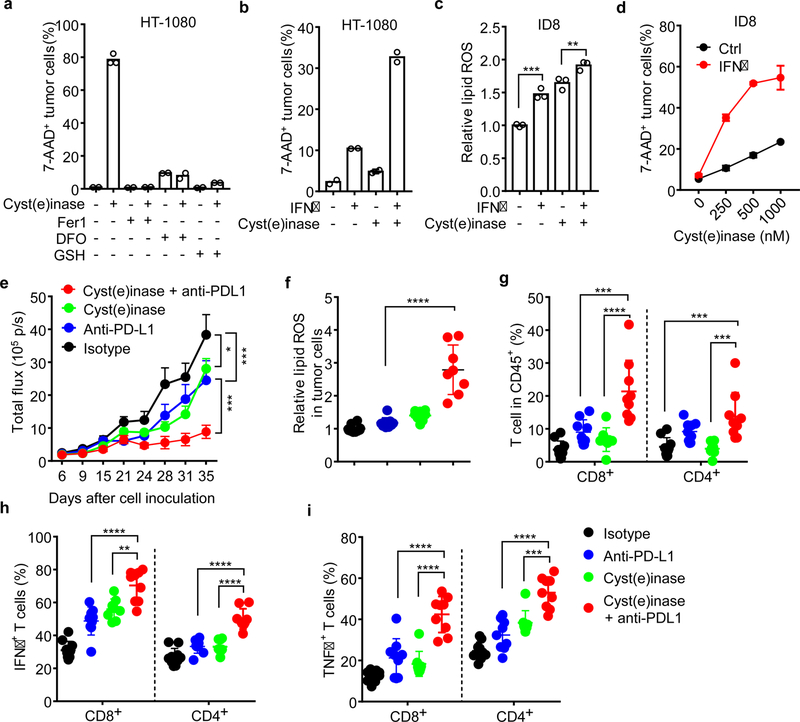
a, The percentage of 7-AAD+ HT-1080 cells treated with cyst(e)inase (1 µM) in the presence of ferroptosis inhibitors, Fer1 (10 µM), DFO (100 µM) or GSH (500 µM) for 24 hours. n = 2 or 3 biological replicates;
b, The percentage of 7-AAD+ HT-1080 cells primed by IFNγ (10 ng/ml) for 24 hours, followed with cyst(e)inase (250 nM) for 24 hours. n = 2 biological replicates.
c, Relative lipid ROS in ID8 cells primed by IFNγ for 24 hours, followed with cyst(e)inase (500 nM) for 12 hours. n = 3 biological replicates; *** P = 0.0002 and ** P = 0.0075 were determined by one-way ANOVA.
d, The percentage of 7-AAD+ ID8 cells primed by IFNγ for 24 hours, followed with different concentrations of cyst(e)inase for 24 hours. n = 2 biological replicates.
e-i, Effect of cyst(e)inase in combination with PD-L1 blockade on tumor growth and immune responses. ID8 tumor-bearing mice were treated with isotype antibody (n = 10), anti-PD-L1 antibody (n = 9), cyst(e)inase (n = 8) or the combination of cyst(e)inase and anti-PD-L1 (n = 9). Tumor growth was monitored over time by quantifying total flux (e); relative lipid ROS in CD45- ID8 cells (f); the percentages of CD8+ and CD4+ T-cells in CD45+ cells (g); and the percentage of IFNγ (h) and TNFα (i) expressing cells in CD8+ and CD4+ T cells were analyzed. * P < 0.05, ** P < 0.01, *** P < 0.001, **** P < 0.0001 as determined by two-way ANOVA (e) or one-way ANOVA (f-i).
We next quantified the number of infiltrating CD8+ cells and the expression levels of tumor SLC7A11 and SLC3A2 in human melanoma tissues (Extended Data Fig. 8a). Tumor tissues with higher CD8+ T cell infiltration had lower levels of SLC7A11 (Fig. 4a) and SLC3A2 (Fig. 4b) expression on cancer cells. Unexpectedly, in addition to tumor cells, SLC7A11 was highly expressed on CD8+ T cells (Extended Data Fig. 8a, upper panel), whereas SLC3A2 was basically expressed on tumor cells (Extended Data Fig. 8a, lower panel). Thus, we focused our subsequent tumor RNA-sequencing data analysis on SLC3A2. We examined gene-expression profiles of melanoma patients from The Cancer Genome Altas (TCGA) database. The expression level of SLC3A2 negatively correlated with CD8+ effector T cell signature and IFNγ expression (Fig. 4c, d). Kaplan-Meier survival analysis demonstrated that low SLC3A2 expression (Fig. 4e) and high expression of CD8A (Extended Data Fig. 8b) or IFNγ (Extended Data Fig. 8c) were associated with improved overall survival in patients with melanoma. Furthermore, CD8+ effector T cell signature (Fig. 4f) or IFNγ expression (Fig. 4g) was positively associated with ferroptosis response signature. In addition, we analyzed the potential change of SLC3A2 in the matched PD-1 blockade pre- and on-therapy melanoma tissues23. Patients who demonstrated clinical benefit underwent a reduction of SLC3A2, but an induction of IFNγ or CD8A, after the initiation of therapy compared to patients who did not benefit (Fig. 4h).
Figure 4. System xc- expression correlates to immune signatures and patient outcome.
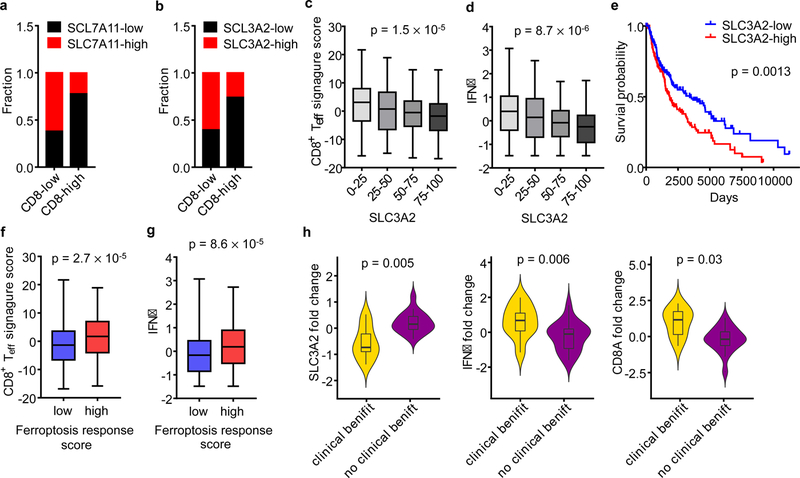
a, b, Correlation between tumor cell SLC7A11 (a), SLC3A2 (b) protein expression and the number of CD8+ T cells in human melanoma. n = 90, two-sided Fisher’s exact test; P = 0.0011 (a); P = 0.0052 (b).
c, d, Correlation between SLC3A2 mRNA quartiles and effector CD8+ T cell signature score (c) or IFNγ (d) in the melanoma TCGA dataset. n = 463, one-way ANOVA.
e, Kaplan–Meier survival curves for melanoma patients with low and high expression of SLC3A2 mRNA in melanoma TCGA dataset. P value is determined by log-rank test.
f, g, Ferroptosis response signature score is positively associated with effector CD8+ T cell-signature score (f) or IFNγ (g) in melanoma TCGA dataset. Mann-Whitney test; P = 0.002 (f); P = 0.003 (g).
h, Fold changes of SLC3A2, CD8A and IFNγ in matched pre- and on-therapy samples from melanoma patients who had clinical benefit (n= 9) or no clinical benefit (n = 18). P values are determined by Mann-Whitney test.
In conclusion, we report here that immunotherapy-activated CD8+ T cells promote tumor cell lipid peroxidation and sensitize tumors to ferroptosis through IFNγ. While we find that T cells and IFNγ sensitize but may not directly induce tumor cell ferroptosis in vitro in conventional culture system, our in vitro culture with low cystine and in vivo data show that ferroptosis is involved in T cell-mediated cancer immunity. Thus, in addition to apoptosis and senescence, tumor cell ferroptosis is a previously unappreciated mechanism for CD8+ T cell-mediated tumor clearance in vivo. Endogenous mechanism(s) triggering tumor cell ferroptosis remain to be defined in cancer patients. Our data suggests that cystine restriction may be a potential endogenous trigger for tumor cell ferroptosis in the tumor microenvironment. Tumor metabolism contributes to immune evasion via inducing T cell dysfunction and exclusion24,25. Our work highlights the contrapositive relationship that T cell induced metabolic alterations can affect tumor cell fate. Thus, targeting tumor ferroptosis-associated metabolism may improve cancer immunotherapy efficacy.
Methods
Reagents
Erastin, RSL3, ML162, ML210, ferrostatin-1, liproxstatin-1, JAK inhibitor I and ruxolitinib were purchased from Cayman Chemical. Doxorubicin (Adriamycin) HCl and gemcitabine were purchased from Selleckchem. Deferoxamine mesylate salt, L-Glutathione reduced, sulfasalazine, L-Buthionine-sulfoximine, 2-Mercaptoethanol, and SIINFEKL peptide (OVA 257–264) were purchased from Sigma-Aldrich. Recombinant human IFNγ (285-IF) and mouse IFNγ (485-MI) were purchased from R&D. BODIPY 581/591 C11, anti-IFNγ (XMG1.2) and anti-TNFα (MP6-XT22) blocking antibodies were purchased from Thermo Fisher Scientific. Liperfluo was purchased from Dojindo Molecular Technologies. Cyst(e)inase was obtained from the laboratory of Everett Stone and George Georgiou (University of Texas at Austin, TX, USA).
Cell culture
Human fibrosarcoma cell line HT-1080 (ATCC, CCL-121), melanoma cell line A375 (ATCC, CRL-1619), and mouse melanoma cell line B16-F0 (ATCC, CRL-6322) were purchased from the American Type Culture Collection (Manassas, VA). Mouse ovarian cancer cell line ID8 was originally from Dr. George Coukos. Cell lines were not authenticated, and all of them did not belong to the list of commonly misidentified cell lines (International Cell Line Authentication Committee). All cell lines were tested for mycoplasma contamination by PCR-based method and confirmed negative for mycoplasma. Cells were cultured in RMPI medium supplemented with 10% FBS, except HT-1080 cells, which were cultured in EMEM supplemented with 10% FBS. To generate OVA-expressing mouse tumor cells, B16 cells were transfected with the plasmid pCI-neo-mOVA, a gift from Maria Castro (Addgene plasmid # 25099), then selected with 1 mg/mL G418 (Thermo Fisher) for 2 weeks.
Human CD8+ T cells were isolated from peripheral blood mononuclear cells using the EasySep™ Human CD8+ T Cell Isolation Kit (Stemcell), and then stimulated with immobilized anti-CD3 (Clone HIT3α, BD Biosciences) and anti-CD28 (Clone CD28.2, BD Biosciences) for 3 days. Mouse CD8+ T cells were isolated from spleen and lymph nodes using EasySep™ Mouse CD8+ T Cell Isolation Kit (Stemcell), and then stimulated with anti-CD3 (Clone 145–2C11, BD Biosciences) and anti-CD28 (Clone 37.51, BD Biosciences) for 3 days. Supernatants were collected by centrifugation at 3,000 ×g 10min and followed 0.2 μM filter.
Generation of ferroptosis resistant tumor cells
B16-F0 or ID8 cells (2 × 10⁶) were seeded in a 10 cm cell culture dish and treated with RSL3 (1 μM) or erastin (5 μM) for 10 days. Culture medium was changed every 3 days with the fresh medium supplemented with the compound. Surviving clones were collected and further expanded. The responses of these surviving cells toward erastin and RSL3 were tested by cell viability assay. Their ferroptosis resistance capacity was confirmed.
Human specimens
Peripheral blood mononuclear cells (PBMCs) were isolated from healthy donors. All human specimens were collected with informed consent and procedures approved by the institutional review board (IRB) of the University of Michigan.
OT-I cell isolation and co-culture with OVA+ tumor cells
OT-I mice, C57BL/6-Tg (TcraTcrb) 1100Mjb/J were purchased from The Jackson Laboratory. Spleen was homogenized, and the single cells were suspended in 2 ml Red Blood Cell Lysis Buffer (Sigma-Aldrich) for 1 minute. The splenocytes were pelleted, washed, and resuspended at 2 × 10⁶ cells/ml in RPMI culture medium containing 1 µg/ml OVA257–264 peptide, 5 µg/ml of mouse recombinant IL-2, and 40 µM 2-mercaptoethanol. The cells were incubated at 37°C for 5 days.
To setup the co-culture of OT-I and OVA+ tumor cells, splenocytes were harvested after 5 days activation. OT-I cells were purified using EasySep™ mouse CD8+ T Cell Isolation Kit (Stemcell). B16-OVA was seeded overnight; OT-I cells were then added into the culture at different time points. All cells were harvested by trypsinization and analyzed by flow cytometer.
Lipid peroxidation assessed by BODIPY-C11 and Liperfluo staining
Tumor cells (20,000 cells/well) were seeded in 24-well plate. The day of the experiment, cells were treated by IFNγ (10 ng/ml) or 40% μl T-cell supernatants and followed by ferroptosis inducers. Cells were then harvested by trypsinization for staining. For the co-culture of OVA+ tumor cells and OT-I cells, the mixture was collected and resuspended in 100 μl FACS buffer. Cells were firstly stained with anti-CD45 (30-F11) and anti-OVA257–264-H2Kb (25-D1.16) antibodies for 10 minutes at room temperature. To perform BODIPY-C11 staining, cells were resuspended in 1 mL Hanks Balanced Salt Solution (HBSS, Gibco) containing 5 μM BODIPY 581/591 C11 and incubated for 15 minutes at 37°C in a tissue culture incubator. Cells were washed and resuspended in 200 μl fresh HBSS, then analyzed immediately with a flow cytometer (LSR II, BD Biosciences).
To quantify the lipid peroxidation in samples from animals that received immunotherapy, single cell suspension was firstly prepared. For ID8 tumor-bearing mice, peritoneal cavity was washed with 5 – 10 ml PBS to collect tumor and immune cells. A small fraction of cell pellet was resuspended in 1 ml Red Blood Cell Lysis Buffer (Sigma-Aldrich) for 1 minute, and washed and stained with anti-CD45 antibody following with BODIPY 581/591 C11. For B16 tumor-bearing mice, subcutaneous tumor tissue was resected and cut into small pieces, then tumor tissue was mechanically minced against a 100 μM cell strainer, and washed with PBS. The cell mixture was collected. Tumor and immune cells were pre-enriched using density gradient centrifugation (Ficoll, Sigma-Aldrich). Cell pellet was stained with anti-CD45 and anti-OVA257–264-H2Kb antibodies, followed by BODIPY 581/591 C11. Cells were strained through a 40 μM cell strainer and analyzed immediately with a flow cytometer (LSR II).
For BODIPY 581/591 C11 staining, the signals from both non-oxidized C11 (PE channel) and oxidized C11 (FITC channel) were monitored. The ratio of mean fluorescence intensities (MFI) of FITC to MFI of PE was calculated for each sample. In other cases, only the signal from oxidized C11 was monitored and MFI of FITC was calculated. The data was normalized to control samples as shown by the relative lipid ROS.
For Liperfluo staining, cells were treated with IFNγ (10 ng/ml) for 24 hours and followed by ferroptosis inducers for 6 hours. Cells were stained with Liperfluo (10 μM) for 30 minutes at 37°C, harvested by trypsinization, and analyzed immediately with a flow cytometer. In some cases, cells were pre-loaded with 10 μM Liperfluo for 1 hour at 37°C, followed with the indicated treatments. The fluorescence intensity in FITC channel was monitored.
Cell death measurement and immune profiling by FACS
For cell death analysis, cells were treated, collected, and initially stained with specific antibodies, then resuspended in PBS containing 1 μg/ml Propidium Iodide (PI) or 7-Aminoactinomycin D (7-AAD) for 5 minutes, and directly run on a flow cytometer. For cells expressing intracellular fluorescence proteins, cells were resuspended in PBS containing 1 μl LIVE/DEAD® Fixable Blue Dead Cell Stain (Thermo Fisher Scientific) for 20 minutes, then analyzed.
To quantify T cells and effector T cell cytokine expression, single-cell suspensions were prepared from fresh tumor tissues. T cells were enriched by density gradient centrifugation. For cytokine staining, T cells were incubated in culture medium containing PMA (5 ng/ml), Ionomycin (500 ng/ml), Brefeldin A (1: 1000) and Monensin (1: 1000) at 37°C for 4 hours. Anti-CD45 (30-F11), anti-CD90 (53–2.1), anti-CD4 (RM4–5), and anti-CD8 (53–6.7) were added for 20 minutes for surface staining. The cells were then washed and resuspended in 1 ml of freshly prepared Fix/Perm solution (BD Biosciences) at 4°C for overnight. After being washed with Perm/Wash buffer (BD Biosciences), the cells were stained with anti-TNFα (MP6-XT22) and anti-IFNγ (XMG1.2) for 30 minutes, washed, and fixed in 4% formaldehyde (Sigma Aldrich). All samples were read on an LSR II cytometer and analyzed with FACS DIVA software v. 8.0 (BD Biosciences).
Cell proliferation and viability assay
Tumor cells were harvested and seeded into 96-well plate. After adhesion, cells were pre-treated with IFNγ (1– 10 ng/mL) for 24 hours and followed with the treatment of different ferroptosis inducers or inhibitors. To determine the effect of treatment on cell growth and viability, 10% volume of alamar Blue (Bio-Rad) was directly added into medium and incubated for 4 – 6 hours. Absorbance at wavelengths of 570 nm and 600 nm was measured. The percent difference in reduction between treated and control cells was calculated using the following equation: Percent difference between treatment and control (%)
After calculation, the viability of control cells was 100% and all others were normalized to control and shown as relative cell viability (%).
Quantitative PCR analysis
Total RNA was isolated from cells by column purification (Direct-zol RNA Miniprep Kit, Zymo Research) with DNase treatment. cDNA was synthesized using High-Capacity cDNA Reverse Transcription Kit (Thermo Fisher Scientific) with poly-dT or random hexamer primers. Quantitative PCR (qPCR) was performed on cDNA using Fast SYBR® Green Master Mix (Thermo Fisher Scientific) on a StepOnePlus™ Real-Time PCR System (Thermo Fisher Scientific). Gene expression was quantified using the following primers: human GAPDH forward: TGGTATCGTGGAAGGACTC, human GAPDH reverse: AGTAGAGGCAGGGATGATG; human SLC7A11 forward: TGCTGGGCTGATTTTATCTTCG, human SLC7A11 reverse: GAAAGGGCAACCATGAAGAGG; human SLC3A2 forward: CTGGTGCCGTGGTCATAATC, human SLC3A2 reverse GCTCAGGTAATCGAGACGCC; human IRF1 forward: GAGACCCTGGCTAGAGATGC, human IRF1 reverse: CATGGCACAGCGAAAGTTGG; human pre-SLC7A11 forward: TTGCCATCCATTCACTCCTCA, human pre-SLC7A11 reverse:
GCATGTCTCTGACCATCTGGA; human pre-GAPDH forward: TGACATCAAGAAGGTGGTGA, human pre-GAPDH reverse: CCTGCACTTTTTAAGAGCCA; mouse ACTB forward: AGATCAAGATCATTGCTCCTCCT, mouse ACTB reverse: ACGCAGCTCAGTAACAGTCC; mouse GAPDH forward: AGGAGAGTGTTTCCTCGTCC, mouse GAPDH reverse: TGCCGTGAGTGGAGTCATAC; mouse SLC7A11 forward: GCTCGTAATACGCCCTGGAG, mouse SLC7A11 reverse: GGAAAATCTGGATCCGGGCA;
Fold changes in mRNA expression were calculated by the ΔΔCt method using GAPDH or ACTB as an endogenous control. Results are expressed as fold changes by normalizing to the controls.
Immunoblotting
Cells were washed in cold PBS and lysed in 1× RIPA lysis buffer (Millipore) with 1× protease inhibitor cocktail (Roche). Lysates were incubated on ice for 10 min and cleared by centrifugation at 15,000g for 15 min. Protein concentration was quantified using a BCA protein assay kit (Thermo Fisher). 30 μg total protein was mixed with sample buffer (Thermo Fisher) and denatured at 95 °C for 10 min. Sample was separated by SDS-PAGE and transferred to a PVDF membrane (Millipore). Membranes were blocked with 5% w/v nonfat dry milk and incubated with primary antibodies overnight at 4°C and HRP-conjugated secondary antibodies (CST) for 2 hours at room temperature. Signal was detected using Clarity™ and Clarity Max™ Western ECL Blotting Substrates (Bio-Rad) and captured using ChemiDoc™ Imaging System (Bio-Rad). Antibodies were as follows: anti-human SLC7A11 (CST, 12691, 1:1000), anti-human SLC3A2 (CST, 13180, 1:2000), anti-mouse SLC7A11 (Thermo Fisher, 711589, 1:1000), anti-mouse ACSL4 (abcam, ab155282, 1:2000), anti-IRF1 (CST, 8478, 1:2000), anti-STAT1 (CST, 9175, 1:1000), anti-GAPDH (CST, 5174, 1:5000), and anti-β-actin (CST, 5125, 1:5000).
Radiolabeled Cystine uptake assay
HT-1080 cells (20,000 cells/well) were seeded overnight and treated by IFNγ (10 ng/mL) for 24 hours. Medium was removed and changed to cystine-free medium. L-14C-Cystine (0.2 μCi/mL) was added and incubated for 15– 45 minutes. Cells were washed three times with cold PBS containing 100 μM cystine and lysed in 200 μl NaOH (100 mM). Lysates were added into 5 ml scintillation fluid and radioactivity was measured by a Beckman liquid scintillation counter. In the meantime, the same number of cells was lysed in 100 μl NaOH (100 mM). The quantity of total protein was determined by the BCA Protein Assay kit and used to normalize the radioactivity. Experiments were performed with biological replicates.
Glutathione quantification
HT-1080 cells (2,000 cells/well) were seeded in a white 96-well plate with clear bottom. The next day, cells were treated with IFNγ for 24 hours and followed with erastin treatment for 6 hours. GSH level was measured by a GSH-Glo Glutathione Assay (Promega) kit following the manufacturers’ instruction. Briefly, after treatment the culture medium was carefully removed, 100µl of 1X GSH-Glo™ Reagent was directly added to each well and followed with 30-minute incubation. Then, 100 μl of reconstituted Luciferin Detection Reagent was added and mixed. After 15 minutes, luminescence was measured using a LMax Microplate Reader (Molecular Devices). A standard curve for GSH concentration was generated along with samples and used for calculation. In the meantime, cell viability in another set of wells was measured using a CellTiter-GLO Luminescent Cell Viability Assay (Promega) kit. Briefly, a volume of CellTiter-Glo Reagent equal to the volume of cell culture medium present in each well was added and mixed to induce cell lysis. The plate was incubated for 10 minutes at room temperature. Luminescence was measured using a LMax Microplate Reader. Relative cell viability was calculated in comparison with control group (100% cell viability). GSH concentration in each group was normalized by the cell viability.
Glutamate assay
The Glutamate Colorimetric Assay Kit (BioVision) was used for detection of extracellular glutamate released into the medium. HT-1080 (20,000 cells/well) were seeded overnight and treated with IFNγ (10 ng/mL) for 24 hours. Cells were incubated in serum free DMEM medium containing 5 μM Erastin for 1 hour. 50 μl medium was taken for extracellular glutamate measurement.
Malondialdehyde (MDA) assay
MDA content in tumor tissue was measured by Thiobarbituric Acid Reactive Substances (TBARS) assay kit (Cayman Chemical, Item Number 10009055) to monitor the lipid peroxidation. About 25 mg B16 tumor tissue was homogenized in 250 μl RIPA buffer containing protease inhibitors. Tissue homogenates were centrifuged at 1,600 × g for 10 minutes at 4 °C and 100 μl supernatant was used for MDA analysis. In the meantime, protein concentration of supernatant was determined by the BCA Protein Assay kit after further dilution, and used to normalize the MDA content.
Analysis of oxidized phospholipids
HT-1080 cells were treated, collected by trypsinization, and washed with PBS. Cell pellet (107 cells) was re-suspended into 500 µL 25 mM HEPES (pH 7.4) containing 200 μM DTPA and lysed by sonication on ice. Then, 500 µL of methanol (HPLC grade) were added. Samples were immediately frozen and kept at −80oC. Upon thawing, 1 ng of PE (12:0/12:0) and 1 ng of PC (18:0/20:4-d7) internal standards were added to each sample. Samples were extracted according to the method of Bligh and Dyer26. The organic phase was dried under vacuum and resuspended in 100 μL of a mixture of 75 % HPLC solvent A (hexanes/isopropanol 30:40, v/v) and 25 % solvent B (5 mM ammonium acetate in hexanes/isopropanol/water 30:40:7, v/v/v). Samples (20µL) were then injected into an HPLC system (ExionLC, Sciex, Framingham, MA) connected to a triple quadrupole mass spectrometer (Triple Quad 6500+, Sciex). Normal phase chromatography was performed using a HILIC HPLC column (Kinetex HILIC 2.6 µm, 100 Å, 100 × 2.1 mm, Phenomenex, Torrance, CA) at a flow rate of 200 μL/min. Solvent B was maintained at 25 % for 1 minoute, increased gradually to 60 % in 3 minutes, and then to 95 % in 2 minutes, and was held for 5 minutes before re-equilibration for 4 minutes. Mass spectrometric analysis was performed in the negative ion mode using multiple-reaction monitoring (MRM) of specific precursor/product ion m/z transitions upon collision-induced dissociation. The precursor negative ions monitored were the molecular ions [M-H]- for PE, and the acetate adducts [M+CH3COO]- for PC. Identity was further verified by monitoring at the same time, using polarity switching, the positive molecular ions [M+H]+ for both PC and PE molecular species. The product ions analyzed after collision-induced decomposition, and used for data comparison, were the carboxylate anions corresponding to the nonoxidized or oxidized arachidonoyl chains. The specific precursor/product pairs monitored in negative-ion mode and used for quantitation were: PE (18:0/20:4), 766/303; PE (18:0/22:4), 794/331; PE (18:0/20:4-OH), 782/319; PE (18:0/22:4-OH), 810/347; PE (18:0/20:4-OOH), 798/335; PE (18:0/22:4-OOH), 826/363; PC (18:0/20:4), 868/303; PC (18:0/22:4), 896/331; PC (18:0/20:4-OH), 884/319; PC (18:0/22:4-OH), 912/347; PC (18:0/20:4-OOH), 900/335; PC (18:0/22:4-OOH), 928/363; PE(12:0/12:0) internal standard, 578/199 and PC(18:0/20:4-d7) internal standard, 875/310. Results are reported as the ratio between the integrated area of each analyte and the integrated area of the corresponding internal standard. The chromatograms of the ion intensities were plotted (ion count versus time) and the areas under the peaks integrated. Data are normalized to protein concentration for each sample.
Generation of knockout cells
STAT1, IFNGR1 and ACSL4 knockout cells were generated with CRISPR Technology. Human STAT1 locus or mouse ACSL4 locus were targeted by STAT1 Double Nickase Plasmid (h) (Santa Cruz Biotechnology, sc-400086-NIC) or ACSL4 Double Nickase Plasmid (m) (Santa Cruz Biotechnology, sc-424503-NIC) respectively. Tumor cells were transfected with the plasmid using Lipofectamine 2000 (Thermo Fisher Scientific). 24 hours after transfection, cells were selected with 10 µg/ml puromycin (Santa Cruz Biotechnology) for another 72 hours. Single cell clones were selected and expanded in 96-well plate. For mouse STAT1 and IFNGR1, guide RNAs were cloned into the plasmid pSpCas9 (BB)-Puro (Addgene, 62988). B16 cells were transfected with the plasmid using Lipofectamine 2000 and selected with puromycin. Single cell clones were selected and expanded. Guide RNA sequences to target mouse STAT1 were: GGTCGCAAACGAGACATCAT or CCAGTACAGCCGCTTTTCTC; Guide RNAs to targeting mouse IFNGR1 were: ATTAGAACATTCGTCGGTAC or CTTGAACCCTGTCGTATGCT. Knockout clones were identified by immunoblotting. Multiple deficient clones were pooled for the experiments.
RNA-sequencing analysis
Total RNA was isolated from cells by column purification (Direct-zol RNA Miniprep Kit, Zymo Research) with DNase treatment. The Ribo-Zero Gold rRNA Removal Kit (Illumina) and TruSeq® Stranded Total RNA Library Prep Globin kit (Illumina) were used to prepare the library for RNA-sequencing. Sequencing was performed by the University of Michigan DNA Sequencing Core, using the Illumina Hi-Seq 4000 platform, paired end, 50 cycles. Data was analyzed by the University of Michigan Bioinformatics Core. The quality of the raw reads data for each sample was first evaluated using FastQC (version 0.11.3). The Tuxedo Suite software package was used for alignment, differential expression analysis, and post-analysis diagnostics. Briefly, reads were aligned to the reference transcriptome (hg19) using TopHat (version 2.0.13) and a second round of quality control was performed after alignment. Cufflinks/CuffDiff (version 2.2.1) was used for expression quantitation, normalization, and differential expression analysis. Locally developed scripts were used to format and annotate the differential expression data output from CuffDiff. Diagnostic plots were generated using the CummeRbund R package.
Animal experiments
Six- to eight-week-old female NSG or C57BL/6 mice were obtained from the Jackson Laboratory. All mice were maintained under pathogen-free conditions. For HT-1080 tumor model, 106 tumor cells were subcutaneously injected on the right flank of NSG mice. In liproxstatin-1 rescue experiment, liproxstatin-1 (30 mg/kg) or recombinant human IFNγ (7.5 × 10⁵ U/mouse) was administered intraperitoneally every day or every three days. In sulfasalazine and IFNγ combination experiment, sulfasalazine (120 mg/kg) or IFNγ (1.5 × 10⁵ U/mouse) was administered intraperitoneally every day or every three days. Tumor diameters were measured using calipers and tumor volume was calculated.
For adoptive transfer of OT-I to B16-OVA model, 105 B16-OVA cells were subcutaneously injected on the right flank of C57BL/6 mice. Meantime, splenocytes were isolated from OT-I mice, activated by OVA257–264 peptide and expanded in vitro for 5 days. 5 × 10⁶ enriched OT-I cells were resuspended into 500 µl PBS and intravenously injected into tumor-bearing mice. PBS was given to control group. Tumor diameters and weight were respectively measured using calipers and a balance (Denver Instrument, SI-114) at the end of experiment.
For the B16 tumor model, 105 B16F0 cells were subcutaneously injected on the right flank of C57BL/6 mice. On day 3, 100 µg anti-CTLA-4 (Bio X Cell) plus 100 µg anti-PD-L1 (Bio X Cell), 20 mg/kg liproxstatin-1 or both of them were administered intraperitoneally in each mouse. Antibodies were administered every 3 days and liproxstatin-1 was administered every day. Tumor diameters were measured using calipers.
For the ID8 tumor model, 2 × 10⁶ luciferase-expressing ID8 cells were injected into the peritoneal cavity of each female mouse. On day 7, 100 µg isotype control antibody, 100 µg anti-PD-L1 (Bio X Cell), or 1.5 mg PEG-Cyst(e)inase was administered intraperitoneally in each mouse, then every 3 days for the duration of the experiment. To monitor tumor progression, 10 minutes after 150 mg/kg body mass D-luciferin (Promega) intraperitoneal injection, the bioluminescence signal was assessed with the IVIS Spectrum In Vivo Imaging System (PerkinElmer). Tumor load was calculated based on the total flux (photons per second [p/s]). Animal studies were conducted under the approval of the University of Michigan Committee on Use and Care of Animals. In none of the experiments xenograft tumor size surpassed 2 cm in any two dimensions or animal had severe abdominal distension (≥10% original body weight increase). Sample size was chosen based on preliminary data. After tumor inoculation mice were randomized and assigned to different groups for treatment.
Immunohistochemistry (IHC) and digital pathology analysis
Paraffin embedded human melanoma tissue microarray was purchased from US Biomax. The slides were baked for 60 minutes at 60°C, deparaffinized in xylene, and rehydrated through graded concentrations of ethanol in water. The slides were then subjected to antigen retrieval in 1X AR6 or AR9 buffer (PerkinElmer) using microwave treatment. Immunohistochemistry (IHC) staining was performed using EnVision G|2 Doublestain System (Agilent) with the following modifications. Anti-human CD8 (1: 50 dilution; Agilent DAKO; clone C8/144b) was firstly applied on the slides, detected using Polymer/HRP and visualized with HIGHDEF blue IHC chromogen (HRP) (Enzo Life Sciences). Anti-human SLC7A11 (1: 100 dilution; Cell Signaling Technology; clone D2M7A; Cat # 12691S) or SLC3A2 (1: 100 dilution; Cell Signaling Technology; clone D3F9D; Cat # 47213S) were subsequently applied, detected using Rabbit/Mouse (LINK) following Polymer/AP, and visualized with HIGHDEF red IHC chromogen (AP, plus) (Enzo Life Sciences). Sections were left to air-dry and mounted with permanent mounting medium and coverslipped.
Bright field images were acquired by an automated slide-scanning platform (Aperio AT2, Leica Biosytems) at a 400× magnification. The images were analyzed with ImageScope software (Leica Biosystems). The tissue cores were scored manually on a computer screen with high resolution. Any discrepancies were resolved by subsequent consultation with diagnostic pathologists. The number of CD8+ cells in each core (0.79 mm2) was counted. Tumor tissues were divided into “CD8-low” and “CD8-high” based on the mean values of CD8+ cell number. SLC7A11 and SLC3A2 were localized on the cell membrane, and were scored using the H-score method. The H score method takes the percentage of positive cells (0 – 100%) and each staining intensity (0 – 3+) into account. A final score was calculated on a continuous scale between 0 and 300 using the following formula:
H-score = [1× (% cells 1+) + 2× (% cells 2+) + 3× (% cells 3+)]
Tumor tissues were divided into low and high SCL7A11 or SLC3A2 expression based on the median values of H-score of each core. Cores from normal skin tissue of scalp, abdomen, and breast were used as controls.
Signature score computation
We used a previously published gene set to determine effector CD8+ T cell signature27. For ferroptosis response signature, we used a gene set that was up-regulated by erastin treatment and reversed by co-treatment with β-mercaptoethanol in HT-1080 cells28. Signature scores were computed by inverse-normal transformation of gene expression levels across the cohort followed by summation of inverse-normal values for each sample29.
Statistical analysis
No statistical methods were used to predetermine sample size. For cell-based experiments, biological triplicates were performed in each single experiment in general, unless otherwise stated. For animal experiments in Fig. 1a-i, S1a-f, S1j-k, 5e-i and S5g-h were performed in C57BL/6 mice. Animals were randomized into different groups after tumor cells inoculation and at least 10 mice were used for each group, unless otherwise indicated. Animals that failed to develop tumor from the beginning was excluded from the analysis. For animal experiments in Fig. 2k-l were performed in NSG mice. Animals were randomized into different groups after tumor cells inoculation and at least 5 mice were included in each group. Data is shown as individual values. Statistical analysis was performed using GraphPad Prism6 software (GraphPad Software, Inc.). Two tailed t-test or Mann-Whitney test were used to compare treatments vs. control groups; ANOVA models were used to compare continuous outcomes across multiple experimental groups, and Tukey and Bonferroni correction was used to adjust p values for multiple comparisons, unless otherwise indicated in each figure legend. Inverse-normal signature scores were computed for each sample as previously described. Survival functions were estimated by Kaplan-Meier methods and log-rank test was used to calculate the statistical differences. Pearson correlation was used to evaluate the association between two genes expression. P < 0.05 was considered significant.
Extended Data
Extended Data Fig. 1. Immunotherapy increases lipid peroxidation in cancer cells.
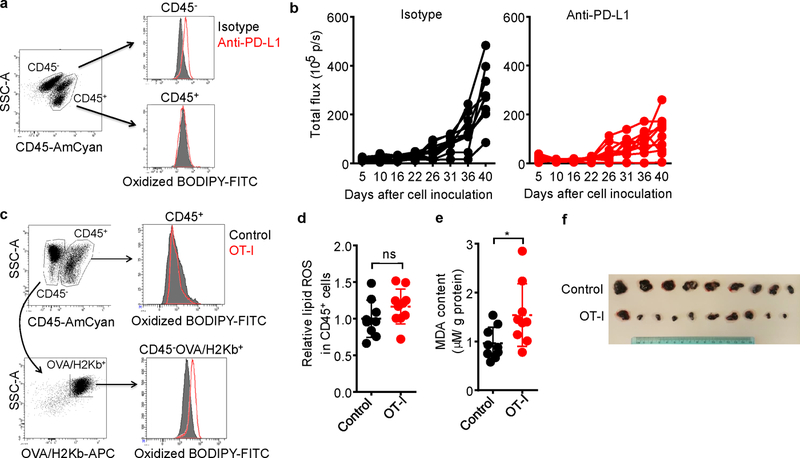
a, Flow cytometry analysis of BODIPY fluorescence in CD45- tumor cells isolated from mouse peritoneal cavity.
b, ID8 tumor growth in individual mice was monitored by quantifying total flux (photos per second). Animals were treated with either anti-PD-L1 or isotype mAb (see Fig. 1b).
c, Flow cytometry analysis of oxidized BODIPY fluorescence in CD45- H2kb/OVA+ tumor cells and OT-I cells isolated from subcutaneous B16 tumor tissue.
d, Relative lipid ROS in CD45+ cells isolated from subcutaneous B16 tumor tissue. Control, n = 9; OT-I, n = 10; ns, P = 0.1584 was determined by two-tailed t-test.
e, Effect of OT-I cells on MDA concentration in B16 cells in vivo. MDA content in tumor tissue lysate was measured by TBRAS assay and normalized to protein concentration. Control, n = 9; OT-I, n = 9; * P = 0.0285 is determined by two-tailed t-test.
f, Subcutaneous B16 tumors from control and OT-I groups were surgically removed and presented. The minimum scale of the rule is millimeters.
Extended Data Fig. 2. Ferroptosis in cancer cells is regulated by immunotherapy and contributes to anti-tumor effect of immunotherapy.
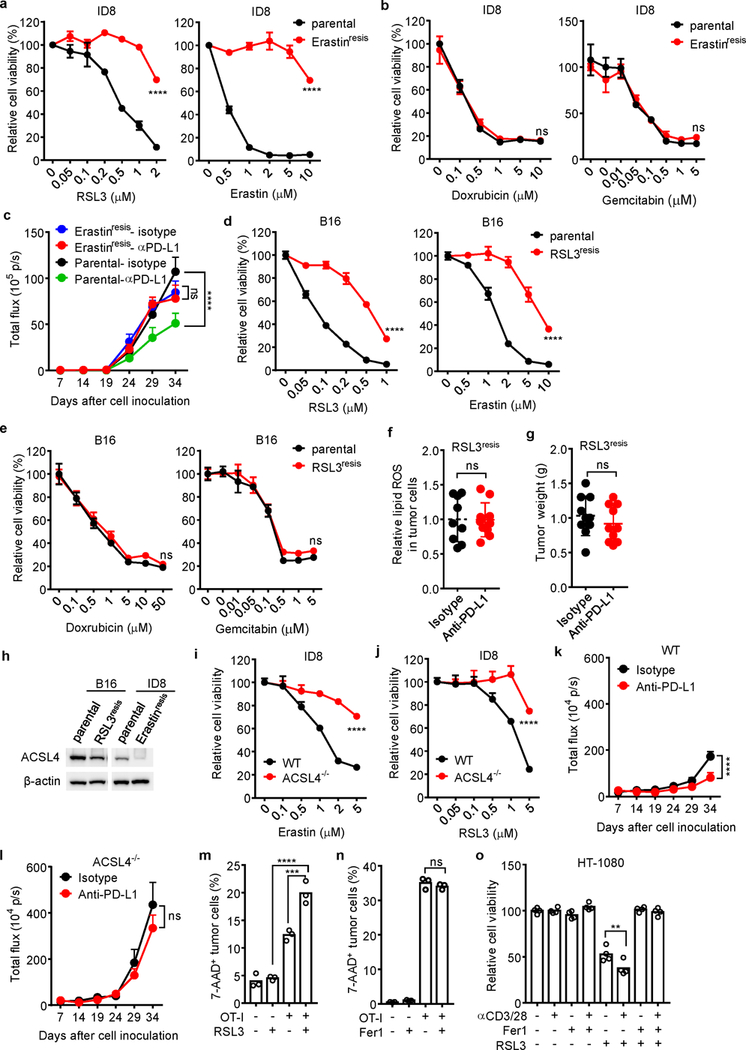
a, b, Relative viability of parental ID8 or erastin-resistant ID8 cells treated with different concentrations of ferroptosis inducers RSL3 or erastin, or apoptosis inducers doxrubicin and gemcitabin for 24 hours. n = 3 or 4 biological replicates (mean ± s.d.). **** P < 0.0001 as determined by two-way ANOVA.
c, Anti-tumor effect of PD-L1 blockade in parental or erastin-resistant ID8 tumor bearing mice. Mice with luciferase-expressing ID8 tumor cells were treated with either anti-PD-L1 or isotype mAb. Tumor growth was monitored by quantifying total flux (photos per second). Parental-isotype, n = 8; Parental-anti-PDL1, n = 8; Erastinresis-isotype, n = 9; Erastinresis-anti-PDL1, n = 9; **** P < 0.0001; ns, P = 0.9018; two-way ANOVA.
d, e, Relative viability of parental B16 or RSL3-resistant B16 cells treated with different concentrations of ferroptosis inducers RSL3 or erastin, or apoptosis inducers doxrubicin and gemcitabin for 24 hours. n = 3 or 4 biological replicates (mean ± s.d.). **** P < 0.0001 as determined by two-way ANOVA.
f, g, Effect of anti-PD-L1 therapy on tumor lipid ROS (f) and tumor growth (g) in RSL3-resistant (RSL3resis) B16 tumor bearing mice. Mice with subcutaneous tumor were treated with either anti-PD-L1 or isotype mAb. (f) Relative lipid ROS in tumor cells was measured by FACS in gated CD45- cells (Isotype, n = 9; anti-PD-L1, n = 10; two-tailed t-test; ns, P = 0.9608). (g) Tumor weight was measured on day 17 (Isotype, n = 10; anti-PD-L1, n = 10; two-tailed t-test; ns, P = 0.3621).
h, Immunoblot of ACSL4 in RSL3-resistant (RSL3resis) B16 and erastin-resistant (Erastinresis) ID8 cells compared with their parental cells.
i, j, Relative cell viability of wild-type or ACSL4 deficient (ACSL4−/−) ID8 cells treated with different concentrations of erastin (i) or RSL3 (j) for 24 hours. n = 3 or 4 biological replicates (mean ± s.d.). **** P < 0.0001 as determined by two-way ANOVA.
k, l, Anti-tumor effect of PD-L1 blockade in WT (k) or ACSL4−/− (l) ID8 tumor bearing mice. Luciferase-expressing ID8 tumor bearing mice were treated with either anti-PD-L1 or isotype mAb. Tumor growth was monitored by quantifying total flux (photos per second). WT, isotype, n =10; WT, anti-PD-L1, n = 10; ACSL4−/−, isotype, n = 9; ACSL4−/−, anti-PD-L1, n = 9; two-way ANOVA, **** P < 0.0001 (k); ns, P = 0.317 (l).
m, The percentage of 7AAD+ ID8-OVA cells in the mixed co-cultures with OT-I cells (ID8: OT-I = 1: 1) for 24 hours followed by treatment with RSL3 (0.1 μM) for 20 hours. n = 3 biological replicates. *** P = 0.0004 and **** P < 0.0001 were determined by one-way ANOVA.
n, The percentage of 7-AAD+ B16-OVA cells in the mixed co-cultures with OT-I cells (B16: OT-I = 1: 2) in the presence of Fer1 (10 μM) for 40 hours. n = 3 biological replicates. ns, P = 0.4640 was determined by one-way ANOVA.
o, Relative viability of HT-1080 cells primed by the supernatants from anti-CD3 and anti-CD28 activated human CD8+ T cells for 24 hours, followed with RSL3 (0.05 μM) in the presence of Fer1 (10 μM) for another 16 hours. n = 4 biological replicates. ** P = 0.0015 as determined by one-way ANOVA.
Extended Data Fig. 3. IFNγ sensitizes tumor cells to ferroptosis.
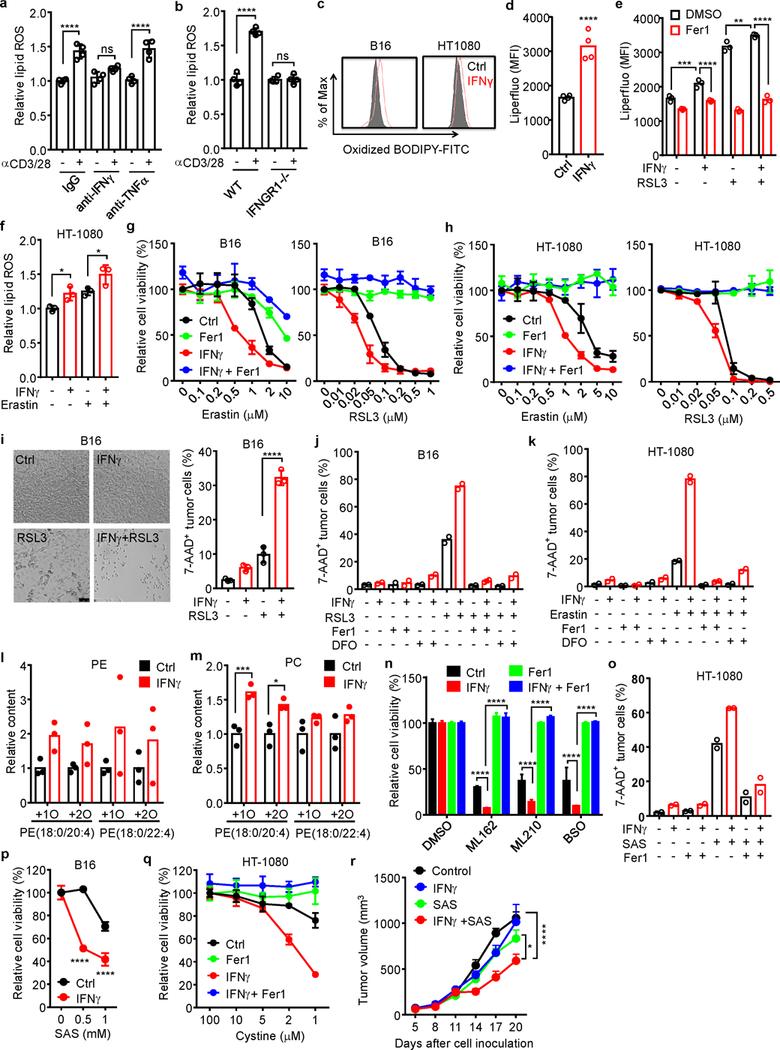
a, Relative lipid ROS in B16 cells treated with the supernatants from activated CD8+ T cells in the presence of anti-IFNγ or anti-TNFα blocking antibody for 40 hours. n = 4 biological replicates. ns, P = 0.1003; **** P < 0.0001 as determined by one-way ANOVA.
b, Relative lipid ROS in wild-type or IFNGR1 deficient (IFNGR1−/−) B16 cells treated with the supernatant from activated CD8+ T cells for 40 hours. n = 4 biological replicates. ns, P = 0.9981; **** P < 0.0001 was determined by one-way ANOVA.
c. Lipid ROS in B16 or HT-1080 cells treated with IFNγ for 24 hours. The representative histogram plot for fluorescent of oxidized C11-BODIPY is shown.
d, Mean fluorescence intensity (MFI) of LiperFluo in B16 cells treated with IFNγ for 24 hours. n = 4 biological replicates. **** P < 0.0001 as determined by two-tailed t-test.
e, MFI of LiperFluo in HT-1080 cells primed with IFNγ for 24 hours, followed with RSL3 (0.05 μM) for 6 hours in the presence of Fer1 (10 μM). n = 4 biological replicates. ** P = 0.0067; *** P = 0.0003 and **** P < 0.0001 were determined by two-way ANOVA.
f, Relative lipid ROS of HT-1080 cells primed by IFNγ (10 ng/ml) for 40 hours and followed with erastin (2 μM) treatment for 8 hours. n = 3 biological replicates. * P = 0.0426 or 0.0250 was determined by one-way ANOVA.
g-h, Relative viability of B16 (g) or HT-1080 (h) cells primed with or without (Ctrl) IFNγ for 40 hours in the presence of Fer1 (10 μM), followed by treatment with different concentrations of erastin or RSL3 for 24 hours. n = 3 or 4 biological replicates (mean ± s.d.).
i, The percentage of 7-AAD+ B16 cells primed by IFNγ (10 ng/ml) for 40 hours and followed with RSL3 (0.1 μM) treatment for 20 hours. Representative images were shown (left panel). Cell death was quantified by FACS after PI staining (right panel). n = 3 biological replicates. **** P < 0.0001 as determined by one-way ANOVA.
j, k, The percentage of 7-AAD+ B16 (j) or HT-1080 (k) cells primed by IFNγ and followed with RSL3 (0.1 μM in j) or erastin (4 μM in k) in the presence of Fer1(10 μM) or deferoxamine (DFO, 100 μM). n = 2 biological replicates.
l, m, Relative content of oxygenated phosphatidylethanolamine (PE) (l) and phosphatidylcholine (m) species in HT-1080 cells primed by IFNγ (10 ng/ml) for 48 hours. n = 3 biological replicates. *** P = 0.0008 and * P = 0.0167 were determined by two-tailed t-test.
n, Relative viability of HT-1080 cells primed by IFNγ for 24 hours, followed by ML162 (0.1 μM), ML210 (0.1 μM), or BSO (5 μM) for 24 hours in the presence of Fer1 (10 μM). n = 3 (mean ± s.d.), **** P < 0.0001 as determined by two-way ANOVA.
o, The percentage of 7AAD+ HT-1080 cells primed by IFNγ, followed with SAS (0.5 mM) for 40 hours in the presence of Fer1 (10 μM). n = 2 biological replicates.
p, Relative viability of B16 cells primed by IFNγ for 24 hours, followed with different concentrations of sulfasalazine (SAS) for additional 24 hours. n = 3 (mean ± s.d.).**** P < 0.0001 as determined by two-way ANOVA.
q, Relative viability of HT-1080 cells primed with or without IFNγ, then cultured with medium supplemented with decreased concentrations of cystine in the presence of Fer1 (10 μM) for 20 hours. n = 3 or 4 biological replicates (mean ± s.d.).
r, Effect of IFNγ and SAS on HT-1080 tumor growth in vivo. HT-1080 cells (2 × 10⁶ cells) were subcutaneously inoculated into NSG mice. Mice were treated either with IFNγ (1.5 × 10⁵ U/ mice), SAS (120 mg/kg) or the combination. n = 5 animals in each group. * P < 0.05 and **** P < 0.0001 were determined by two-way ANOVA.
Extended Data Fig. 4. Tumor cells and T cells are differentially responsive to ferroptosis inducers.
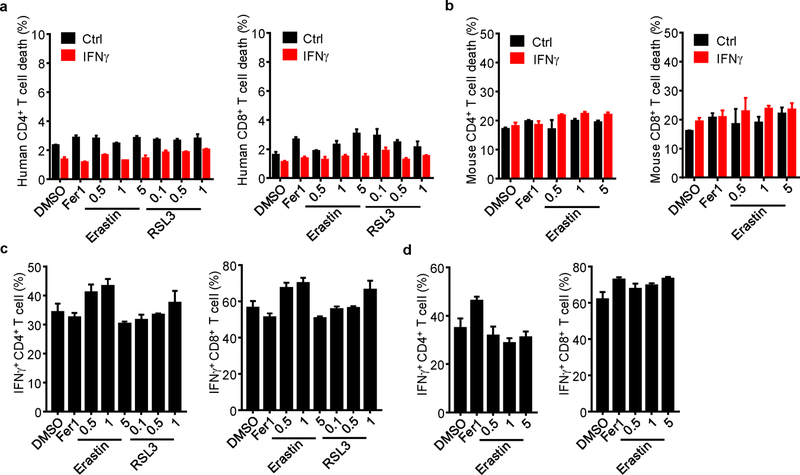
a, b, The percentage of 7-AAD+ cells in human naïve (a) and mouse (b) CD4+ and CD8+ T cells primed by IFNγ for 24 hours, followed by treatment with Fer1, and different concentrations of erastin or RSL3 for 24 hours. n = 3 biological replicates (mean ± s.d.).
c, d, The percentage of IFNγ+ cells in human (c) and mouse (d) CD4+ and CD8+ T cells. T cells were activated with anti-CD3 and anti-CD28 antibodies for 1 day, followed by treatment with Fer1 and different concentrations of erastin and RSL3 for 2 days. IFNγ expression was determined by FACS. n = 3 biological replicates (mean ± s.d.).
Extended Data Fig. 5. IFNγ targets system xc- to regulate tumor cell ferroptosis.
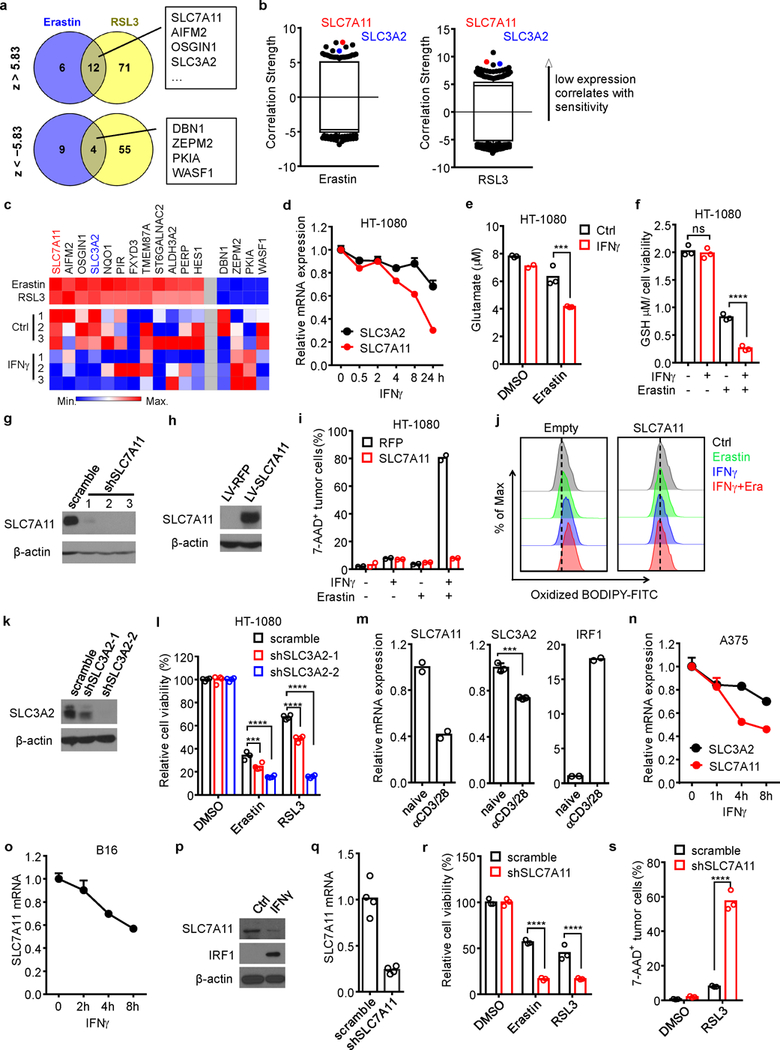
a, Venn diagram showing common genes whose expressions were negatively (z > 5.83) or positively (z < −5.83) associated with cell line sensitivity to erastin and RSL3.
b, Box-and-whisker plots show 1st and 99th percentile outlier transcripts (black and colored dots) whose expression levels are correlated with cell line sensitivity to erastin and RSL3. Plotted values are z scored Pearson’s correlation coefficients.
c, Heat maps of the 16 genes associated with the sensitivity to erastin and RSL3 and their expressions in IFNγ-treated HT-1080 cells (bottom). Left 12 genes are negatively associated with drug sensitivity; right 4 genes are positively associated with drug sensitivity.
d, Relative mRNA expressions of SLC3A2 and SLC7A11 in HT-1080 cells treated by IFNγ at different time points. n = 3 biological replicates (mean ± s.d.).
e, The concentration of glutamate released from HT-1080 cells primed by IFNγ, followed by DMSO or erastin treatment. n = 3 biological replicates. *** P < 0.001 as determined by one-way ANOVA.
f, Intracellular GSH in HT-1080 cells treated with IFNγ (10 ng/ml) for 24 hours and followed with erastin (0.5 μM) for 16 hours. n = 3 biological replicates. ns, P = 0.8843 and **** P < 0.0001 were determined by one-way ANOVA.
g, h, Immunoblots of SLC7A11 in HT-1080 cells. HT-1080 cells expressed scramble shRNA, 3 independent shRNAs targeting SLC7A11 (g) and lentivector-expressing RFP and SLC7A11 (h).
i, The percentage of 7-AAD+ cells in HT-1080 cells with red fluorescent protein (RFP) or SLC7A11 cDNA, primed with or without IFNγ, then treated with or without erastin (5 μM) for 20 hours. n = 2 biological repeats.
j, Lipid ROS in HT-1080 cells with empty vector (Empty) or SLC7A11 cDNA primed with IFNγ, followed with erastin treatment for (1 μM) for 20 hours. The representative histogram plot for fluorescent of oxidized C11-BODIPY is shown.
k, Immunoblots of SLC3A2 in HT-1080 cells expressed scramble shRNA or 2 independent shRNAs targeting SLC3A2.
l, Relative viability of HT-1080 cells expressing scramble shRNA or shRNA targeting SLC3A2 (shSLC3A2–1, 2), treated with erastin or RSL3 for 24 hours. n = 4 biological replicates; *** P < 0.001, **** P < 0.0001 as determined by two-way ANOVA.
m, Relative mRNA expressions of SLC7A11, SLC3A2, and IRF1 in HT-1080 cells treated for 24 hours with the supernatants from naïve or activated CD8+ T cells. *** P < 0.001 as determined by two-tailed t-test.
n, Relative mRNA expressions of SLC3A2 and SLC7A11 in human A375 cells treated by IFNγ at different time points.
o, Relative mRNA expression of SLC7A11 in B16 cells treated by IFNγ at different time points.
p, Immunoblots of mouse SLC7A11 and IRF1 in B16 cells treated with IFNγ (10 ng/ml) for 24 hours. β-actin serves as the loading control. Images are representative of two experiments.
q, Relative mRNA expression of SLC7A11 in B16 cells expressing shRNA against SLC7A11.
r, Relative viability of B16 cells expressing scramble shRNA or shRNA targeting SLC7A11 treated with erastin or RSL3 for 24 hours. **** P < 0.0001 as determined by two-way ANOVA.
s, The percentage of 7-AAD+ B16 cells expressing scramble shRNA or shRNA targeting SLC7A11 treated with RSL3 for 16 hours. **** P < 0.0001 as determined by one-way ANOVA.
Extended Data Fig. 6. IFNγ inhibits SLC7A11 through the JAK-STAT1 pathway.
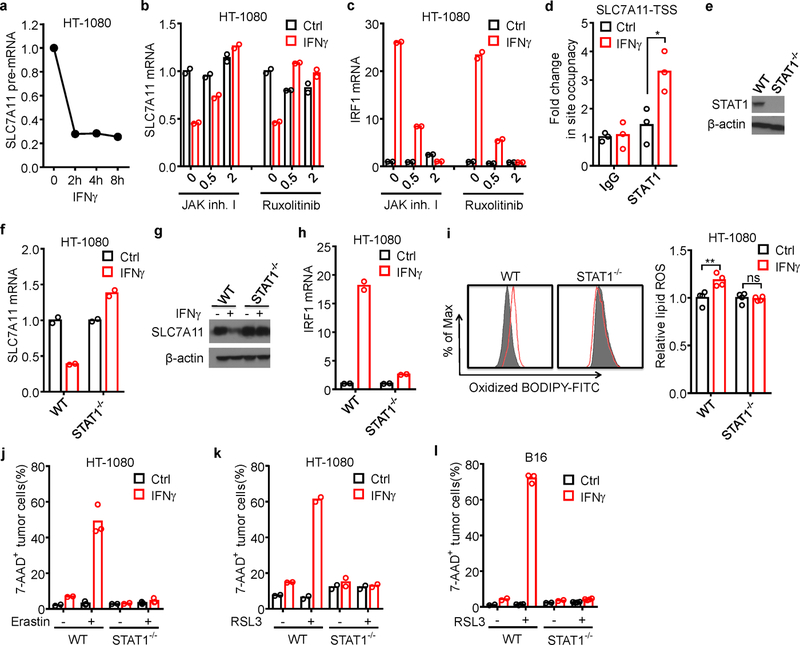
a, Relative expression of SLC7A11 pre-mRNA in HT-1080 cells treated by IFNγ at different time points.
b, c, Relative mRNA expressions of SLC7A11 (b) or IRF1 (c) in HT-1080 cells treated by IFNγ and JAK inhibitor I or ruxolitinib (0, 0.5 or 2 µM) for 24 hours.
d, ChIP of STAT1 in HT-1080 cells treated with or without IFNγ. STAT1 binding to SLC7A11 TSS region was quantified by qPCR. Results are expressed as the fold changes in site occupancy over control. * P = 0.0156 as determined by two-way ANOVA.
e, Immunoblot of STAT1 in HT-1080 cells with STAT1 wild-type or STAT1 deficiency (STAT1−/−) generated by CRISPR-Cas9.
f-k, STAT1 wild-type or STAT1 deficient (STAT1−/−) HT-1080 cells treated with or without IFNγ. SLC7A11 mRNA level (f), SLC7A11 immunoblot (g), IRF1 mRNA level (h), relative lipid ROS (i), erastin-induced cell death (j), and RSL3-induced cell death (k) were analyzed. ** P = 0.0033; ns, P > 0.9999 (two-way ANOVA) (i, right panel).
l, The percentage of 7-AAD+ STAT1 wild-type or deficient (STAT1−/−) B16 cells treated with or without IFNγ, followed with RSL3 treatment for 24 hours. n = 3 biological replicates.
Extended Data Fig. 7. Cyst(e)inase and PD-L1 blockade synergistically induce ferroptosis.
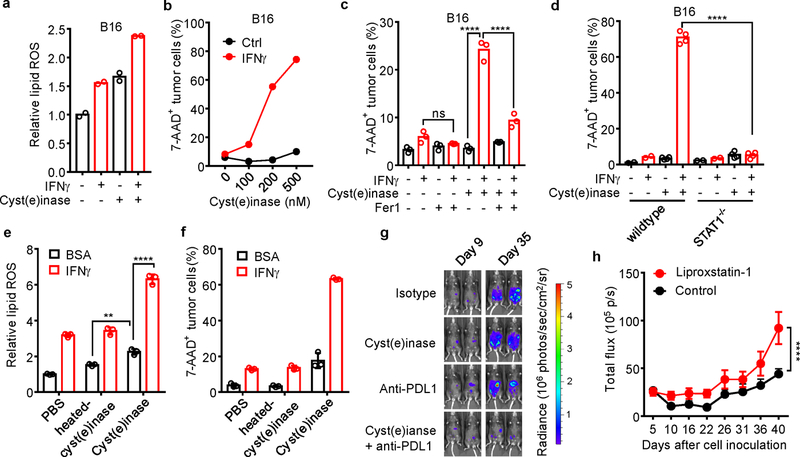
a, Relative lipid ROS in B16 cells primed by IFNγ, followed by 500 nM cysteinase for 12 hours. n = 2 biological repeats.
b, The percentage of 7-AAD+ B16 cells primed by IFNγ for 24 hours, followed with treatment with different concentrations of cyst(e)inase for 40 hours. n = 2 biological repeats.
c, The percentage of 7-AAD+ B16 cells primed by IFNγ, followed by 400 nM cysteinase treatment in the presence of 10 µM Fer1 for 24 hours. n = 3 biological replicates. ns, P = 0.7290 and **** P < 0.0001 were determined by one-way ANOVA.
d, The percentage of 7-AAD+ STAT1 wild-type or STAT1−/− B16 cells treated with or without IFNγ, followed by 500 nM cyst(e)inase treatment for 40 hours. n = 2 or 4 biological replicates. **** P < 0.0001 as determined by one-way ANOVA.
e, f, Relative lipid ROS (e) or the percentage of 7-AAD+ B16 cells (f) primed by IFNγ or BSA, followed by treatment with 500 nM heated-cysteinase or cyst(e)inase for 24 hours (e) or 40 hours (f). n = 3 biological replicates. ** P = 0.0023 and **** P < 0.0001 were determined by two-way ANOVA.
g, Effect of cyst(e)inase combined PD-L1 blockade on IB8 tumor growth. Tumor was monitored over time by quantifying total flux in mouse peritoneal cavity and IVIS imaging of representative mice from indicated days was shown.
h, Effect of liproxstatin-1 on anti-tumor efficacy of the combination therapy. ID8 tumor-bearing mice receiving the combination of cyst(e)inase and anti-PD-L1 were treated with liproxstatin-1 (10 mg/kg, n = 9) or DMSO (control, n = 9). Tumor growth was monitored over time by quantifying total flux in peritoneal cavity. **** P < 0.0001 as determined by two-way ANOVA.
Extended Data Fig. 8. System xc- expression correlates to immune signatures and patient outcome.
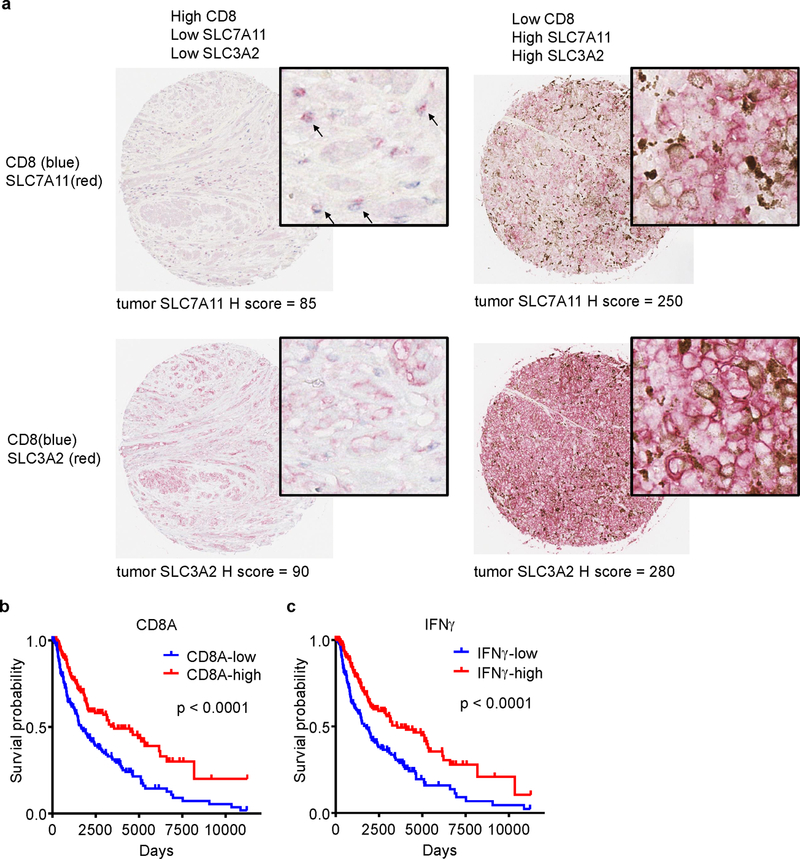
a, Representative images of dual staining of CD8 and SLC7A11 (upper panel) or CD8 and SLC3A2 (lower panel) by immunohistochemistry in human melanoma tissues. The levels of SLC7A11 and SLC3A2 expression on tumor cells were assessed by the H-score method.
b, c, Kaplan–Meier survival curves for melanoma patients with low (n = 231) and high (n = 232) CD8A expression (a), and low (n = 231) and high (n = 232) IFNγ signature score (b). P values were determined by log-rank test.
Supplementary Material
Acknowledgements:
We thank all members of the Zou laboratory for helpful suggestions.
This work was supported in part by research grants from the NIH/NCI R01 grants (CA217648, CA123088, CA099985, CA193136 and CA152470), and the NIH through the University of Michigan Rogel Cancer Center Support Grant (CA46592) (WZ); the NIH/NCI grant (CA189623) (ES and GG); the Pershing Square Sohn Cancer Research grant, the PaineWebber Chair, the NIH/NCI grant (CA205426), the STARR Cancer Consortium, the NCI R35 (CA232097), and the NIH/NCI Cancer Center Support Grant (P30 CA008748) (TAC).
Footnotes
Competing interests GG and ES are inventors on intellectual property related to cyst(e)inase and hold equity interest in Aeglea Biotherapeutics Inc. TAC is a co-founder of Gritstone Oncology and holds equity. TAC holds equity in An2H. TAC acknowledges grant funding from Bristol-Myers Squibb, AstraZeneca, Illumina, Pfizer, An2H, and Eisai. TAC has served as a paid advisor for Bristol-Myers Squibb, Illumina, Eisai, and An2H. MSK has licensed the use of TMB for the identification of patients that benefit from immune checkpoint therapy to PGDx. MSK and TAC receives royalties as part of this licensing agreement. WZ has served as a consultant or advisor for Lycera, NGM, Synlogic, and Henlix.
Data availability
RNA-sequencing data that support the findings of this study have been deposited in NCBI Gene Expression Omnibus (GEO) under accession number GSE128392. All other data that supported the findings of this study is available from the corresponding author upon request.
References
- 1.Zou W, Wolchok JD & Chen L PD-L1 (B7-H1) and PD-1 Pathway Blockade for Cancer Therapy: Mechanisms, Response Biomarkers and Combinations. Sci Transl Med 8, 328rv324 (2016). [DOI] [PMC free article] [PubMed] [Google Scholar]
- 2.Khalil DN, Smith EL, Brentjens RJ & Wolchok JD The future of cancer treatment: immunomodulation, CARs and combination immunotherapy. Nature reviews. Clinical oncology 13, 394, (2016). [DOI] [PMC free article] [PubMed] [Google Scholar]
- 3.Barry M & Bleackley RC Cytotoxic T lymphocytes: all roads lead to death. Nat Rev Immunol 2, 401–409 (2002). [DOI] [PubMed] [Google Scholar]
- 4.Golstein P & Griffiths GM An early history of T cell-mediated cytotoxicity. Nat Rev Immunol, 18, 527–535 (2018). [DOI] [PubMed] [Google Scholar]
- 5.Dixon SJ et al. Ferroptosis: an iron-dependent form of nonapoptotic cell death. Cell 149, 1060–1072 (2012). [DOI] [PMC free article] [PubMed] [Google Scholar]
- 6.Yang WS et al. Regulation of ferroptotic cancer cell death by GPX4. Cell 156, 317–331, (2014). [DOI] [PMC free article] [PubMed] [Google Scholar]
- 7.Kagan VE et al. Oxidized arachidonic and adrenic PEs navigate cells to ferroptosis. Nat Chem Biol 13, 81–90 (2017). [DOI] [PMC free article] [PubMed] [Google Scholar]
- 8.Doll S et al. ACSL4 dictates ferroptosis sensitivity by shaping cellular lipid composition. Nat Chem Biol 13, 91–98 (2017). [DOI] [PMC free article] [PubMed] [Google Scholar]
- 9.Conrad M, Angeli JP, Vandenabeele P & Stockwell BR Regulated necrosis: disease relevance and therapeutic opportunities. Nat Rev Drug Discov 15, 348–366 (2016). [DOI] [PMC free article] [PubMed] [Google Scholar]
- 10.Linkermann A et al. Synchronized renal tubular cell death involves ferroptosis. Proceedings of the National Academy of Sciences of the United States of America 111, 16836–16841 (2014). [DOI] [PMC free article] [PubMed] [Google Scholar]
- 11.Yang WS & Stockwell BR Ferroptosis: Death by Lipid Peroxidation. Trends in cell biology 26, 165–176 (2016). [DOI] [PMC free article] [PubMed] [Google Scholar]
- 12.Kim SE et al. Ultrasmall nanoparticles induce ferroptosis in nutrient-deprived cancer cells and suppress tumour growth. Nature nanotechnology 11, 977–985 (2016). [DOI] [PMC free article] [PubMed] [Google Scholar]
- 13.Braumuller H et al. T-helper-1-cell cytokines drive cancer into senescence. Nature 494, 361–365 (2013). [DOI] [PubMed] [Google Scholar]
- 14.Yamanaka K et al. A novel fluorescent probe with high sensitivity and selective detection of lipid hydroperoxides in cells. RSC Advances 2, 7894–7900 (2012). [Google Scholar]
- 15.Tsoi J et al. Multi-stage Differentiation Defines Melanoma Subtypes with Differential Vulnerability to Drug-Induced Iron-Dependent Oxidative Stress. Cancer cell 33, 890–904 e895 (2018). [DOI] [PMC free article] [PubMed] [Google Scholar]
- 16.Rees MG et al. Correlating chemical sensitivity and basal gene expression reveals mechanism of action. Nat Chem Biol 12, 109–116 (2016). [DOI] [PMC free article] [PubMed] [Google Scholar]
- 17.Ishimoto T et al. CD44 variant regulates redox status in cancer cells by stabilizing the xCT subunit of system xc(−) and thereby promotes tumor growth. Cancer cell 19, 387–400 (2011). [DOI] [PubMed] [Google Scholar]
- 18.Schroder K, Hertzog PJ, Ravasi T & Hume DA Interferon-gamma: an overview of signals, mechanisms and functions. J Leukoc Biol 75, 163–189 (2004). [DOI] [PubMed] [Google Scholar]
- 19.Wang W et al. Effector T Cells Abrogate Stroma-Mediated Chemoresistance in Ovarian Cancer. Cell 165, 1092–1105 (2016). [DOI] [PMC free article] [PubMed] [Google Scholar]
- 20.Linher-Melville K, Haftchenary S, Gunning P & Singh G Signal transducer and activator of transcription 3 and 5 regulate system Xc- and redox balance in human breast cancer cells. Molecular and cellular biochemistry 405, 205–221 (2015). [DOI] [PubMed] [Google Scholar]
- 21.Cramer SL et al. Systemic depletion of L-cyst(e)ine with cyst(e)inase increases reactive oxygen species and suppresses tumor growth. Nature medicine 23, 120–127 (2017). [DOI] [PMC free article] [PubMed] [Google Scholar]
- 22.Alvarez SW et al. NFS1 undergoes positive selection in lung tumours and protects cells from ferroptosis. Nature 551, 639–643 (2017). [DOI] [PMC free article] [PubMed] [Google Scholar]
- 23.Riaz N et al. Tumor and Microenvironment Evolution during Immunotherapy with Nivolumab. Cell 171, 934–949 e915 (2017). [DOI] [PMC free article] [PubMed] [Google Scholar]
- 24.Buck MD, Sowell RT, Kaech SM & Pearce EL Metabolic Instruction of Immunity. Cell 169, 570–586 (2017). [DOI] [PMC free article] [PubMed] [Google Scholar]
- 25.O’Neill LA, Kishton RJ & Rathmell J A guide to immunometabolism for immunologists. Nat Rev Immunol 16, 553–565 (2016). [DOI] [PMC free article] [PubMed] [Google Scholar]
- 26.Bligh EG & Dyer WJ A rapid method of total lipid extraction and purification. Can J Biochem Physiol 37, 911–917 (1959). [DOI] [PubMed] [Google Scholar]
- 27.Rosenberg JE et al. Atezolizumab in patients with locally advanced and metastatic urothelial carcinoma who have progressed following treatment with platinum-based chemotherapy: a single-arm, multicentre, phase 2 trial. Lancet 387, 1909–1920 (2016). [DOI] [PMC free article] [PubMed] [Google Scholar]
- 28.Dixon SJ et al. Pharmacological inhibition of cystine-glutamate exchange induces endoplasmic reticulum stress and ferroptosis. eLife 3, e02523 (2014). [DOI] [PMC free article] [PubMed] [Google Scholar]
- 29.Wu YM et al. Inactivation of CDK12 Delineates a Distinct Immunogenic Class of Advanced Prostate Cancer. Cell 173, 1770–1782 e1714 (2018). [DOI] [PMC free article] [PubMed] [Google Scholar]
Associated Data
This section collects any data citations, data availability statements, or supplementary materials included in this article.


