Abstract
Purpose:
To develop an implantable wireless coil with parametric amplification capabilities for time-domain electron paramagnetic resonance (EPR) spectroscopy operating at 300 MHz.
Methods:
The wireless coil and lithium phthalocyanine (LiPc), a solid paramagnetic probe, were each embedded individually in a biocompatible polymer polydimethoxysiloxane (PDMS). EPR signals from the LiPc embedded in PDMS (LiPc/PDMS) were generated by a transmit-receive surface coil tuned to 300 MHz. Parametric amplification was configured with an external pumping coil tuned to 600 MHz and placed between the surface coil resonator and the wireless coil.
Results:
Phantom studies showed significant enhancement in signal to noise using the pumping coil. However, no influence of the pumping coil on the oxygen-dependent EPR spectral linewidth of LiPc/PDMS was observed, suggesting the validity of parametric amplification of EPR signals for oximetry by implantation of the encapsulated wireless coil and LiPc/PDMS in deep regions of live objects. In vivo studies demonstrate the feasibility of this approach to longitudinally monitor tissue pO2 in vivo and also monitor acute changes in response to pharmacologic challenges. The encapsulated wireless coil and LiPc/PDMS engendered no host immune response when implanted for ~3 weeks and were found to be well tolerated.
Conclusions:
This approach may find applications for monitoring tissue oxygenation to better understand the pathophysiology associated with wound healing, organ transplantation, and ischemic diseases.
Keywords: implantable coil, EPR oximetry, time-domain EPR, wireless coil, LiPc, tissue oxygen monitoring
1 |. INTRODUCTION
Tissue oxygen status is one of the important factors governing health and disease influenced by physiological and pathophysiological factors.1–4 Quantitative a priori determination of tissue pO2 is of significant value in the diagnosis of disease states, and also in the development of suitable therapies.5 Ischemic diseases such as peripheral vascular diseases and diabetic wounds are conditions where longitudinal monitoring of pO2 at sites of interest will be of clinical value.1,3,4 Several methods exist to quantitatively monitor tissue pO2, such as polarographic electrodes and optical fibers, which provide such information longitudinally, but these methods are invasive and limited to probe accessible sites.6,7 Transcutaneous oxygen measuring devices probe peripheral regions but are often associated with long measurement times.8
Electron paramagnetic resonance (EPR) spectroscopic methods using paramagnetic probes have been successfully used to quantitatively monitor pO2 over a period of weeks to years when implanted in sites of interest.1,5,9,10 Paramagnetic molecular oxygen interacts with an implanted paramagnetic probe by means of spin-spin interaction causing line broadening; the extent of line broadening is linearly dependent on pO2, allowing quantitation.11–16 Several studies have used this approach in various animal models and also in humans.5 EPR signals can be detected in the frequency domain (continuous wave or CW EPR) or in the time-domain (pulsed EPR).17–19 CW EPR is compatible with large linewidths, thus allowing the use of a wide variety of probes. Pulsed EPR, in contrast, is restricted to narrow linewidth (<300 mG) paramagnetic probes and a low operational frequency (200–1200 MHz) is required for in vivo studies.
Solid paramagnetic probes, such as lithium phthalocyanine (LiPc) and lithium octa-n-butoxy-naphthalocyanine (LiNc-BuO), have been used successfully for in vivo pO2 determinations using pulsed EPR and CW-EPR at frequencies in the range 300–1200 MHz.20–22 The high spin content per unit volume, the linear response of their spectral line-widths to pO2, and their in vivo chemical stability have made LiPc and LiNc-BuO optimal for such applications. Furthermore, encapsulating the paramagnetic materials in polydimethysiloxane (PDMS) renders the oxygen probe biologically inert in vivo without altering its spectral response to pO2.23 In vivo studies using PDMS encapsulated LiPc and LiNc-BuO probes have demonstrated practical applications of in vivo EPR oximetry, and recent efforts have been directed toward implanting these probes in deeper tissues in vivo for longitudinal profiling of pO2.2,24–26 Volume resonators and surface coil resonators were used for studying small objects inside the resonators or at superficial sites. Implantable coils are being developed to permit monitoring of pO2 in deeper regions by achieving higher SNR to enable reliable linewidth estimation.27
In 1975, Feldman et al detected EPR signals in vivo from liver regions of a live anesthetized rat at X band frequency using an implantable coil.28 Several recent studies report the use of inductively coupled coils placed in proximity to LiPc/PDMS or LiNc-BuO/PDMS, demonstrating the feasibility of this approach. Increasing the sensitivity of EPR signals detection of these probes implanted at greater depths enhances clinical utility.5
Similar configurations of implantable coils have been used for NMR/MRI in vivo studies for high resolution anatomical imaging.29–34 Recently, higher sensitivities were achieved in NMR/MRI by implementing parametric amplification, where weak signals from the implanted coil are mixed with a strong signal from an external inductively coupled loop.34 Sensitivity enhancement in such configurations was comparable to that obtained with wired connections to the coil. The inductively coupled coil configurations were also used to obtain high resolution anatomic images from internal organs at an operating field of 11.7T corresponding to a 1H NMR frequency of 500 MHz.34
Because in vivo EPR frequencies are in the same range as in clinical MRI, it was of interest to examine the feasibility of such amplification strategies for permanently implanted wireless coils, which can then enhance signals from minute oxygen sensing solid paramagnetic probes based on artifact-free anatomic images from MRI.30 Although EPR signal detection can be done in CW mode implanted wireless coils,27 configurations with parametric amplification can be adapted in pulsed EPR spectroscopy. In this study, we describe inductively coupled wireless coils with parametric amplification for in vivo EPR applications at an operating frequency of 300 MHz and demonstrate the feasibility of long-term monitoring tissue pO2 at a region of interest over a time period of several weeks.
2 |. METHODS
2.1 |. Paramagnetic Probe
To test the performance of the wireless coil, we used solid N-methyl pyridinium tetracyanoquinodimethane (NMP-TCNQ), which generates strong and stable signal independent of pO2. To evaluate the effect on linewidth and animal experiment, LiPc/PDMS was used as the oxygen sensitive probe. The LiPc was mixed with the polymer (PDMS) similar to published procedures.23 The length of the probe was approximately 5 mm. As previously reported,23 the response of LiPc/PDMS to the change in oxygen was immediate.
2.2 |. Wireless Coil Assembly for 300 MHz Pulsed EPR
The schematics for the wireless coil for EPR detection system are illustrated in Figure 1. The wireless coil detection system consists of three different coils: (i) an implantable wireless coil tuned to 300 MHz and 600 MHz (hereafter called “wireless coil”) shown in Figure 1D, left; (ii) an external pumping coil tuned to 600 MHz to energize the wireless coil (hereafter called “pumping coil”) shown in Figure 1D, right; and (iii) an external transmit and receive surface coil tuned to 300 MHz working both to transmit the pulse and receive the signal connected to the EPR spectrometer (here-after called “TxRx coil”) shown in Figure 1D, center. The wireless coil is implanted into the animal’s body for in vivo EPR experiments.
FIGURE 1.
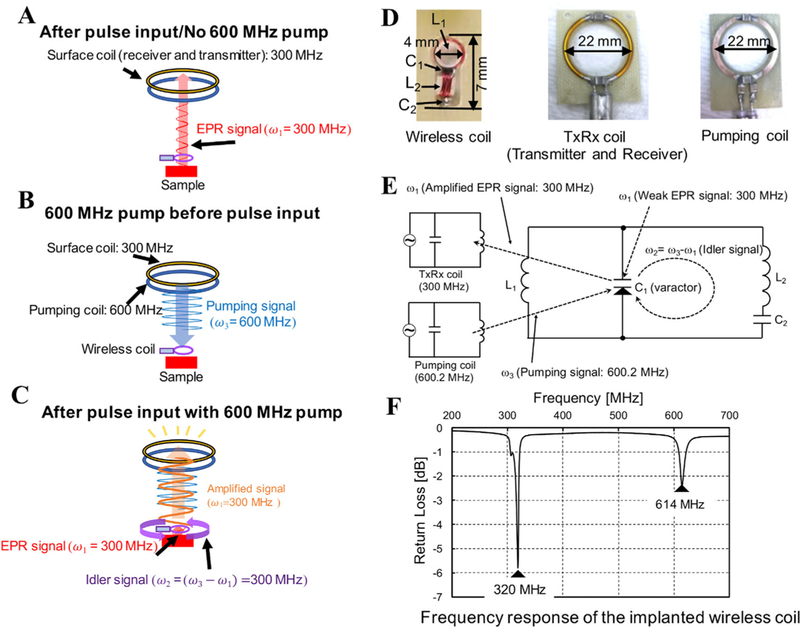
A, Conventional EPR signal acquisition with sample and wireless coil 9.5 mm away from the EPR Surface coil; a relatively small signal is received. B, Pumping signal continuously sent to the wireless coil, but no response from the wireless coil. C, Pumping signal and the pulses are applied. Immediately an idler signal of 300 MHz is generated in the wireless coil. With the idler signal the response from the sample after the pulse is amplified as shown. D, Pictures of wireless coil, TxRx coil and pumping coil used in this study are shown. E, The schematic electrical circuit of the wireless coil. L1 in wireless coil is inductively coupled with both of TxRx coil and pumping coil. C1 is a varactor diode to mix and amplify the weak signal in the parametric amplifier mode. F, The spectrum shows the resonant frequencies of doubly tuned wireless coil, measured using a pick-up loop connected to a network analyzer
The principle of wireless amplification is schematically shown in Figure 1A–C, and was previously described in detail for 1H MRI.34,36 In brief, both the transmitted pulse and the EPR signal received from the sample are at the spectrometer operating frequency ω1. The signal at ω1 (300 MHz) from the sample is mixed with the pumping signal ω3 (600 MHz) to produce an idler frequency of ω2 = ω3- ω1. The idler signal at frequency ω2 (300 MHz) is again mixed with pumping signal at frequency ω3 to produce a secondary amplified EPR signal at ω1, which is received by the TxRx coil of the EPR spectrometer. The wireless coil inductively receives power from pumping coil to amplify the signal. The oscillation of the wireless coil circuit starts when the pumping power reaches the oscillation threshold, i.e., the power level necessary to make the total circuit resistance negative, caused by the varactor diode. The oscillation of the wireless coil itself occurs at ω3/2 when the power of pumping signal exceeds the oscillation threshold.
The wireless coil resonator is doubly tuned with inductors L1 and L2, and varactor diode C1, and capacitor C2 at the pumping frequency and the excitation frequency for EPR. This is known as the double frequency resonator and is diagrammed in Figure 1E,F. The pumping signal ω3 is approximately twice the frequency of EPR signal ω1. This frequency setting is essential for the use of a double frequency implantable resonator, which enabled the EPR signal ω1 and idler signal ω2 to share the same circuit. The double frequency resonator is a small wireless coil suitable for implanting at the tissue depth of interest.
In MRI experiments, the pumping power is turned on only during signal reception and is shut off during transmission of the pulse. However, for the EPR experiment, switching the pumping power on and off is very difficult owing to the very short repetition transmit pulse (80 ns) and repetition time (25 μs). Therefore, the pumping power is continuously on at twice the Larmor frequency during measurements, and causes some transmission power leakage in the wireless coil. The leaked power increased the dead time from the normal 350 ns to 1000 ns. All the measurements were thus acquired after 1000 ns.
It is necessary to distinguish the oscillation signal from the EPR amplified signal as their frequencies are identical. First, the oscillation threshold power is determined. Importantly, this determination is performed at a main magnetic field of 302 MHz to distinguish the main field from wireless coil oscillation at 300 MHz. To find the oscillation threshold power, the input to the pumping coil is increased from −10 dBm at increments of 1 dBm for the oscillations to appear (Figure 2A). In our experiments, the oscillations were observed between −8 dBm and 23 dBm, depending on the load and the position of the wireless coil. Once the oscillation threshold power is identified, the pumping power is reduced such that the oscillation appears but with reduced intensity (Figure 2B). The pumping power is then further decreased until the oscillation completely disappears (Figure 2C). Under these conditions, the oscillation signal vanishes and the available pumping power (optimum pumping power) mixes with the EPR signal to become the idler signal to generate the amplified EPR signal with no underlying oscillation. At this optimum pumping power, only the amplified EPR signal appears (Figure 2C). Once this optimal pumping power is identified, the magnetic field is brought back to the resonant frequency of 300 MHz for further experiments.
FIGURE 2.
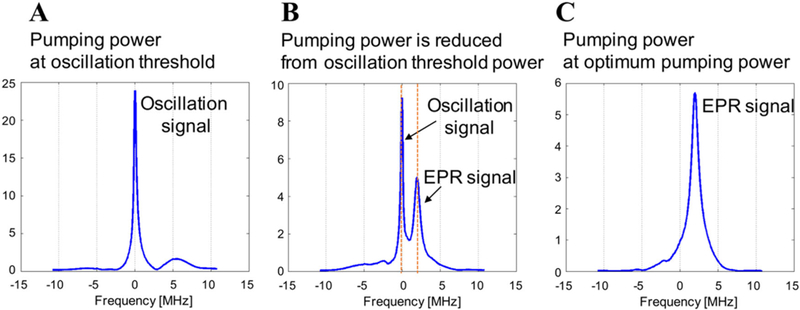
The method to distinguish the amplified EPR signal with the other signal. A, When pumping power reaches to the level equal to the oscillation threshold power, the oscillation starts and the sharp and strong single peak appeared at the frequency of ω3/2 (300 MHz). B, As the pumping power is reduced from the oscillation threshold power, the EPR signal also started to appear. The oscillation signal is still present but its intensity is gradually decreased. C, At the optimum pumping power level, the peak of amplified EPR signal appeared. In this condition, oscillation signal becomes the idler signal and amplifies the signal
Figure 1E shows the detailed electrical schematic of wireless system. L1 is a two-turn loop with an outer diameter of 4 mm and L2 is a four-turn rectangular inductor wrapped around a 2.5 × 2.5 mm2 square. C1 is the varactor diode (1SV285, Toshiba, Tokyo, Japan), which performs frequency mixing; C2 is a 2.7 pF chip capacitor (ATC100A, American Technical Ceramics, Huntington Station, NY). The total length and height of the wireless coil were 7 mm and 2.5 mm, respectively. Enameled copper wire (32 AWG) was used for the construction of the wireless coil. The diameter of the pumping coil and the TxRx coil for both transmission and reception were both 22 mm in diameter. The pumping coil provides the wireless coil with energy (pumping signal) for amplifying the signal from the wireless coil.
The pumping signal frequency was adjusted to 600.2 MHz, at which frequency the pumping coil was effectively inductively coupled to the wireless coil. The pumping signal of 600.2 MHz is a continuous radio wave from a function generator which was phase locked to a standard 10 MHz source. The resonant frequency of the TxRx coil was set to 300 MHz. Each coil had coupling circuits, including the tuning and impedance matching circuits for fine adjustment. Generally, when dielectric samples are placed near the coil, the resonant frequency decreases. We put variable capacitors in the matching and tuning circuits to account for shifts caused by implantation into tissue. The tunable range for TxRx coil (Q of 25; bandwidth 12 MHz) was approximately 5 MHz, and the pumping coil (bandwidth 0.194 MHz) had a tunable range of 30 MHz. The resonant frequencies of the TxRx and pumping coils were tuned to the required resonance frequency by varying the tuning and matching capacitors.37
2.3 |. EPR Spectrometer
The home-built time-domain EPR spectrometer operates at a resonant frequency of 300 MHz corresponding to a magnetic field of 10 mT. The instrument was used with a repetition time of 25 μs; pulse width, 80 ns; number of sampling point, 992; number of averages, 100,000; and transmit power, 80 W.38 The details of the spectrometer have been reported in prior publications.12,18,35
2.4 |. Phantom Experiment
In the phantom experiment, we evaluated the signal amplification function of the wireless coil, verified the relation of pumping power and the SNR, and investigated the effect on linewidth.
2.4.1 |. Evaluation of the signal amplification by wireless coil
To investigate the signal amplification by wireless coil, we acquired the spectra using the solid paramagnetic probe NMP-TCNQ. The EPR measurements were performed: (i) with wireless coil and pumping power, (ii) with wireless coil and no pumping power, and (iii) without the wireless coil (Figure 3A).
FIGURE 3.
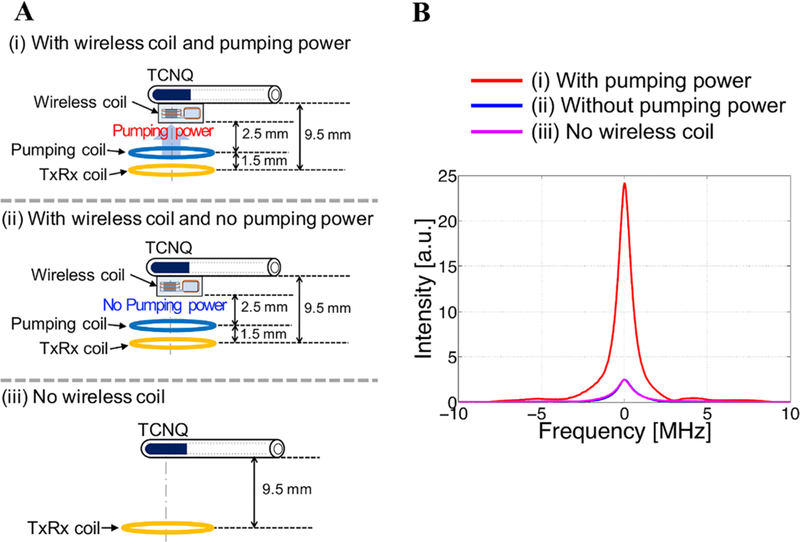
A, Experimental setup to evaluate the signal amplification by wireless coil and pumping power. B, EPR spectra acquired with and without the wireless coil and pumping power
2.4.2 |. Relation of pumping power and SNR
To examine the effect of increasing the pumping power on SNR, we systematically changed the distance between the wireless coil with the NMP-TCNQ sample and a set of external coils (TxRx coil and pumping coil). While the distance is varied, the pumping power was increased to get the optimum pumping power. Measurements were repeated 5 times for each condition and the mean SNR was calculated. The SNR was calculated by dividing the maximum intensity by the root mean square (RMS) of the noise floor.
2.4.3 |. Measurement using oxygen sensitive material
To investigate the effect of the wireless amplifying system on the SNR and linewidth of the EPR signal, we obtained EPR spectra with and without pumping power. We used LiPc/PDMS (total 9.6 mg) placed in a glass tube (5 mm inner diameter and 45 mm length) filled with saline solution (Figure 4A). The penetration depth of loop coil such as surface coil is approximately equal to half of its loop diameter.39 Hence, the penetration depth could be estimated at 11 mm, because the diameters of TxRx coil and pumping coil are 22 mm. The wavelength in muscle (dielectric constant ϵr = 58) is 13 cm.
FIGURE 4.

A, Experimental setup to investigate the relation between oxygen concentration and linewidth. For each oxygen concentration, the respective gas mixture is purged for 1 hour and the then the wireless coil measurements are made. To release the pressure in the tube, 34G needle was also put through the rubber cap. B, Describes how each of the coils are placed physically. The sample is ~ 9.5 mm from the EPR surface coil
In this experiment, working at a depth around 1 cm, we set the distance between the sample and the TxRx coil to 9.5 mm so that the TxRx coil could transmit the EPR excitation pulses to excite electron spins in the sample and receive the EPR signal (Figure 4B). The pumping coil was placed between the TxRx coil and the wireless coil to enable the wireless coil to receive the pumping power. The LiPc/PDMS samples were studied at three different oxygenation levels by equilibrating the sample tube with gas mixtures which contained 0%, 2%, and 5% of oxygen, respectively, for 1 h. After 1 h of gas bubbling, the measurement was repeated 5 times for each level of oxygenation with and without applying the pumping power at each oxygen concentration. The SNR was calculated with the same way as described in the phantom experiments. The linewidth was calculated using obtained from the FID signal.
2.5 |. Encapsulation of Wireless Coil
For in vivo experiments, the wireless coil was encapsulated with PDMS (SILASTIC MDX4–4210 Biomedical Grade Elastomer, Dow Corning, Midland, MI), for biocompatibility and to insulate the circuit from the environment of animal body. The encapsulated wireless coil was cured at room temperature, then the outside dimension of the wireless coil was increased to 5 mm × 11 mm × 5 mm (Figure 5A). The edges of PDMS cube including the wireless coil were chamfered to implant it smoothly into subcutaneous layer of a mouse leg. Three paramagnetic probes (LiPc/PDMS) were secured to the encapsulated wireless coil before implantation.
FIGURE 5.
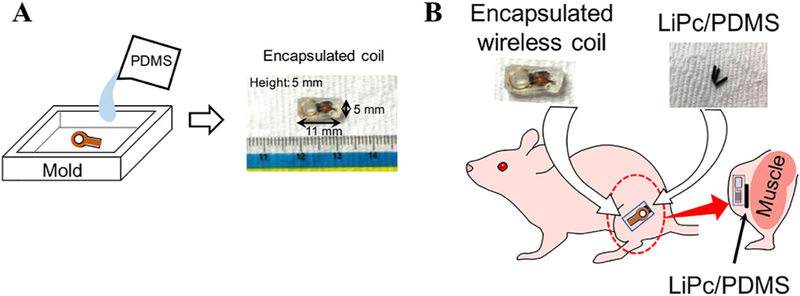
Preparation for in vivo EPR oximetry. A, The wireless coil is placed in a mold that is bigger than the required size. Then the PDMS solution is poured in the mold, keeping the wireless coil in the center. After a day, the mold was removed and the PDMS sides are cut and chamfered to the required dimension and shown in the right side. B, The LiPc/PDMS were tied to the encapsulated wireless coil using surgical suture. This was placed in the lateral side of the left hind leg by making a 5-mm incision in the subcutaneous area
2.6 |. Animals
Wireless coils were implanted in a female athymic NCr-nu/nu mouse that were 20 weeks old and weighed 30 g. For animal surgery, anesthesia induction started with 4% isoflurane carried by medical grade air and was maintained by 1–2% isoflurane in medical air. To implant the encapsulated wireless coil, a 5-mm incision was made on lateral side of the left hind leg and a pocket was made in the subcutaneous area. The encapsulated wireless coil and LiPc/PDMS were implanted into the pocket in that subcutaneous area. During measurements, the mouse was anesthetized by isoflurane. All procedures were performed according to the Guideline for the Care and Use of Laboratory Animals of the National Institutes of Health.
2.7 |. In Vivo Oximetry
To demonstrate the in vivo EPR oximetry with the wireless amplifying system, we monitored the change in linewidth of EPR spectra associated with changes of oxygen concentration in the mouse body. The schematics of the encapsulated wireless coil, LiPc/PDMS, and the implantation are shown in Figure 5B. The distance between TxRx coil and pumping coil was approximately 1.5 mm, and between pumping coil and paramagnetic probe was approximately 8 mm.
To interrogate whether the encapsulated wireless coil-LiPc/PDMS combination responds to dynamic changes in pO2 as a result of pharmacologic interventions, EPR spectra were collected with and without pumping when the breathing gas of the mouse was changed from air to carbogen (95% O2, 5% CO2). Baseline EPR spectra were acquired from the mouse in normal breathing air to compare the SNR with and without the pumping power. Then carbogen breathing was initiated. The mouse breathed carbogen for 30 min, and then the breathing gas was switched back to medical air (21% O2). These experiments were repeated 3 times for every 7 days from the 5th day after coil implantation. In the measurement on day 5, 10% oxygen gas was used for breathing to simulate hypoxic conditions after 40 min of 21% O2 inhalation. The SNR and linewidth were calculated as with the phantom experiments. During animal experiments, the pumping power was further reduced by 0.2 dBm below the oscillation threshold to avoid undue oscillations.
Placing xenobiotic objects in vivo over extended periods of time may trigger host inflammatory responses. To examine the biocompatibility of the implantable coil and the LiPc/PDMS combination, the area surrounding the implantation (right hind leg) and the contralateral side of the tissue (left hind leg) were excised and examined histologically after a total implantation time of 26 days.
3 |. RESULTS
3.1 |. Signal Intensity with and without Wireless Coil and Pumping Power
Figure 3B shows the comparison of signal intensity with: (i) wireless coil with pumping power, (ii) wireless coil with no pumping power, and (iii) no wireless coil. It is known that an implanted resonator coil that is strongly coupled to an external resonator can enhance the signal without pumping power.31,34 However, perhaps due to the low resonator Q value required for ringing suppression in pulsed EPR, no such effect was observed in our experiments. When the pumping was switched on, improvements in signal intensity were observed and is shown in Figure 3B, where an approximately 10-fold improvement in signal intensity was achieved.
3.2 |. Pumping Power and Signal Improvement
Table 1 shows the relation between pumping power and SNR. In the experiment, the pumping power was varied approximately 4 times (−9.0 dBm to −4.4 dBm), but the amplification factor was largely unchanged. Thus, the increase in pumping power does not affect the SNR under these conditions. We observed a distance-related decrease in SNR when the distance between the TxRx coil and the wireless coil (including the sample) was increased.
TABLE 1.
Relation between the position of the wireless coil, pumping power, and SNR
| Distancea [mm] |
Pumping power [dBm] |
SNR |
||
|---|---|---|---|---|
| With pumping |
Without pumping |
Improvement | ||
| 5.5 | −9.0 | 568 | 118 | 4.8 |
| 6.5 | −8.2 | 573 | 88 | 6.5 |
| 7.5 | −7.8 | 474 | 91 | 5.2 |
| 8.5 | −6.1 | 443 | 71 | 6.2 |
| 9.5 | −5.1 | 295 | 46 | 6.4 |
| 10.5 | −4.4 | 286 | 45 | 6.3 |
Distance between external coils (TxRx coil and pumping coil) and the wireless coil with TCNQ sample.
3.3 |. Wireless Coil Measurement Using LiPc/PDMS
Figure 6A shows the comparison of signal intensity and line-width at different oxygen concentrations. Figure 6B shows the comparison of signal intensity and SNR with and without pumping power. As shown in Figure 6B, signal intensities with pumping power were 8.46, 1.50, and 1.09 at 0%, 2%, and 5% of oxygen level, respectively; decreasing to 1.65, 0.26, and 0.15 without pumping power. Thus, the wireless coil improved the signal intensity five- to seven-fold. Similarly, the SNRs with pumping power were 1350, 268, and 175, respectively, and 314, 54, and 32 without pumping power. The SNR improvement is comparatively less than the amplification factor, because the wireless coil amplifies the noise also. Figure 6C shows the comparison of the relationship between the linewidth and oxygen concentration with or without pumping power. The P-values were P = 0.17, 0.78, and 0.87, respectively, for the linewidths at each oxygen concentration, indicating that the presence or absence of pumping power did not affect linewidth. This is an important validation of the wireless amplification approach for pO2 determination.
FIGURE 6.
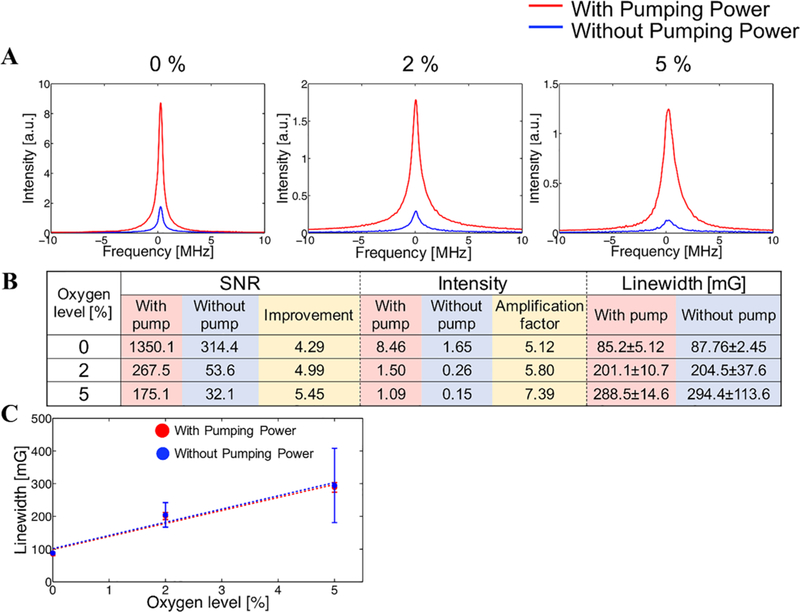
A, Comparison of EPR spectra. Each spectrum was acquired under 0%, 2%, 5% of oxygen level, respectively. B, Detail data of SNR, intensity, and linewidth of each spectrum. While the SNR and signal intensity were improved by the wireless coil, the linewidth was not varied by the wireless coil. In the column of linewidth data, each value shows mean ± SD. C, The relation between oxygen concentration and linewidth with and without pumping power. Each point shows the mean value and SD of 5 measurements
As seen in Figure 6A, the signal without the pumping power is almost in the detection threshold of the machine. There is lot of noise interference. Therefore, the variation in the reading without pumping power is there. However, on application of pumping power, the SNR improved significantly, enabling stability in reading. In particular at higher oxygen concentrations, the linewidth of the signal obtained with pumping power had higher intensity, less variance of linewidth and SNR than that of the signal obtained without pumping power making this approach more robust at a wide range of pO2 values.
3.4 |. Animal Experiments
Figure 7A–C show the EPR signal with and without pumping on days 5, 12, and 19 when the mouse was breathing air. The applied pumping power varied between 19 and 22 dBm on each day. This difference in optimum pumping power was due to variations in the position of the TxRx and pumping coils related to the wireless coil implanted in the mouse leg. Although the applied pumping power was changed because of the position variation from day to day, the signal intensity with pumping power applied was enhanced 8–11 times and the SNR was also improved 2–3 times in each in vivo measurement as shown in Figure 7D. These results were consistent with the outcome shown in Table 1. The linewidth of the spectra acquired on day 5 was significantly narrower than that acquired on the other 2 days due to the wound healing process, a hypoxic process.40 While the SNR values increased when pumping power was applied, the linewidths were almost the same value regardless of pumping power throughout the experiments. The encapsulated wireless coil-LiPc/PDMS combination was stable in signal amplification rate and oximetric stability during this time period.
FIGURE 7.
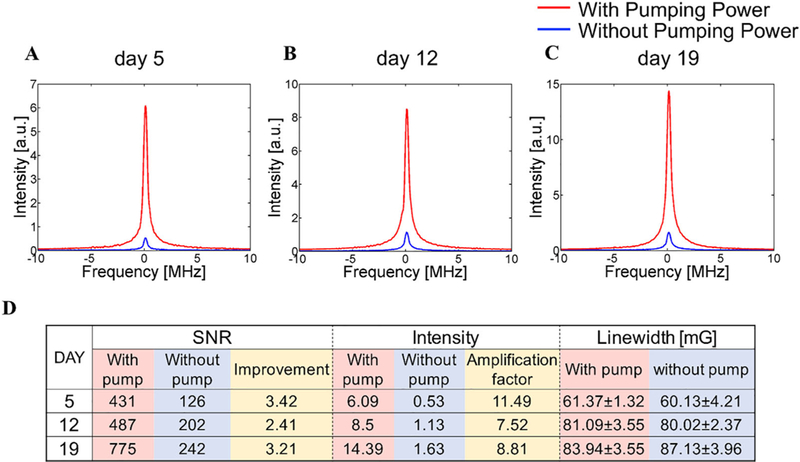
A-C, Spectrum collected in different days after the implantation of wireless coil. D, Detail data of the spectrum acquired on each day. In the column of linewidth data, each value shows mean ± SD. On each day, the improvement of SNR and intensity was achieved without changes in linewidth compared with the results acquired without pumping power. In addition, the wireless coil kept working 19 days in animal body
Figure 8 shows the transition of the linewidth in response to changes in oxygen in the breathing gas. After breathing of carbogen gas started, the linewidth gradually increased and reached maximum value in approximately 20 min. In addition, according to the results of day 5 measurements, a rapid decrease in linewidth was observed after breathing of 10% oxygen. The responses to oxygen concentration showed similar patterns throughout the study; i.e., an increase in oxygen content in the breathing gas was followed by an increase in linewidth.
FIGURE 8.
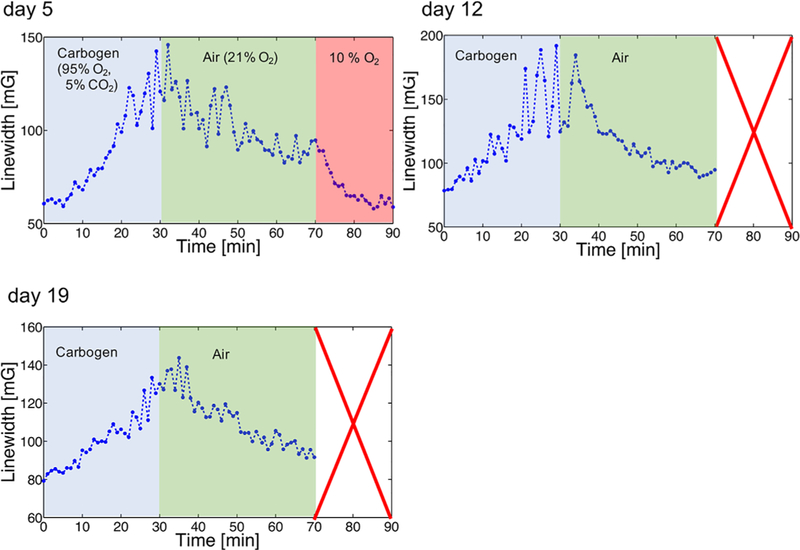
Change of the linewidth by making the mouse breathe different oxygen concentrations. Based on the transition from one oxygen to another oxygen, the linewidth increased or decreased, depending on the saturation time. This experiment was repeated on day 5, day 12, and day 19 after the wireless coil was implanted. Only on day 5 the mouse breathed 10% oxygen
Figure 9A shows histological images of excised sections of tissue from the area surrounding the wireless coil/LiPc implant, and Figure 9B shows images of control tissue excised from the contralateral intact region of the same mouse. The wireless coil was implanted in the layer between the panniculus carnosus muscle and skeletal muscle. The tissue from the implantation region was stained with hematoxylin and eosin stain. The results showed no obvious morphological alterations in comparison to that of opposite leg. However, fibrous tissue formation was observed beneath panniculus carnosus muscle where the coil was implanted, which was attributed to stimulation of fibroblasts by the implantation. No apparent cellular infiltration of lymphocytes or macrophages was observed, suggesting that encapsulation of the wireless coil and LiPc in the biocompatible material PDMS could successfully minimize any immunoactivation induced by coil implantation. These results suggest that the encapsulated wireless coil-LiPc/PDMS complex is biocompatible for longitudinal monitoring of pO2 over extended periods of time.
FIGURE 9.
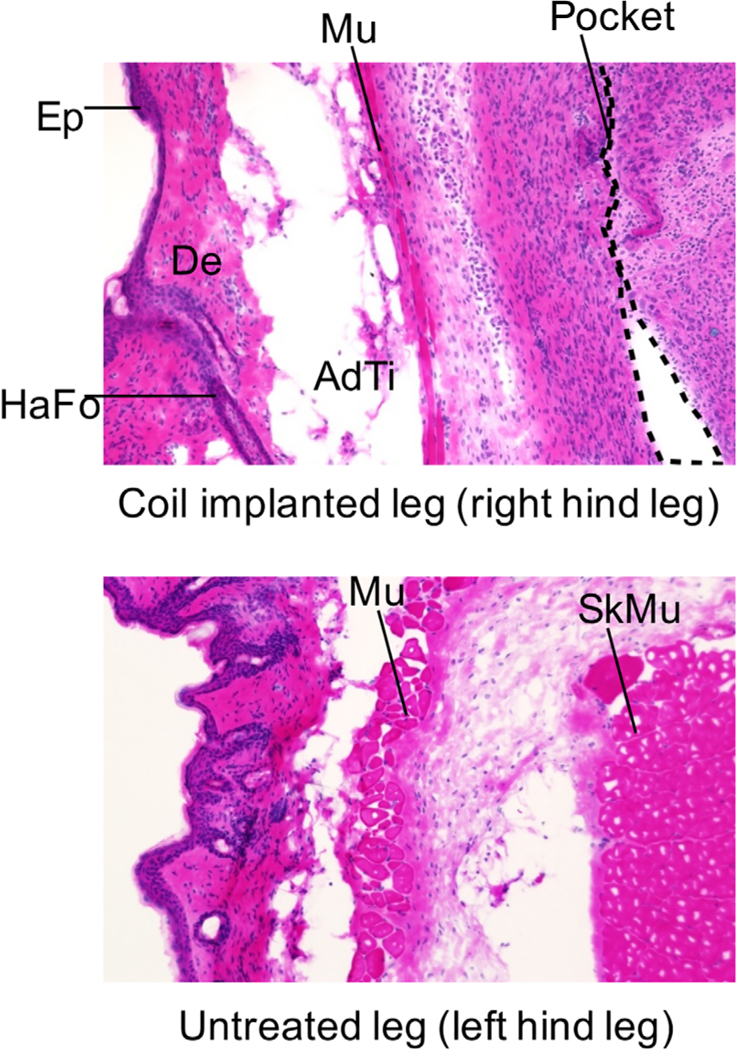
Histological sections of tissue surrounding the wireless coil and that of tissue of untreated leg. Each tissue was excised from the mouse 26 days after the wireless coil was implanted. Each abbreviation in these images indicates the region as follows: AdTi, adipose tissue; De, dermis; Ep, epidermis; HaFo, hair follicle; Mu, panniculus carnosus muscle; Pocket, wireless coil pocket; SkMu, skeletal muscle
4 |. DISCUSSION
In the present study, we designed and tested an implantable miniaturized wireless coil for amplification of EPR signals from a nearby solid LiPc EPR probe encapsulated with oxygen permeable and flexible PDMS. The spectral properties (oxygen induced line broadening) enabled monitoring tissue pO2 at the site of implantation over extended periods of time. Significant enhancement in signal intensity and improvements in SNR of the EPR signals from the paramagnetic probe were realized by energizing the implanted coil with a pumping coil. Signals detected by the surface coil resonator of the EPR spectrometer showed unchanged linewidth, recommending this method for reliable oximetric applications.
There are several unique aspects to this method for longitudinal monitoring of tissue pO2 over period of weeks to months. The implantable coil and paramagnetic probe combination embedded in biocompatible material enabled studies free from immune response complications. The spectral invariance and significant enhancement in signal intensity and SNR make this a practical approach for probing pO2 in a wide range of physiological conditions over an extended term. The wireless configuration coupled with a low power pumping coil can be clinically useful for implantation in deep tissue.
Pulsed EPR signal detection is optimal with over-coupled resonators, compared with CW mode of signal acquisition where resonators are critically coupled and thus subject to motional artifacts. The operational aspects of the spectrometer are, therefore, simplified with minimal training required.18 Biocompatibly encapsulated implantable wireless coil assemblies34 with LiPc/PDMS make it possible to monitor physiological changes at regions of interest over extended periods of time. Major enabling factors of this technology include low magnetic fields (10–30 mT) with the RF ranges in the range of 300–900 MHz, and the strong magnetic moment of electrons in the paramagnetic probe, which allow the engineering of a simple, miniaturized implantable coil/probe. The device is potentially capable of monitoring pO2 at a site of interest in an out-patient setting over extended time periods. With the wireless coil tuned to 300 MHz, it is possible to obtain anatomic images of the implantation region where LiPc/PDMS are implanted, from conventional MRI as well as other imaging biomarkers such as perfusion, cellularity, and metabolite levels from dynamic MRI, diffusion weighted MRI, and 1H MR spectroscopy. This unique capability may enable a truly comprehensive interrogation of the local environment over extended periods of time.
5 |. CONCLUSIONS
In this study, we demonstrated the feasibility of EPR oximetry with an encapsulated wireless implantable coil using 300 MHz pulsed EPR for parametric amplification. This configuration increased the SNR of EPR spectra by 2–3 times and the amplification factor by 8–11 times (Figure 7D) with minimal effects on EPR spectral linewidth in in vivo EPR oximetry. Advances in technical developments of implantable coils, following this proof-of-principle study, will find applications in low-cost monitoring in several important clinical applications such as peripheral vascular diseases, organ transplant, and cerebral and myocardial ischemic diseases.
REFERENCES
- [1].Hou H, Grinberg OY, Grinberg SA, Demidenko E, Swartz HM. Cerebral tissue oxygenation in reversible focal ischemia in rats: multisite EPR oximetry measurements. Physiol Meas. 2005;26:131–141. [DOI] [PubMed] [Google Scholar]
- [2].Khan N, Hou H, Eskey CJ, et al. Deep-tissue oxygen monitoring in the brain of rabbits for stroke research. Stroke. 2015;46:e62–66. [DOI] [PMC free article] [PubMed] [Google Scholar]
- [3].Sen CK, Khanna S, Gordillo G, Bagchi D, Bagchi M, Roy S. Oxygen, oxidants, and antioxidants in wound healing: an emerging paradigm. Ann N Y Acad Sci. 2002;957:239–249. [DOI] [PubMed] [Google Scholar]
- [4].Yellon DM, Hausenloy DJ. Myocardial reperfusion injury. N Engl J Med. 2007;357:1121–1135. [DOI] [PubMed] [Google Scholar]
- [5].Swartz HM, Williams BB, Hou H, et al. Direct and repeated clinical measurements of pO2 for enhancing cancer therapy and other applications. Adv Exp Med Biol. 2016;923:95–104. [DOI] [PMC free article] [PubMed] [Google Scholar]
- [6].Elas M, Ahn KH, Parasca A, et al. Electron paramagnetic resonance oxygen images correlate spatially and quantitatively with Oxylite oxygen measurements. Clin Cancer Res. 2006;12(pt 1):4209–4217. [DOI] [PubMed] [Google Scholar]
- [7].Vaupel P, Kelleher DK. Blood flow and oxygenation status of prostate cancers. Adv Exp Med Biol. 2013;765:299–305. [DOI] [PubMed] [Google Scholar]
- [8].Jones LM, Rubadue C, Brown NV, Khandelwal S, Coffey RA. Evaluation of TCOM/HBOT practice guideline for the treatment of foot burns occurring in diabetic patients. Burns. 2015;41:536–541. [DOI] [PubMed] [Google Scholar]
- [9].Hou H, Khan N, Gohain S, et al. Dynamic EPR oximetry of changes in intracerebral oxygen tension during induced thromboembolism. Cell Biochem Biophys. 2017;75:285–294. [DOI] [PMC free article] [PubMed] [Google Scholar]
- [10].Hou H, Krishnamurthy Nemani V, Du G, et al. Monitoring oxygen levels in orthotopic human glioma xenograft following carbogen inhalation and chemotherapy by implantable resonator-based oximetry. Int J Cancer. 2015;136:1688–1696. [DOI] [PMC free article] [PubMed] [Google Scholar]
- [11].Desmet CM, Lafosse A, Veriter S, et al. Application of Electron Paramagnetic Resonance (EPR) oximetry to monitor oxygen in wounds in diabetic models. PLoS One. 2015;10:e0144914. [DOI] [PMC free article] [PubMed] [Google Scholar]
- [12].Devasahayam N, Subramanian S, Murugesan R, et al. Strategies for improved temporal and spectral resolution in in vivo oximetric imaging using time-domain EPR. Magn Reson Med. 2007; 57:776–783. [DOI] [PubMed] [Google Scholar]
- [13].Flood AB, Satinsky VA, Swartz HM. Comparing the effectiveness of methods to measure oxygen in tissues for prognosis and treatment of cancer. Adv Exp Med Biol. 2016;923:113–120. [DOI] [PMC free article] [PubMed] [Google Scholar]
- [14].Hou H, Dong R, Li H, et al. Dynamic changes in oxygenation of intracranial tumor and contralateral brain during tumor growth and carbogen breathing: a multisite EPR oximetry with implantable resonators. J Magn Reson. 2012;214:22–28. [DOI] [PMC free article] [PubMed] [Google Scholar]
- [15].Rivera BK, Naidu SK, Subramanian K, et al. Real-time, in vivo determination of dynamic changes in lung and heart tissue oxygenation using EPR oximetry. Adv Exp Med Biol. 2014;812:81–86. [DOI] [PMC free article] [PubMed] [Google Scholar]
- [16].Williams BB, Hou H, Coombs R, Swartz HM. EPR oximetry for investigation of hyperbaric O2 pre-treatment for tumor radio-sensitization. Adv Exp Med Biol. 2016;923:367–374. [DOI] [PubMed] [Google Scholar]
- [17].Matsumoto K, Chandrika B, Lohman JAB, Mitchell JB, Krishna MC, Subramanian S. Application of continuous-wave EPR spectral-spatial image reconstruction techniques for in vivo oxymetry: comparison of projection reconstruction and constant-time modalities. Magn Reson Med. 2003;50:865–874. [DOI] [PubMed] [Google Scholar]
- [18].Subramanian S, Devasahayam N, Krishna MC. Radiofrequency time-domain EPR imaging: instrumentation development and recent results in functional physiological in vivo imaging - art. no. 644106. Proc SPIE int Soc Opt Eng. 2007;6441:44106–44106. [Google Scholar]
- [19].Subramanian S, Matsumoto KI, Mitchell JB, Krishna MC. Radio frequency continuous-wave and time-domain EPR imaging and Overhauser-enhanced magnetic resonance imaging of small animals: instrumental developments and comparison of relative merits for functional imaging. NMR Biomed. 2004;17:263–294. [DOI] [PubMed] [Google Scholar]
- [20].Ilangovan G, Bratasz A, Li H, Schmalbrock P, Zweier JL, Kuppusamy P. In vivo measurement and imaging of tumor oxygenation using coembedded paramagnetic particulates. Magn Reson Med. 2004;52:650–657. [DOI] [PubMed] [Google Scholar]
- [21].Ilangovan G, Zweier JL, Kuppusamy P. Mechanism of oxygen-induced EPR line broadening in lithium phthalocyanine microcrystals. J Magn Reson. 2004;170:42–48. [DOI] [PubMed] [Google Scholar]
- [22].Pandian RP, Parinandi NL, Ilangovan G, Zweier JL, Kuppusamy P. Novel particulate spin probe for targeted determination of oxygen in cells and tissues. Free Radic Biol Med. 2003;35:1138–1148. [DOI] [PubMed] [Google Scholar]
- [23].Meenakshisundaram G, Eteshola E, Pandian RP, Bratasz A, Lee SC, Kuppusamy P. Fabrication and physical evaluation of a polymer-encapsulated paramagnetic probe for biomedical oximetry. Biomed Microdevices. 2009;11:773–782. [DOI] [PMC free article] [PubMed] [Google Scholar]
- [24].Khan N, Hou H, Swartz HM, Kuppusamy P. Direct and repeated measurement of heart and brain oxygenation using in vivo EPR oximetry. Methods Enzymol. 2015;564:529–552. [DOI] [PubMed] [Google Scholar]
- [25].Khan N, Mupparaju S, Hou H, Williams BB, Swartz H. Repeated assessment of orthotopic glioma pO(2) by multi-site EPR oximetry: a technique with the potential to guide therapeutic optimization by repeated measurements of oxygen. J Neurosci Methods. 2012;204:111–117. [DOI] [PMC free article] [PubMed] [Google Scholar]
- [26].Meenakshisundaram G, Eteshola E, Pandian RP, et al. Oxygen sensitivity and biocompatibility of an implantable paramagnetic probe for repeated measurements of tissue oxygenation. Biomed Microdevices. 2009;11:817–826. [DOI] [PMC free article] [PubMed] [Google Scholar]
- [27].Caston RM, Schreiber W, Hou H, et al. Development of the implantable resonator system for clinical EPR oximetry. Cell Biochem Biophys 2017;75:275–283. [DOI] [PMC free article] [PubMed] [Google Scholar]
- [28].Feldman A, Wildman E, Bartolinini G, Piette LH. In vivo electron spin resonance in rats. Phys Med Biol. 1975;20:602–612. [DOI] [PubMed] [Google Scholar]
- [29].Koretsky AP, Wang S, Murphyboesch J, Klein MP, James TL, Weiner MW. 31P NMR-spectroscopy of rat organs, in situ, using chronically implanted radiofrequency coils. Proc Natl Acad Sci USA. 1983;80:7491–7495. [DOI] [PMC free article] [PubMed] [Google Scholar]
- [30].Schnall MD, Barlow C, Subramanian VH, Leigh JS. Wireless implanted magnetic-resonance probes for in vivo NMR. J Magn Reson. 1986;68:161–167. [Google Scholar]
- [31].Yung AC, Kozlowski P. Signal-to-noise ratio comparison of phased-array vs. implantable coil for rat spinal cord MRI. Magn Reson Imaging. 2007;25:1215–1221. [DOI] [PubMed] [Google Scholar]
- [32].Silver X, Ni WX, Mercer EV, et al. In vivo 1H magnetic resonance imaging and spectroscopy of the rat spinal cord using an inductively-coupled chronically implanted RF coil. Magn Reson Med. 2001;46:1216–1222. [DOI] [PubMed] [Google Scholar]
- [33].Zhou X, Maronpot RR, Cofer GP, Hedlund LW, Johnson GA. Studies on bromobenzene-induced hepatotoxicity using in vivo MR microscopy with surgically implanted RF coils. Magn Reson Med. 1994;31:619–627. [DOI] [PubMed] [Google Scholar]
- [34].Qian C, Yu X, Chen DY, et al. Wireless amplified nuclear MR detector (WAND) for high-spatial-resolution MR imaging of internal organs: preclinical demonstration in a rodent model. Radiology. 2013;268:228–236. [DOI] [PMC free article] [PubMed] [Google Scholar]
- [35].Murugesan R, Afeworki M, Cook JA, et al. A broadband pulsed radio frequency electron paramagnetic resonance spectrometer for biological applications. Rev Sci Instrum. 1998;69:1869–1876. [Google Scholar]
- [36].Qian C, Murphy-Boesch J, Dodd S, Koretsky A. Sensitivity enhancement of remotely coupled NMR detectors using wirelessly powered parametric amplification. Magn Reson Med. 2012;68:989–996. [DOI] [PMC free article] [PubMed] [Google Scholar]
- [37].Enomoto A, Hirata H, Matsumoto S, et al. Four-channel surface coil array for 300-MHz pulsed EPR imaging: proof-of-concept experiments. Magn Reson Med. 2014;71:853–858. [DOI] [PMC free article] [PubMed] [Google Scholar]
- [38].Devasahayam N, Subramanian S, Murugesan R, et al. Parallel coil resonators for time-domain radiofrequency electron paramagnetic resonance imaging of biological objects. J Magn Reson. 2000;142:168–176. [DOI] [PubMed] [Google Scholar]
- [39].Bosch CS, Ackerman JJH. Surface coil spectroscopy New York: Springerlink; 1992. NMR basic principles and progress; vol 27. [Google Scholar]
- [40].Sen CK. Wound healing essentials: let there be oxygen. Wound Repair Regen. 2009;17:1–18. [DOI] [PMC free article] [PubMed] [Google Scholar]


