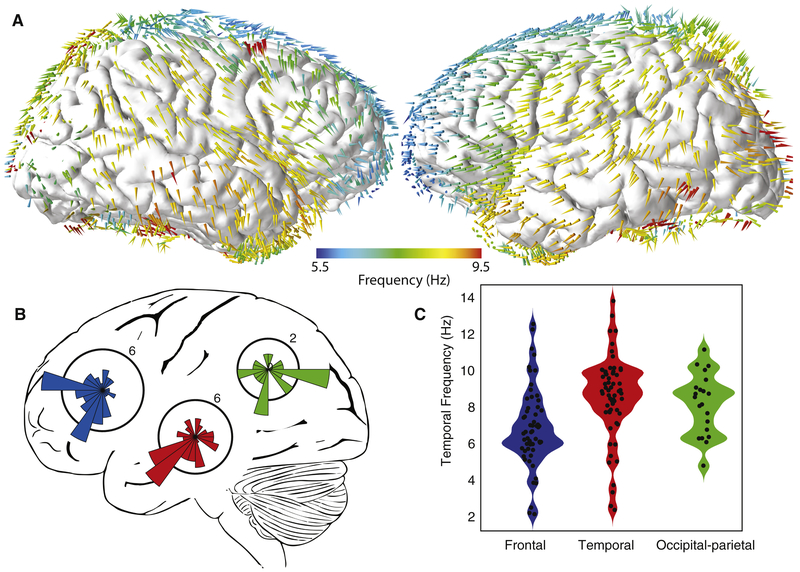
Figure 2: Population analysis of traveling wave direction and frequency.
(A) Spatial topography of mean traveling-wave direction and frequency. Colored arrows indicate the mean direction and frequency of traveling waves observed at an electrode within 1.5 cm. (B) Distribution of the mean direction of traveling waves from each lobe. The orientations of the polar histograms are projected to match the lateral brain view. (C) Distributions of temporal frequencies for traveling waves from different regions; shaded region indicates probability density. Black dots indicate the mean frequency from individual electrode clusters.

