

α-MoO3 is demonstrated as a mid-infrared biaxial hyperbolic crystal supporting in-plane phonon polaritons with concave wavefronts.
Abstract
Hyperbolic media have attracted much attention in the photonics community due to their ability to confine light to arbitrarily small volumes and their potential applications to super-resolution technologies. The two-dimensional counterparts of these media can be achieved with hyperbolic metasurfaces that support in-plane hyperbolic guided modes upon nanopatterning, which, however, poses notable fabrication challenges and limits the achievable confinement. We show that thin flakes of a van der Waals crystal, α-MoO3, can support naturally in-plane hyperbolic polariton guided modes at mid-infrared frequencies without the need for patterning. This is possible because α-MoO3 is a biaxial hyperbolic crystal with three different Reststrahlen bands, each corresponding to a different crystalline axis. These findings can pave the way toward a new paradigm to manipulate and confine light in planar photonic devices.
INTRODUCTION
Hyperbolic media are characterized by permittivity tensors that have a component along one axis with an opposite sign compared to the other two axes. They have been extensively studied for their unique optical properties, particularly their ability to support electromagnetic fields with arbitrarily high momenta and, hence, achieve very strong light confinement (1–3). This concept can be directly generalized to two-dimensional (2D) media, where surface waves or guided waves are considered and implemented using hyperbolic metasurfaces (HMSs) (4–6). HMSs are flat photonic nanopatterned structures that support guided waves with in-plane hyperbolicity and can control 2D light propagation in an unconventional way, giving rise to a variety of intriguing optical phenomena including, for example, all-angle negative refraction (7), substantial enhancement of the photonic density of states (4, 8), and wavefronts with concave curvatures (9, 10). However, the required patterning typically leads to substantial optical losses and limits the confinement that can be practically achieved. Furthermore, the electromagnetic responses of the HMSs are governed by permittivity tensors as derived from the effective medium theory, which only holds below the long-wavelength limit where the structural periodicity is much smaller than the incident wavelength. Consequently, the hyperbolic dispersion is constrained to a very small region in the reciprocal space, thus limiting the electromagnetic wave vectors. In principle, this issue can be alleviated by reducing the structural periodicities of the metasurfaces down to the sub–10-nm scale. However, this must be done without introducing additional surface roughness or defects, which presents a notable challenge using existing nanofabrication techniques (11). Thus, there exists a need for a natural medium that can be used to achieve in-plane hyperbolicity without nanopatterning; this remains a very important problem in the field of nanophotonics.
3D hyperbolic responses can occur in specific types of naturally existing homogeneous materials with strong dielectric anisotropies (11–14). Unlike artificial hyperbolic materials, the structural periodicities of natural hyperbolic materials are those of the crystal lattice and, thus, are on an atomic scale. Because of this characteristic, the hyperbolic dispersion of a natural hyperbolic material extends into a much larger region in the reciprocal space than that of an artificial one (14–16). In particular, van der Waals (vdW) crystals, which can be exfoliated in a layer-by-layer manner down to a single atomic planar layer, have been shown to exhibit excellent hyperbolic properties in the wavelength range from ultraviolet to terahertz (16–19). However, to the best of our knowledge, all of the vdW materials reported so far are uniaxial crystals with negative (positive) and isotropic in-plane permittivity but positive (negative) out-of-plane permittivity. When these materials are exfoliated into 2D flakes, because the optical axis coincides with the direction of exfoliation, they cannot achieve in-plane hyperbolic responses unless they are patterned (such as HMSs) (20).
In a recent study, we demonstrated highly confined hyperbolic phonon polaritons (PhPs) in a new type of vdW semiconducting crystal, α-phase molybdenum trioxide (α-MoO3), grown by the thermal physical deposition method (21). Here, we show that vdW α-MoO3 is actually a type of natural biaxial hyperbolic crystal and that it exhibits pristine in-plane hyperbolic dispersion in the mid-infrared range. In addition, we use high-resolution optical scanning probe nanoimaging techniques to investigate PhP modes as they are launched, guided, and manipulated within the different hyperbolicity bands in thin α-MoO3 crystal flakes. In particular, the concave wavefront of a polaritonic mode originating from the in-plane hyperbolicity of the flake is observed, which is an unmistakable signature of the preserved 3D hyperbolicity of this 2D material. Furthermore, potential applications of vdW α-MoO3 in focusing and manipulating mid-infrared electromagnetic fields at the nanoscale are demonstrated. It should be pointed out that the in-plane anisotropic PhPs in α-MoO3 have been demonstrated in a very recent study (22). In our current study, as discussed below, we move a step forward by proposing a universal 3D analytical dielectric and dispersion model, for describing the hyperbolic PhPs in the α-MoO3, providing direct experimental real-space image of the concave wavefront of the in-plane hyperbolic PhPs, and measuring the whole dispersion relations of the hyperbolic PhPs corresponding to the three Reststrahlen bands by combining scattering-type near-field scanning optical microscopy (s-SNOM) and photo-induced force microscopy (PiFM) techniques. The model we proposed can provide a description closer to the practical situation, which will be beneficial for other types of vdW materials supporting PhPs.
RESULTS
The infrared spectrum of α-MoO3 is governed by the phonon absorptions, as in other polar vdW crystal such as hexagonal boron nitride (h-BN). The lattice of α-MoO3 is composed of octahedral unit cells with nonequivalent Mo─O bonds along the three principal crystalline axes (Fig. 1A, inset) (23, 24). This crystalline structure gives rise to rich phonon modes that are infrared-active along different crystalline directions (23). In each Reststrahlen band between the longitudinal optical (LO) and transverse optical (TO) phonon frequencies, the reflectivity is expected to be high and the real part of the permittivity, Re(ε), is expected to be negative. In α-MoO3, there are three Reststrahlen bands in the mid-infrared range of 545 to 1010 cm−1: Band 1 in the range of 545 to 851 cm−1, which originates from the in-plane phonon mode along the [001] crystalline (y-axis) direction, and Bands 2 and 3 in the ranges of 820 to 972 cm−1 and 958 to 1010 cm−1, which originate from the phonon modes along the [100] (x-axis) and [010] (z-axis) directions, respectively (19, 20). The optical response of the α-MoO3 is dominated by the phonon absorption, thus its dielectric tensor can be calculated by using a Lonrentz model: , where εj denotes the principal components of the permittivity tensor. Parameter is the high frequency dielectric constant, and and refer to the LO and TO phonon frequencies, respectively. Parameter Γj is the broadening factor of the Lorentzian line shape. The x, y, and z denote the three principal axes of the crystal, which correspond to the crystalline directions [100], [001], and [010] of the α-MoO3, respectively. The thicknesses of the α-MoO3 flakes used in our study are 100 to 200 nm, where the quantum confinement effects can be ignored. Therefore, the phonon frequencies and lifetimes are independent of the thickness of the sample. To calculate the relative permittivities shown in Fig. 1A, the phonon frequencies are directly adopted from the literature values (21, 23), while the Γj and are treated as fitting parameters to make the theoretical near-field distributions match with the experimental measurements (see table S1), as discussed below. An α-MoO3 crystal can be exfoliated in the z direction to reduce it to thin flakes. α-MoO3 exhibits different permittivity values in these three bands along the three principal axes (i.e., εx ≠ εy ≠ εz); this is expected for a biaxial crystal. Furthermore, in the full range of 545 to 1010 cm−1, there is always at least one component with a negative Re(ε) value (Fig. 1A), making the crystal hyperbolic in the whole frequency range but along different directions for each of the Reststrahlen bands. Using the permittivity tensor, the isofrequency surfaces of α-MoO3 can be calculated by applying the general Fresnel equation: (see note S1) (25). To simplify the description, we only used the Re(ε) value in the calculations. Considering an α-MoO3 thin flake with a surface perpendicular to the [010] direction (z axis), as shown in Fig. 1B, the isofrequency surfaces for the PhPs in the three Reststrahlen bands are asymmetric hyperboloids, including two opening surfaces and a close surface near the center. The close surface can be ascribed to the transverse electric (TE) mode, that is, the ordinary electromagnetic wave in the crystal. Because of the closed topography, the maximum magnitude of TE mode wave vectors are finite, not allowing high electromagnetic field localizations. Therefore, in our current study, we only focus on the opening surfaces, which relate to PhPs with hyperbolic responses and therefore ultrahigh wave vectors. Specifically, in Band 1, where εy < 0 and εx ≠ εz > 0, the polaritonic modes exhibit out-of-plane and in-plane hyperbolic dispersion simultaneously. A similar effect occurs when εy is negative in Band 2. Thus, in Bands 1 and 2, strongly confined polaritonic modes exist in an α-MoO3 flake, with in-plane directional propagation depending on the specific hyperbolicity band. In Band 3, when εz is negative and εx and εy are positive but not equal to each other, the out-of-plane dispersion is hyperbolic but the in-plane dispersion is elliptical (Fig. 1B); as a result, the polaritonic mode propagates anisotropically in the x-y plane. These complex isofrequency surface behaviors are distinctly different from those that have been previously reported for uniaxial hyperbolic media (e.g., h-BN and hyperbolic metamaterials), which exhibit negative (positive) and isotropic in-plane permittivity and positive (negative) out-of-plane permittivity. For this reason, while nanostructuring is required for in-plane hyperbolic responses to occur in these conventional media, it is expected that this property can be achieved in α-MoO3 flakes naturally without the need for nanostructuring (20, 26).
Fig. 1. Mid-infrared biaxial hyperbolic electromagnetic responses of a vdW α-MoO3 flake.
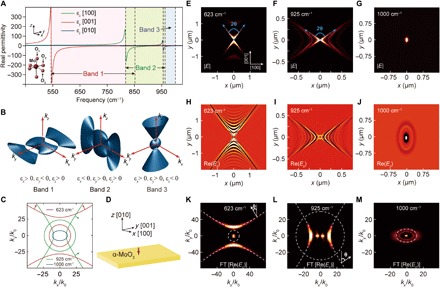
(A) Real parts of the permittivities along the three principal axes. The different Reststrahlen bands are shaded in different colors. Inset: Schematic showing the crystalline unit cell of α-MoO3. The three oxygen sites of the asymmetric Mo─O bonds along the different crystalline axes are labeled as O1, O2, and O3. (B) 3D isofrequency surfaces observed in the three Reststrahlen bands, indicating that biaxial hyperbolic dispersion occurs in natural vdW α-MoO3. (C) Isofrequency curves on the x-y plane at three typical frequencies, 623, 925, and 1000 cm−1. The red and green arrows indicate the propagation directions of the hyperbolic PhPs modes arising at 623 and 925 cm−1, respectively. (D) Schematic showing the launching of the PhPs on an α-MoO3 surface with a z-polarized electric dipole. (E to G) Calculated magnitudes of the electric field distributions, |E|, on a natural α-MoO3 surface at the same three frequencies as shown in (C). (H to J) Calculated real parts of z components of the electric field distributions, Re(Ez), on a natural α-MoO3 surface at the same three frequencies. (H) and (I) show two hyperbolic PhPs with in-plane concave wavefronts, while an elliptical wavefront is shown in (J). (K to M) Fourier transforms of (H) to (J), respectively. The white dashed lines delineate the corresponding isofrequency curves that are shown in (C).
The in-plane propagation behavior of PhPs in α-MoO3 can be predicted by inspecting the isofrequency curves in the x-y plane, as shown in Fig. 1C, for the typical frequencies of the three Reststrahlen bands. For frequencies of 623 cm–1 (Band 1) and 925 cm−1 (Band 2), two-sheet dispersion curves can be observed. In contrast, the dispersion for a frequency of 1000 cm−1 (Band 3) is elliptical (see also fig. S1). The in-plane hyperbolic responses can be revealed by calculating the polaritonic wave launched onto the surface of a 160-nm-thick α-MoO3 flake by an electric dipole source (Fig. 1D and see details in note S2 and fig. S2). Polaritonic waves with evident hyperbolic shapes can be seen in the electric field amplitude distributions at both 623 and 925 cm−1 (Fig. 1, E and F, respectively). In addition, the real parts of the Ez exhibit concave wavefronts, with opening directions along the y and x axes at 623 and 925 cm−1, respectively (Fig. 1, H and I). On the other hand, we observed elliptically shaped radial propagation at 1000 cm−1 (Fig. 1, G and J). These dispersive behaviors can be more visualized by plotting the Fourier transforms (FTs) of the Re(Ez) images (Fig. 1, K to M). The FT distributions are consistent with the trajectories shown in Fig. 1C, except for bright spots located at the centers of the images, which originate from the background electric fields launched by the electric dipole. The FT results also reveal that the in-plane hyperbolic dispersions can result into very large wave vectors and large field confinements (kPhPs/k0), which enable focusing and manipulation of the mid-infrared electromagnetic waves at a subwavelength scale. To be more specific, the polaritonic mode will propagate preferentially along a cone with an axis coincident with the direction normal to the isofrequency curve shown in Fig. 1. This means that the polaritonic wave propagation direction at 623 cm−1 (925 cm−1) is at θ = 34° (θ = 58°) with respect to the y axis (Fig. 1, E and F). These angles agree well with the theoretical values of 36° and 55° derived from the equation (12).
According to the theoretical description above, the propagation angle, θ, is very sensitive to the frequency, ω, increasing as the frequency increases in Band 1 and decreasing as the frequency increases in Band 2 (fig. S3). Similar behavior occurs in the calculated electric field distributions (fig. S2, B to G). Specifically, as the frequency increases in Band 1, the hyperboloid progressively opens and flattens, while the hyperbolic polariton transforms into a polaritonic plane wave at 820 cm−1. By further increasing the frequency in Band 2, the hyperboloid is reoriented from the y axis to the x axis; as the frequency is still further increased, a similar trend occurs as the hyperboloid progressively opens (fig. S2, E to G). These behaviors demonstrate how the hyperbolic polaritons in an α-MoO3 flake can be tuned by changing the excitation frequency.
To experimentally verify that α-MoO3 naturally exhibits in-plane hyperbolic responses, we used optical nano-imaging techniques to directly visualize the polaritonic modes supported on an α-MoO3 flake. In an initial experiment, we deposited a silver nanowire antenna (2.5 μm long and 60 nm wide) on the surface of the (010) crystalline plane (i.e., the x-y plane) of a 220-nm-thick α-MoO3 flake (Fig. 2A and note S3). Upon illumination with p-polarized light, the localized plasmons of the nanoantennas concentrated the optical fields to its extremities with sufficient momentum to launch a polaritonic wave onto the α-MoO3 surface. The polaritonic field, Ep [specifically, the direct contribution, as described in (27, 28)] interferes with the local field due to the material polarizability, Ein [i.e., the material contribution, as described in (27, 28)], giving rise to interference fringes on the sample surface. We mapped the interference patterns by measuring the scattered field from the metallic tip of an s-SNOM (Fig. 2B and note S4). Because of this interference, the near-field amplitude image closely matches the wavefronts of the polaritonic mode launched by the in-plane nanoantenna.
Fig. 2. Real-space imaging of the hyperbolic PhPs on the surface of a natural 220nm-thick α-MoO3flake.
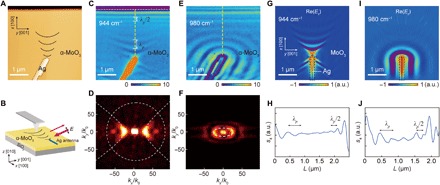
(A) Topography of the α-MoO3 flake with a silver nanoantenna placed on its surface. (B) Schematic showing the process of nano-imaging of the PhP waves propagating on the α-MoO3 surface. The black curves shown in (A) and (B) illustrate the wavefronts of the hyperbolic PhPs. (C and E) Real-space near-field optical images recorded at 944 and 980 cm−1, respectively. The edge of the flake and profile of the nanoantenna are denoted by white and black dashed lines, respectively. (D and F) Absolute values of the FT images corresponding to (C) and (E), respectively. The white dashed lines show the theoretically predicted isofrequency curves. (G and I) Numerical simulations of the Re(Ez) distributions corresponding to the PhPs launched by the silver nanoantenna at 944 and 980 cm−1, respectively. (H and J) Profiles of the s-SNOM amplitudes along the yellow dashed lines in (C) and (E), respectively. a.u., arbitrary units.
A near-field optical image obtained with a 944-cm−1 incident light (Band 2) is shown in Fig. 2C (εx = −0.98 + 0.08i, εy = 1.12 + 0.018i, and εz = 10.49 + 0.57i at this excitation frequency). Interference fringes with concave shapes are observed, originating from the tip of the nanoantenna. The anomalous wavefront has an opening direction along the [100] direction (x axis). In addition, the FT of the s-SNOM image (Fig. 2D) shows a dispersion of the hyperbolic shape, which is consistent with the isofrequency curves calculated using the Fresnel equation without any adjustable parameters (Fig. 1). When the illumination frequency is changed to 980 cm−1 (Band 3) such that the real parts of the in-plane permittivities are positive (εx = 0.67 + 0.04i, εy = 1.56 + 0.014i, and εz = −0.23 + 0.064i), the polariton wavefront changes from concave to convex (Fig. 2E). This occurs because the polaritons in Band 3 have no in-plane hyperbolic responses as evidenced by the elliptically shaped FT distribution (Fig. 2F). The experimentally obtained s-SNOM images can be further corroborated by numerical simulations based on the permittivities at these two frequencies (see details in note S5). As shown in Fig. 2 (G and I), the simulated near-field distributions are consistent with the experimentally obtained s-SNOM images in terms of both the fringe separations and curvatures. In addition, the opening angles and separations of the fringes change with the illumination frequency (see theoretical calculations in fig. S4).
An additional polaritonic feature that can be observed from the s-SNOM images shown in Fig. 2 (C and E) is fringes close to the flake edge with twice the periodicity of those close to the antenna (Fig. 2, H and J). These fringes result from polaritonic modes coupled into the flake by the s-SNOM tip (i.e., round-trip components): The polaritons are launched by the tip, reflected by the edge, and again sampled by the tip (27).
In another experiment, the in-plane polaritonic dispersion relations, , where is the wave number, were derived. To that end, we performed s-SNOM imaging on a carefully selected α-MoO3 flake that had two orthogonal natural edges, one along the [001] (y-axis) direction (edge I) and the other along the [100] (x-axis) direction (edge II), as determined using micro-Raman spectroscopy (Fig. 3A, note S6, and fig. S5). Under excitation frequencies of 910 and 926 cm−1 (Band 2), we observed the only fringes parallel to the [001] direction at edge I. This is consistent with the directional propagation of the polaritonic mode, resulting from the in-plane hyperbolic dispersion in this band, which shows that the isofrequency curve opens toward the [100] direction (Fig. 1C). This topology causes the polaritons to propagate perpendicularly to edge I instead of edge II (fig. S6, A to E). As a result, we obtained only fringes associated with the polariton waves launched by the s-SNOM tip and reflected from edge I (top panels in Fig. 3, D and F). In contrast, under frequencies in Band 1, only fringes perpendicular to the [001] direction were observed using PiFM (27, 28), as shown in Fig 3 (C, E, and G). Last, in Band 3, where εx ≠ εy > 0 > εz, the in-plane elliptical isofrequency curve allows polaritons to propagate in all directions, unlike in the other two bands. This results in fringes parallel to both edges I and II, as shown in Fig. 3D (bottom panel), under illumination at 986 and 992 cm−1. In addition, the lack of circular symmetry in the isofrequency curve resulted in a different periodicity for the fringes orthogonal to edges I and II at the same illuminating wavelength (Fig. 3F). We also observed this effect in the simulation, as shown in Fig. 3B (see also note S7 and fig. S7).
Fig. 3. In-plane PhP dispersion relations for a 160nm-thick α-MoO3flake.
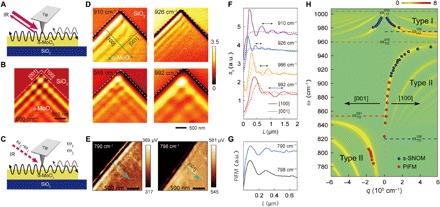
(A) Schematic showing real-space s-SNOM imaging of the PhPs reflected by the sample edges. (B) Numerical simulation of the PhP near-field distributions. (C) Schematic of PiFM imaging of the PhPs. Light is modulated at the difference between the frequencies of the two first cantilever modes. (D) s-SNOM images obtained with varied illumination frequencies. (E) PiFM images obtained in Band 1 at 790 and 798 cm−1 (left and right, respectively). (F) Near-field optical-amplitude profiles along the [100] (solid) and [001] (dashed) directions extracted from (D). (G) PiFM profiles along the [001] direction extracted from (E). (H) Dispersion relation for the PhPs in the α-MoO3 flake. The blue and red dots indicate experimental data extracted from s-SNOM and PiFM images, respectively, with different excitation frequencies. The pseudocolored image represents the calculated imaginary part of the complex reflectivity, Imrp(q, ω), of the air/α-MoO3/SiO2 multilayered structure.
Next, the polaritonic fringe periodicity was used to calculate the polariton wavelengths, λp, corresponding to the illumination frequency, ω (fig. S6 and movies S1 and S2), and the polaritonic wave vector ( = 2π/λp) (13, 15). As shown in Fig. 3H, the dispersion relation for the PhPs in α-MoO3 exhibits obvious in-plane anisotropic behaviors. Type I (type II) hyperbolic responses with positive (negative) real part of the in-plane permittivities are observed in the α-MoO3 flake. Specifically, for illumination frequencies between 780 and 800 cm−1, only type II PhPs propagating along the [001] direction were observed with decreasing (increasing) λp (q) values as ω was increased (fig. S9 and movie S1). A similar trend was observed in the frequency range of 820 to 950 cm−1, but the PhPs instead propagated toward the [100] direction (fig. S9 and movie S2). However, if ω is varied in the range of 820 to 950 cm−1, then type I PhPs were observed along both the [001] and [100] directions (movies S1 and S2) with decreasing q values as ω was increased. These experimental results agree well with the theoretical predictions shown as a 2D pseudocolored plot of the complex reflectivity (Fig. 3H, note S6, and fig. S8). In addition, the electromagnetic confinement (defined as q/k0) of the PhPs calculated according to the dispersion relation was as high as about 87 at 953 cm−1, corresponding to an effective refractive index of 87; this measurement agrees closely with the theoretically predicted value. In particular, a larger electromagnetic field confinement can be achieved in a flake with smaller thickness (21). For a monolayer α-MoO3 with a thickness of 1.4 nm, the maximum possible confinement that can be achieved would be 8100. This is an exciting value, although rigorous theoretical analysis taking into account the quantum confinement effect should be performed to give a more precise value.
The unique in-plane anisotropic hyperbolicity observed from α-MoO3 flakes can be combined with artificial confinement of the polaritonic modes imposed by structuring the flake into specific geometric shapes (29, 30). As a simple demonstration, we fabricated an α-MoO3 disk (1.6 μm in diameter, 160 nm thick) using a focused ion beam (FIB) and characterized its near-field optical properties (note S3) using s-SNOM. At an excitation frequency within Band 3 (992 cm−1), the polaritonic modes launched by the SNOM tip and reflected from the disk edges produce an elliptical interference pattern (Fig. 4A, top panel). Although the flake has cylindrical symmetry, the ellipticity of the isofrequency curve dominates all the way to the center of the disk. The polaritonic anisotropy (defined as λpx/λpy) was measured to be 1.47, which is comparable to the value of 1.25 reported in a recent study, although the previous study required a sample with a rather complex artificial heterostructure (31). In contrast, for the same structure, when the illumination frequency was in Band 2 (900 cm−1), the interference pattern comprised fringes that were deformed along the x axis (Fig. 4B, top panel). Notably, the absence of interference fringes at the direction along the y axis ([001] direction) can be observed, which arises from the previous observation that the in-plane hyperbolic isofrequency curves open toward the x axis (Fig. 1C). The interference patterns can be further controlled by structuring the α-MoO3 flake into other shapes, for example, a square slab with edges along the [001] and [100] direction of α-MoO3 (Fig. 4, A and B, bottom panels). For the PhPs excited in Band 3, we observed fringes along both of the [001] and [100] directions, while for Band 2, only straight fringes parallel to the [001] direction can be seen. These results indicate the geometry of the α-MoO3 flake as an additional degree of freedom for tailoring the electromagnetic waves.
Fig. 4. Subwavelength steering and focusing of the mid-infrared electromagnetic fields with the biaxial hyperbolic PhPs of the vdW α-MoO3flake.
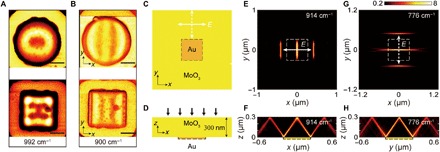
(A and B) Near-field optical images of a 1.6-μm-diameter, 160-nm-thick α-MoO3 disk (top) and a 1.5-μm-length, 150-nm-thick α-MoO3 square disk (bottom) at different illumination frequencies. Scale bars, 500 nm. (C and D) Schematics showing the top and side views, respectively, of the setup for subwavelength electromagnetic focusing with hyperbolic PhPs. A 20-nm-thick gold plate is placed under a 300-nm-thick α-MoO3 flake. (E and G) Calculated electric near-field distributions on the top surface of the α-MoO3 at illumination frequencies of 914 and 776 cm−1, respectively. (F and H) Calculated electric near-field distributions in a cross-section perpendicular to the top surface of the α-MoO3 flake at illumination frequencies of 914 and 776 cm−1, respectively.
One of the most promising applications for hyperbolic media is subdiffraction optical focusing, by taking advantage of their highly directional polariton waves (2, 4). However, in artificial HMSs, the degree of focusing is usually limited by the relatively small maximum wave vector they can provide. This limitation can be overcome by using natural hyperbolic materials because they have atomic-scale unit cells (12, 14, 15). Furthermore, in comparison with other natural hyperbolic materials, α-MoO3 is expected to exhibit anomalous optical focusing behavior due to its in-plane hyperbolicity. Specifically, in the uniaxial natural hyperbolic materials (e.g., h-BN), the in-plane isotropic dielectric tensor gives rise to PhP waves with isotropic wavefronts. Consequently, a point emitter placed on their surface will excite guided PhP waves with circular in-plane wavefront propagating on the surface. To focus these PhP waves, a circular gold nanodisk with a sharp edge is usually used (12, 15), which results in a focusing spot of circular shape. In contrast to the h-BN, the in-plane hyperbolic PhPs in α-MoO3 exhibit wavefronts of concave shapes. The opening directions of these concave waves are strongly dependent on the operation frequency. For the PhPs in Band 1, the opening directions of their wavefronts are along the [001] direction (y axis), whereas for those in Band 2, the opening directions for the wavefronts are along the [100] direction (x axis). These concave wavefronts can lead to interesting focusing spots of anisotropic shapes. To better demonstrate subdiffraction focusing of these concave waves, we used a square metal disk instead of a circular one. As shown in Fig. 4 (C and D), we simulated the guiding and focusing of mid-infrared light by a 300-nm-thick α-MoO3 flake as a proof-of-concept demonstration. To visualize the focusing spot, we placed a 20-nm-thick metallic slab (400 nm by 400 nm) underneath the MoO3 flake; it was intended to function as a nanoantenna to launch the polaritonic mode. Because of the in-plane anisotropic hyperbolic dispersion, the mid-infrared light can be guided and subsequently focused by controlling the frequency and polarization of the incident light. For example, if the MoO3 flake is illuminated with an x-polarized plane wave that has a frequency of 914 cm−1 such that the opening direction of the hyperboloid is along the [100] direction (x axis), then polaritonic waves are launched from the two slab edges that are parallel to the y axis (Fig. 4F). These waves subsequently propagate at a fixed angle with respect to the x axis, giving rise to narrow stripes that are oriented parallel to the [001] axis (y axis). These strips are approximately 80 nm wide (Fig. 4E), which is about 1/136 of the incident wavelength. In contrast, when the sample is excited with y-polarized light at 776 cm−1, the incident light is focused into stripes running parallel to the x axis (Fig. 4, G and H). This subdiffraction focusing behavior can be attributed to the biaxial hyperbolic response of α-MoO3 and can be leveraged for polarization optics in the mid-infrared range and efficient light trapping in energy-harvesting and photo-detecting device applications.
DISCUSSION
The homogeneous biaxial hyperbolic vdW α-MoO3 crystal investigated here offers the prospect of planar photonics without the need for complex nanopatterning, which is unavoidable in 2D artificial counterparts. The unique biaxial hyperbolicity can provide an opportunity for controlling the nanoscale interactions in a direction-dependent manner. One example is the control and manipulation of dipole-dipole interactions that are important for photovoltaic and photodetection technologies (32). Previous study using uniaxial hyperbolic h-BN has indicated that, by taking advantage of the broadband hyperbolic dispersion, the nonradiative near fields can be engineered to give long-range dipole-dipole interactions (33). In comparison with the h-BN with uniaxial hyperbolicity, the in-plane permittivity of the biaxial α-MoO3 is highly anisotropic, the interaction ranges between two dipoles orientating along x and y axes should therefore be expected to be different. Such a characteristic can provide more freedom for controlling the dipole-dipole interaction at nanoscale. On the other hand, in principle, the wave vectors of the guided electromagnetic waves that can be attained within α-MoO3 are only limited by the atomic crystalline periodicity; thus, very strong electromagnetic confinement can be reached. In addition, the confinement and manipulation of electromagnetic fields at the nanoscale can be further enriched by introducing sophisticated nanostructures (Fig. 4). Moreover, α-MoO3 is also a semiconductor, which demonstrates the potential for applications of hyperbolic media in active optoelectronic devices because of their excellent electrical transportation characteristics, the tunability of their physical characteristics by external doping, and their high optical-to-electrical conversion efficacy.
Another important potential application we want to mention is the thermal emission manipulation. Because of the high photonic density of states that can be achieved in hyperbolic materials, a broadband super-Planck thermal emission can be realized (34, 35). This effect can pave the way for engineering the thermal emission at nanoscale. The super-Planck thermal emission behavior has been demonstrated using hyperbolic metamaterials, which are consisted of stacked layers of SiC and other dielectric materials. However, one should note that the photonic density of states in these hyperbolic metamaterials is limited by the relatively large size of the structure unit cell. Such a limitation can be overcome by using the natural hyperbolic materials, such as α-MoO3 and h-BN. Because of their atomic-scale unit cells, a much higher photonic density of state can be achieved, which therefore gives rise to a much larger enhancement of the thermal emission. Furthermore, in comparison with the uniaxial hyperbolic h-BN, the unique in-plane hyperbolicity of α-MoO3 can give rise to highly anisotropic photonic density of states at its surface. Therefore, the thermal emission is expected to be dependent on the polarization states. For example, the enhancements of thermal emission should vary for polarizations along [001] and [100] crystalline directions. Such a characteristic can further enrich the manipulation of the thermal radiation at nanoscale.
The biaxial hyperbolic characteristics described in this study can, in principle, be generalized to other types of layered materials with different Reststrahlen bands associated with the three optical axes; thus, a broad range of applications are possible by choosing materials with appropriate hyperbolic bands. Therefore, these results are expected to pave the way toward a new paradigm in manipulating and confining light in planar photonic devices.
MATERIALS AND METHODS
Sample preparation
Growth of the α-MoO3 vdW crystal flakes
The α-MoO3 vdW flakes were synthesized by thermal physical deposition method (36) using a tube furnace. The MoO3 powder with a purity of 99.9% (0.1 g) as source was placed at the center of a quartz tube. The cleaned SiO2 substrate was placed at the low temperature zone 13.0 to 14.5 cm away from the source. The tube was heated up to 780°C in 70 min and then kept at that temperature for 120 min. During the thermal treatment, the MoO3 powder was sublimated and recrystallized onto the low-temperature regions of the SiO2 substrate. Subsequently, the quartz tube was cooled down naturally to room temperature, whereby the α-MoO3 vdW flakes with various thicknesses (tens to hundreds of nanometers) could be found on the SiO2 substrate.
Deposition of the nanoantenna onto the α-MoO3 surface
The high aspect ratio silver nanowires (with a diameter of 50 to 60 nm and length of 2 to 3 μm) were synthesized using the overgrowth method, with the gold nanobipyramids as seeds (37). The longitudinal plasmon resonance frequency of the silver nanoantenna can be precisely tuned by controlling their aspect ratios. In our current study, the plasmon frequency of the silver nanoantenna was ~1000 cm−1. To integrate the nanoantenna onto the α-MoO3 surface, an aqueous solution of the silver nanowires was drop-casted onto the SiO2/Si substrate with randomly distributed α-MoO3 flakes. Various nanoantennas were found on the α-MoO3 surfaces after the droplet was dried naturally under ambient conditions.
Fabrication of the α-MoO3 disk
To fabricate the α-MoO3 disk, we used a 30-keV FIB etching system (AURIGA, Zeiss). The beam diameter was kept at ~10 nm, and the ion current was 5 pA. A piece of 150-nm-thick α-MoO3 flake was chosen. The dose of the Ga3+ beam for the etching was set at 0.6 nC/μm2, with a dwell time of 0.3 μs. After the FIB fabrication, the sample was annealed at 300°C for 2 hours under ambient conditions to eliminate the intercalated Ga3+ inside the α-MoO3, whereby the PhPs characteristics could be recovered.
Near-field optical imaging
The near-field optical measurements were conducted using s-SNOM (NeaSNOM, Neaspec GmbH), which was built on the basis of an atomic force microscope (AFM). The near-field optical distributions of the sample can be mapped simultaneously with its topography. To image the PhPs in real space, a mid-infrared laser (quantum cascade laser, Daylight Solutions) with tunable frequencies from 900 to 1240 cm−1 was focused onto the sample through a metal-coated AFM tip (Arrow-IrPt, NanoWorld). During the measurements, the AFM was operated in tapping mode, where the tip vibrated vertically with a frequency of f = 280 kHz. The back-scattered light from the tip was collected by an MCT detector (HgCdTe, Kolmar Technologies). The near-field signal was extracted by applying the pseudo-heterodyne interferometric method, and the detected signal was demodulated at high harmonic nf (n ≥ 3) of the tip vibration frequency.
PiFM detects localized near-field features of the investigated material as forced oscillations of an AFM cantilever, illuminated with infrared light. PiFM measurements were performed using a commercial Molecular Vista setup equipped with a pulsed quantum cascade laser from Block Engineering, whose emission frequency can be tuned between 795 and 1900 cm−1. The p-polarized light from the laser was focused on a metallic-coated AFM tip (with a resonant frequency of ~300 kHz) operating in tapping mode. The laser was modulated at the frequency difference between the first and second flexural modes (eigenmodes) of the cantilever. The second mechanical eigenmode was used in the AFM feedback loop to control the tip-sample distance, with typical tapping modulation amplitude of 2 nm and typical set point of 85%. The amplitude of the light-induced oscillations of the first cantilever eigenmode was recorded as PiFM signal. PiFM measurements were performed in hyperspectral mode, in which the laser was swept in the 795- to 1000-cm−1 frequency range for each position of the sample scan. The hyperspectral dataset was then elaborated to build PiFM images at single frequency or PiFM hyperspectral movies.
Supplementary Material
Acknowledgments
We thank R. He and W. Xie of Jinan University for providing parts of the α-MoO3 samples. Funding: We acknowledge support from the National Natural Science Foundation of China (grant nos. 51290271, 11474364, and 11874407), the National Key Basic Research Program of China (grant no. 2013CB933601), the National Key Research and Development Program of China (grant no. 2016YFA0203500), the Guangdong Natural Science Funds for Distinguished Young Scholars (grant no. 2014A030306017), Pearl River S&T Nova Program of Guangzhou (grant no. 201610010084), the Guangdong Special Support Program (grant no. 201428004), and the Strategic Priority Research Program of Chinese Academy of Science (grant no. XDB30000000). This work was performed, in part, at the Center for Nanoscale Systems (CNS), a member of the National Nanotechnology Coordinated Infrastructure Network (NNCI), which is supported by the National Science Foundation under NSF award no. 1541959. S.L.O. acknowledges “Fondazione Angelo Della Riccia”, and the program for “International Mobility of Researchers of the University of Naples Federico II” (Italy), for financial support. M.T. acknowledges the support of the Swiss National Science Foundation (SNSF; grant no. 177836). Author contributions: H.C., S.D., and N.X. conceived and initiated the study. Y.J., Y.K., and W.H. performed the sample fabrication. Z.Z., A.A., S.L.O., M.T., and Y.J. performed the experiments and numerical simulations. A.A. and S.L.O. performed the PiFM measurements. F.S. contributed to the dispersion calculations. J.C. contributed to the experiments. H.C., S.D., N.X., A.A., and W.L.W. coordinated and supervised the work and discussed and interpreted the results. H.C. and Z.Z. co-wrote the manuscript with the input of all other co-authors. Competing interests: The authors declare that they have no competing interests. Data and materials availability: All data needed to evaluate the conclusions in the paper are present in the paper and/or the Supplementary Materials. Additional data related to this paper may be requested from the authors.
SUPPLEMENTARY MATERIALS
Supplementary material for this article is available at http://advances.sciencemag.org/cgi/content/full/5/5/eaav8690/DC1
Note S1. Theoretical model for calculating the isofrequency surface of the PhPs
Note S2. Simulation of the dipole-launched PhP waves on the α-MoO3 surface
Note S3. Simulation of the nanoantenna launched PhPs on the α-MoO3
Note S4. Determination of the crystalline direction of a typical α-MoO3 flake
Note S5. Simulation of the s-SNOM image using the phenomenological cavity model
Note S6. Calculations on the complex reflectivity of the multilayer structure α-MoO3/SiO2
Fig. S1. Schematic showing the isofrequency curves of the PhPs in the biaxial α-MoO3 flake.
Fig. S2. Simulations of the dipole-launched hyperbolic PhPs on the α-MoO3 surface.
Fig. S3. Propagation directions of the in-plane hyperbolic PhPs.
Fig. S4. Silver nanoantenna-launched PhPs at various incidence frequencies.
Fig. S5. Determination of the crystalline directions of the α-MoO3 by Raman spectroscopy.
Fig. S6. Near-field optical images showing in-plane anisotropic PhPs characteristics of the α-MoO3.
Fig. S7. Comparison of the experiment and simulation near-field images of the PhPs distributions illuminated by 986 cm−1 (Band 3).
Fig. S8. Scheme of the multi-layered structure consisted of air/α-MoO3/SiO2.
Fig. S9. Optical image of the α-MoO3 flake used for conducting the hyperspectral PiFM movies.
Movie S1. Hyperspectral PiFM movie of the edge perpendicular to the [100] direction, which is adjacent to the corner 1 shown in fig. S9.
Movie S2. Hyperspectral PiFM movie of the edge perpendicular to the [001] direction, which is in proximity of the corner 1 shown in fig. S9.
Table S1. Parameters used in calculating the relative permittivities (Eq. S1).
REFERENCES AND NOTES
- 1.Smith D. R., Schurig D., Electromagnetic wave propagation in media with indefinite permittivity and permeability tensors. Phys. Rev. Lett. 90, 077405 (2003). [DOI] [PubMed] [Google Scholar]
- 2.Poddubny A., Iorsh I., Belov P., Kivshar Y., Hyperbolic metamaterials. Nat. Photonics 7, 958–967 (2013). [Google Scholar]
- 3.Drachev V. P., Podolskiy V. A., Kildishev A. V., Hyperbolic metamaterials: New physics behind a classical problem. Opt. Express 21, 15048–15064 (2013). [DOI] [PubMed] [Google Scholar]
- 4.Kildishev A. V., Boltasseva A., Shalaev V. M., Planar photonics with metasurfaces. Science 339, 1232009 (2013). [DOI] [PubMed] [Google Scholar]
- 5.Yu N., Genevet P., Kats M. A., Aieta F., Tetienne J.-P., Capasso F., Gaburro Z., Light propagation with phase discontinuities: Generalized laws of reflection and refraction. Science 334, 333–337 (2011). [DOI] [PubMed] [Google Scholar]
- 6.Yu N., Capasso F., Flat optics with designer metasurfaces. Nat. Mater. 13, 139–150 (2014). [DOI] [PubMed] [Google Scholar]
- 7.Shelby R. A., Smith D. R., Schultz S., Experimental verification of a negative index of refraction. Science 292, 77–79 (2001). [DOI] [PubMed] [Google Scholar]
- 8.Jacob Z., Smolyaninov I. I., Narimanov E. E., Broadband purcell effect: Radiative decay engineering with metamaterials. Appl. Phys. Lett. 100, 181105 (2012). [Google Scholar]
- 9.Gomez-Diaz J. S., Alù A., Flatland optics with hyperbolic metasurfaces. ACS Photonics 3, 2211–2224 (2016). [Google Scholar]
- 10.Liu Y., Zhang X., Metasurfaces for manipulating surface plasmons. Appl. Phys. Lett. 103, 141101 (2013). [Google Scholar]
- 11.Gjerding M. N., Petersen R., Pedersen T. G., Mortensen N. A., Thygesen K. S., Layered van der Waals crystals with hyperbolic light dispersion. Nat. Commun. 8, 320 (2017). [DOI] [PMC free article] [PubMed] [Google Scholar]
- 12.Li P., Lewin M., Kretinin A. V., Caldwell J. D., Novoselov K. S., Taniguchi T., Watanabe K., Gaussmann F., Taubner T., Hyperbolic phonon-polaritons in boron nitride for near-field optical imaging and focusing. Nat. Commun. 6, 7507 (2015). [DOI] [PMC free article] [PubMed] [Google Scholar]
- 13.Dai S., Fei Z., Ma Q., Rodin A. S., Wagner M., Mcleod A. S., Liu M. K., Gannett W., Regan W., Watanabe K., Taniguchi T., Thiemens M., Dominguez G., Neto A. H. C., Zettl A., Keilmann F., Jarillo-Herrero P., Fogler M. M., Basov D. N., Tunable phonon polaritons in atomically thin van der Waals crystals of boron nitride. Science 343, 1125–1129 (2014). [DOI] [PubMed] [Google Scholar]
- 14.Caldwell J. D., Kretinin A. V., Chen Y. G., Giannini V., Fogler M. M., Francescato Y., Ellis C. T., Tischler J. G., Woods C. R., Giles A. J., Hong M., Watanabe K., Taniguchi T., Maier S. A., Novoselov K. S., Sub-diffractional volume-confined polaritons in the natural hyperbolic material hexagonal boron nitride. Nat. Commun. 5, 5221 (2014). [DOI] [PubMed] [Google Scholar]
- 15.Dai S., Ma Q., Andersen T., Mcleod A. S., Fei Z., Liu M. K., Wagner M., Watanabe K., Taniguchi T., Thiemens M., Keilmann F., Jarillo-Herrero P., Fogler M. M., Basov D. N., Subdiffractional focusing and guiding of polaritonic rays in a natural hyperbolic material. Nat. Commun. 6, 6963 (2015). [DOI] [PMC free article] [PubMed] [Google Scholar]
- 16.Korzeb K., Gajc M., Pawlak D. A., Compendium of natural hyperbolic materials. Opt. Express 23, 25406–25424 (2015). [DOI] [PubMed] [Google Scholar]
- 17.Sun J., Litchinitser N. M., Zhou J., Indefinite by nature: From ultraviolet to terahertz. ACS Photonics 1, 293–303 (2014). [Google Scholar]
- 18.Basov D. N., Fogler M. M., García de Abajo F. J., Polaritons in van der Waals materials. Science 354, aag1992 (2016). [DOI] [PubMed] [Google Scholar]
- 19.Low T., Chaves A., Caldwell J. D., Kumar A., Fang N. X., Avouris P., Heinz T. F., Guinea F., Martin-Moreno L., Koppens F., Polaritons in layered two-dimensional materials. Nat. Mater. 16, 182–194 (2017). [DOI] [PubMed] [Google Scholar]
- 20.Li P., Dolado I., Alfaro-Mozaz F. J., Casanova F., Hueso L. E., Liu S., Edgar J. H., Nikitin A. Y., Velez S., Hillenbrand R., Infrared hyperbolic metasurface based on nanostructured van der Waals materials. Science 359, 892–896 (2018). [DOI] [PubMed] [Google Scholar]
- 21.Zheng Z., Chen J., Wang Y., Wang X., Chen X., Liu P., Xu J., Xie W., Chen H., Deng S., Xu N., Highly confined and tunable hyperbolic phonon polaritons in van der Waals semiconducting transition metal oxides. Adv. Mater. 30, 1705318 (2018). [DOI] [PubMed] [Google Scholar]
- 22.Ma W., Alonso-González P., Li S., Nikitin A. Y., Yuan J., Martín-Sánchez J., Taboada-Gutiérrez J., Amenabar I., Li P., Vélez S., Tollan C., Dai Z., Zhang Y., Sriram S., Kalantar-Zadeh K., Lee S.-T., Hillenbrand R., Bao Q., In-plane anisotropic and ultra-low-loss polaritons in a natural van der Waals crystal. Nature 562, 557–562 (2018). [DOI] [PubMed] [Google Scholar]
- 23.Eda K., Longitudinal-transverse splitting effects in IR absorption spectra of MoO3. J. Solid State Chem. 95, 64–73 (1991). [Google Scholar]
- 24.Py M. A., Schmid P. E., Vallin J. T., Raman scattering and structural properties of MoO3. IL Nuovo Cimento B 38, 271–279 (1977). [Google Scholar]
- 25.Ballantine K. E., Donegan J. F., Eastham P. R., Conical diffraction and the dispersion surface of hyperbolic metamaterials. Phys. Rev. A 90, 013803 (2014). [Google Scholar]
- 26.High A. A., Devlin R. C., Dibos A., Polking M., Wild D. S., Perczel J., de Leon N. P., Lukin M. D., Park H., Visible-frequency hyperbolic metasurface. Nature 522, 192–196 (2015). [DOI] [PubMed] [Google Scholar]
- 27.Ambrosio A., Tamagnone M., Chaudhary K., Jauregui L. A., Kim P., Wilson W. L., Capasso F., Selective excitation and imaging of ultraslow phonon polaritons in thin hexagonal boron nitride crystals. Light Sci. Appl. 7, 27 (2018). [DOI] [PMC free article] [PubMed] [Google Scholar]
- 28.Tamagnone M., Ambrosio A., Chaudhary K., Jauregui L. A., Kim P., Wilson W. L., Capasso F., Ultra-confined mid-infrared resonant phonon polaritons in van der Waals nanostructures. Sci. Adv. 4, eaat7189 (2018). [DOI] [PMC free article] [PubMed] [Google Scholar]
- 29.Zheng Z.-B., Li J.-T., Ma T., Fang H.-L., Ren W.-C., Chen J., She J.-C., Zhang Y., Liu F., Chen H.-J., Deng S.-Z., Xu N.-S., Tailoring of electromagnetic field localizations by two-dimensional graphene nanostructures. Light Sci. Appl. 6, e17057 (2017). [DOI] [PMC free article] [PubMed] [Google Scholar]
- 30.Dai S., Tymchenko M., Yang Y., Ma Q., Pita-Vidal M., Watanabe K., Taniguchi T., Jarillo-Herrero P., Fogler M. M., Alù A., Basov D. N., Manipulation and steering of hyperbolic surface polaritons in hexagonal boron nitride. Adv. Mater. 30, 1706358 (2018). [DOI] [PubMed] [Google Scholar]
- 31.K. Chaudhary, M. Tamagnone, M. Rezaee, D. K. Bediako, A. Ambrosio, P. Kim, F. Capasso, Engineering phonon polaritons in van der Waals heterostructures to enhance in-plane optical anisotropy. arXiv: 1807.03339 (2018). [DOI] [PMC free article] [PubMed]
- 32.Newman W. D., Cortes C. L., Afshar A., Cadien K., Meldrum A., Fedosejevs R., Jacob Z., Observation of long-range dipole-dipole interactions in hyperbolic metamaterials. Sci. Adv. 4, eaar5278 (2018). [DOI] [PMC free article] [PubMed] [Google Scholar]
- 33.Cortes C. L., Jacob Z., Super-Coulombic atom-atom interactions in hyperbolic media. Nat. Commun. 8, 14144 (2017). [DOI] [PMC free article] [PubMed] [Google Scholar]
- 34.Guo Y., Cortes C. L., Molesky S., Jacob Z., Broadband super-Planckian thermal emission from hyperbolic metamaterials. Appl. Phys. Lett. 101, 131106 (2012). [Google Scholar]
- 35.Biehs S.-A., Tschikin M., Messina R., Ben-Abdallah P., Super-Planckian near-field thermal emission with phonon-polaritonic hyperbolic metamaterials. Appl. Phys. Lett. 102, 131106 (2013). [Google Scholar]
- 36.Wang Y., Du X., Wang J., Su M., Wan X., Meng H., Xie W., Xu J., Liu P., Growth of large-scale, large-size, few-layered α-MoO3 on SiO2 and its photoresponse mechanism. ACS Appl. Mater. Interfaces 9, 5543–5549 (2017). [DOI] [PubMed] [Google Scholar]
- 37.Li N., Yin H., Zhuo X., Yang B., Zhu X.-M., Wang J., Infrared-responsive colloidal silver nanorods for surface-enhanced infrared absorption. Adv. Opt. Mater. 6, 1800436 (2018). [Google Scholar]
Associated Data
This section collects any data citations, data availability statements, or supplementary materials included in this article.
Supplementary Materials
Supplementary material for this article is available at http://advances.sciencemag.org/cgi/content/full/5/5/eaav8690/DC1
Note S1. Theoretical model for calculating the isofrequency surface of the PhPs
Note S2. Simulation of the dipole-launched PhP waves on the α-MoO3 surface
Note S3. Simulation of the nanoantenna launched PhPs on the α-MoO3
Note S4. Determination of the crystalline direction of a typical α-MoO3 flake
Note S5. Simulation of the s-SNOM image using the phenomenological cavity model
Note S6. Calculations on the complex reflectivity of the multilayer structure α-MoO3/SiO2
Fig. S1. Schematic showing the isofrequency curves of the PhPs in the biaxial α-MoO3 flake.
Fig. S2. Simulations of the dipole-launched hyperbolic PhPs on the α-MoO3 surface.
Fig. S3. Propagation directions of the in-plane hyperbolic PhPs.
Fig. S4. Silver nanoantenna-launched PhPs at various incidence frequencies.
Fig. S5. Determination of the crystalline directions of the α-MoO3 by Raman spectroscopy.
Fig. S6. Near-field optical images showing in-plane anisotropic PhPs characteristics of the α-MoO3.
Fig. S7. Comparison of the experiment and simulation near-field images of the PhPs distributions illuminated by 986 cm−1 (Band 3).
Fig. S8. Scheme of the multi-layered structure consisted of air/α-MoO3/SiO2.
Fig. S9. Optical image of the α-MoO3 flake used for conducting the hyperspectral PiFM movies.
Movie S1. Hyperspectral PiFM movie of the edge perpendicular to the [100] direction, which is adjacent to the corner 1 shown in fig. S9.
Movie S2. Hyperspectral PiFM movie of the edge perpendicular to the [001] direction, which is in proximity of the corner 1 shown in fig. S9.
Table S1. Parameters used in calculating the relative permittivities (Eq. S1).