

Abstract
Background:
Parents’ attitudes and beliefs in vaccination are important to understand for shaping vaccine acceptance and demand interventions. Little research has focused on developing a validated scale to measure parents’ attitudes towards vaccinations in low and middle-income countries; Ghana provided an opportunity develop a caregiver vaccination attitudes scale (CVAS) validated against childhood vaccine compliance.
Methods:
We conducted a cluster survey of 373 households with children aged 12–35 months of age from Northern Region, Ghana. Caregivers responded to 22 vaccination behavior and belief survey items and provided the child’s vaccination status. In exploratory factor analysis (EFA) to assess CVAS content validity, we used parallel analysis to guide the number of factors to extract and principal axis factor analysis for factor extraction. Reliability of the scale was assessed using McDonald’s Omega coefficient. Criterion validity of scale and subscales was assessed against receipt of vaccinations by 12 months of age and vaccination delay, using number of days undervaccinated.
Results:
EFA of CVAS responses resulted in removing 11 of 22 survey items due to loadings <0.30 and development of a 5-factor structure with subscales for Vaccine-Preventable Disease (VPD) Awareness, Vaccine Benefits, Past Behavior, Vaccine Efficacy and Safety, and Trust. The 5 factors accounted for 69% of the common variance and omega coefficients were >0.73 for all subscales. Validity analysis indicated that for every unit increase in the parent’s scale score, the odds of the child being vaccinated decreased by 0.58 (95% confidence interval [CI]: 0.37,0.68) and the number of days under-vaccinated increased by 86 (95%CI: 28,143). The final 3-factor scale included Vaccine Benefits, Past Behavior, and Vaccine Efficacy and Safety.
Discussion:
The final CVAS included three factors associated with vaccine compliance in Ghana, although several survey items suggested for use in vaccine acceptance scales were dropped. Replicating this study in several country settings will provide additional evidence to assist in refining a tool for use in routine vaccine acceptance and demand surveillance efforts.
Keywords: Vaccine hesitancy, Vaccine acceptance, Ghana, Vaccination delay, Factor analysis
1. Introduction
Globally, childhood vaccination has contributed to a dramatic decline in morbidity and mortality associated with vaccine-preventable diseases (VPD). However, global coverage of the third dose of diphtheria-tetanus-pertussis containing vaccine (DTPcv3) has stalled in recent years, with concerns raised about the role of parents’ beliefs and attitudes about vaccination as a contributor [1–3]. To further drive vaccine acceptance and demand, interest has grown in developing methods to characterize parents’ vaccination beliefs and how they correlate and predict compliance to recommended childhood vaccinations [4,5]. These methods could be used in routine monitoring of specific parental knowledge, beliefs and attitudes about vaccination that are consistently correlated with vaccine compliance and for developing more targeted approaches to address parents’ concerns about vaccination correlated with vaccine compliance, i.e. the child’s vaccination status.
Multiple researchers in high-income country settings have developed psychometric scales designed to measure parents’ attitudes towards vaccination by categorizing attitudes into distinct areas of concern. In the United States and Canada, multiple scales to measure parental concerns about childhood vaccines and adolescent vaccines have been released since 2010, including the Vaccine Confidence Scale (VCS) to assess adolescent vaccination beliefs of US parents and the human papillomavirus (HPV) attitudes and beliefs scale (HABS) to assess HPV vaccination beliefs of Canadian parents [6–10]. In 2011, Opel and colleagues published the Parental Attitudes towards Childhood Vaccination scale (PACV) which has four psychometric domains: beliefs about vaccine safety and efficacy, immunization behavior, attitudes about vaccine mandates, and trust [11,12]. In 2012, the World Health Organization (WHO) convened a vaccine hesitancy working group which subsequently recommended researching and evaluating a series of survey items, largely based on the PACV, to determine if they could be used as the basis for a caregiver vaccine acceptance and demand scale adapted to low and middle-income country settings [4,13]. To properly understand if survey items from scales such as the PACV can be used in new settings, a validation and reliability process should be undertaken to better understand the local parental belief structure about vaccinations and how these relate to vaccine compliance [14]. This validation and reliability process allows for the identification of specific parental attitudes about vaccination (as ascertained by identified survey items) which are consistently and reliably correlated to the child’s vaccination status. To date, few validated and reliable parental attitude about vaccination scales have been developed in low or middle-income country settings [15,16] and none have been developed in African settings, leaving a knowledge gap in validated tools to measure and understand the influence of parents’ vaccination-related attitudes, beliefs and knowledge on childhood vaccination outcomes in these settings. Additional, concern exists that rising numbers of caregivers in Africa may be delaying or refusing recommended vaccinations for their children and few tools to measure this vaccine hesitancy are available [17]. The WHO Strategic Advisory Group of Experts (SAGE) working group on vaccine hesitancy defined vaccine hesitancy as “delay in acceptance or refusal of vaccines despite availability of vaccination services. Vaccine hesitancy is complex and context specific, varying across time, place and vaccines. It is influenced by factors such as complacency, convenience and confidence” [13].
Studies in low- and middle-income country settings have highlighted caregivers’ concerns about vaccination, with variations across geographical and cultural settings. Such concerns include perceptions of harmful effects from vaccination, mistrust in vaccination programs, and fear of potential side effects from vaccination [2]. However, studies have not consistently identified associations between these concerns and the child’s vaccination status, although it is hypothesized that a caregiver’s hesitancy about vaccination can lead to vaccine delay and/or refusal. Creating a valid and reliable tool to monitor, screen and identify parents with concerns about vaccination that lead to vaccine delay and refusal, especially in LMICs, is a critical step for countries seeking to make evidence-based decisions about vaccine acceptance and demand creation strategies. Our objectives for this study were to assess the content validity of a scale designed to measure parents’ attitudes towards vaccination in Ghana, determine scale reliability, and evaluate concurrent criterion validity of the scale through two outcomes: child’s vaccination status by 12 months of age and child’s vaccination delay.
Ghana has had relatively high vaccination coverage (>85%) for infant vaccines since 2007. The country has also been at the forefront of vaccine introductions among African countries, having introduced pneumococcal conjugate vaccine (PCV), rotavirus vaccine, and a second dose of measles-containing vaccine (MCV2) simultaneously in 2012. However, challenges are noted around the timeliness of vaccinations received, with up to 60% of infants receiving delayed vaccinations [18], leading to survey items about the determinants of vaccination delay in Ghana. Additionally, the country has experience challenges with reaching high vaccination coverage for vaccines provided to children in their second year of life [19], with a recent study noting the need to implemented targeted strategies promoting parental behavior change to strengthen coverage of all vaccines recommended in in Ghana, regardless of age. Another study of human papillomavirus (HPV) vaccination uptake in Ghana identified challenges with low perceived risk of disease, role of the parents (as opposed to the provider or government) as the primary decision-makers for vaccination of the child, and parental concern about side effects following vaccination. As part of a multi-partner effort to further improve the Ghana immunization program, particularly for vaccines given beyond one year of age, Ghana Health Service (GHS) recognized the need to tailor its vaccine acceptance and demand promotion activities [19] to ensure both high and timely uptake of all vaccines. This initiative, detailed elsewhere [19], includes special efforts to catch children up on missed vaccines, increase timeliness of all recommended vaccinations, improve social mobilization efforts, tailor healthcare worker and caregiver interpersonal communications, and improve urban immunization strategies. The vaccine acceptance scale construction effort was housed within this multi-partner effort, with specific programmatic objectives of informing the design of future vaccine acceptance and demand promotion activities and evaluating the effect of these activities.
2. Methods
2.1. Scale development: identify measures
We followed a six-step process to develop the validated vaccine acceptance scale (see Fig. 1). In the first step, an initial draft of the scale was collaboratively developed by a multi-agency study team comprised of individuals from the US Centers for Disease Control and Prevention, Emory University, and Ghana Health Service (GHS). To identify the measures for the caregiver vaccine acceptance scale (CVAS) module in Ghana, we conducted a review of existing vaccination attitude scales and recommendations for measuring parental attitudes towards vaccination [4,6,11,12,20–28]. We also developed six de novo survey items based on discussions with immunization professionals who work on vaccine acceptance and demand interventions in African countries. In total, 22 survey items (10 of Likert scale format; 12 of Yes/no/Do not know format) were incorporated into an initial draft of the CVAS module (Table 1). A final iteration of the scale included input from caregiver focus group discussions and final reviews by GHS immunization program focal points.
Fig. 1.
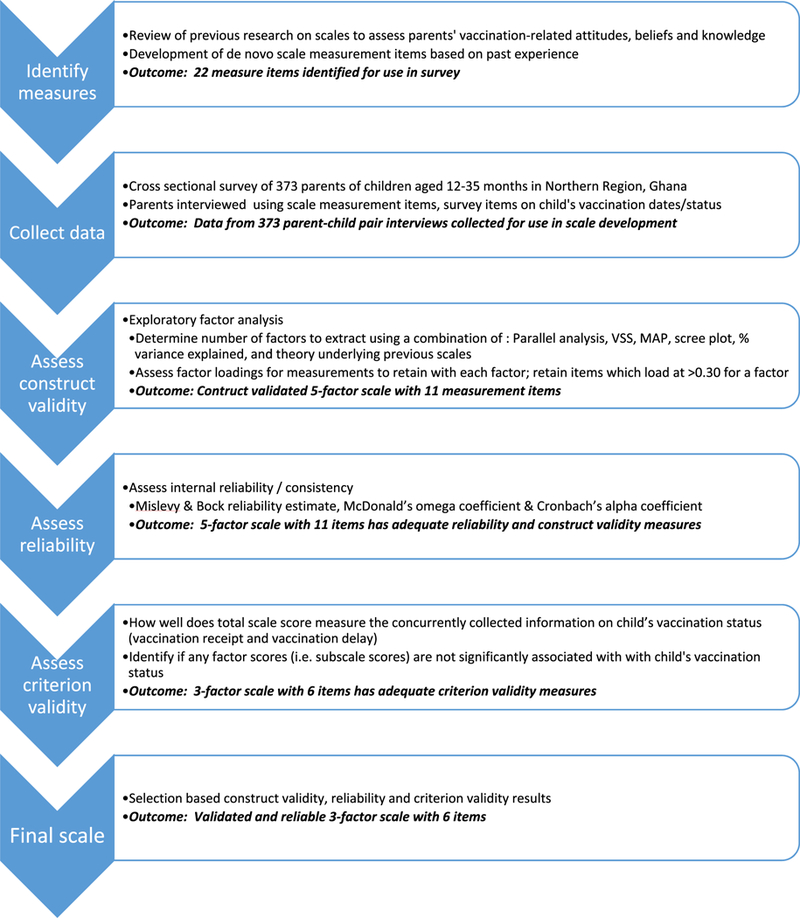
Flowchart of methodology used to develop the caregiver vaccination attitudes scale and key outcomes of each step, Ghana 2017.
Table 1.
Survey items used in the caregiver vaccination attitudes scale module in household survey of parents of children 12–32 months of age, Ghana 2017.
| Survey item | Style | Source |
|---|---|---|
| Children get more vaccinations than are good for them | A/NS/D | [11,22,25,27] |
| Healthy children do not need immunizations | A/NS/D | [11,25]* |
| Vaccination does more good than harm | A/NS/D | [11]* |
| It is better for a child to develop immunity by getting sick than to get a vaccination |
A/NS/D | [11,25,28] |
| A parent should be allowed to selectively choose the vaccines which she believe her child needs |
A/NS/D | [11]* |
| It is better for a child to receive two injectible vaccinations in 1 visit rather than 1 injectible vaccination in 2 visits |
A/NS/D | [11,25] |
| Many of the illness which vaccinations prevent are severe | A/NS/D | [11,22,27] |
| When a parent refuses to vaccinate a child, it harms the entire community through risk of disease |
A/NS/D | New |
| People in this community have expressed concerns that a child might have a serious side effect from a vaccination |
A/NS/D | [11,23]* |
| Following the nationally recommended vaccination schedule is a good idea for a child |
A/NS/D | [11]* |
| If the national immunization policy states that 2 injectable vaccines should be given in the same arm/leg would you allow it? |
Y/DK/N | New |
| I believe vaccines are safe | Y/DK/N | [26] |
| I believe vaccines protect my child from vaccine preventable disease. |
Y/DK/N | [26] |
| Have you personally seen someone with either polio, pneumonia, measles or whooping cough? |
Y/DK/N | New |
| Do you know of someone in your family or community who had either polio,pneumonia, measles or whooping cough? |
Y/DK/N | New |
| Have you ever delayed having your child get a vaccination for reasons other than illness or allergy? |
Y/DK/N | [11,20] |
| Have you ever decided not to have your child get a vaccination for reasons other than illness or allergy? |
Y/DK/N | [11,20] |
| If you had another infant today, would you want your infant to get all recommended vaccinations? |
Y/DK/N | [11,20] |
| Do you know the location where you can have your child vaccinated? |
Y/DK/N | New |
| Do you know the days and times when vaccination services are offered in your community? |
Y/DK/N | New |
| Are you able to discuss any concerns you have about vaccinations with your child’s healthcare provider? |
Y/DK/N | [11,21,22,24] |
| Do you trust the information that you receive from your local healthcare worker about vaccinations? |
Y/DK/N | [11,21,24] |
A/NS/D = Agree/Not sure/disagree; Y/DK/N = Yes/do not know/no.
Indicates the source survey item text was modified from original source for the Ghana scale.
The final 22 survey items included topics specific to caregiver perceptions of the combined benefits and drawbacks of vaccination, beliefs about illness versus vaccination, attitudes towards receipt of multiple injectable vaccinations in the same vaccination visit, community norms about vaccination, awareness and perceptions of vaccine safety, past experiences with vaccine-preventable diseases and vaccination services, and trust in the healthcare system (Table 1). Among the 14 survey items adapted from the PACV, the PACV domains covered included “beliefs about vaccine safety and efficacy”, ‘‘immunization behavior’, and ‘‘trust”.
2.2. Data collection: survey design and participants
To collect CVAS module data, we designed and implemented a cross-sectional, household-based survey in Northern Region, Ghana. The primary intent of the survey was to estimate regional vaccination coverage as part of a multi-partner initiative to improve the coverage of childhood vaccinations in Ghana and is detailed elsewhere [19]; we incorporated our CVAS module into this survey. For the survey, we randomly selected 37 enumeration areas by probability proportional to size (PPS) sampling and then aimed to randomly select 10 households with children aged 12–35 months within each enumeration area. The sampling yielded 373 households for assessment of the child’s vaccination history, sociodemographic characteristics, and parent’s vaccination beliefs via the CVAS module. All households completed the CVAS module. The protocol was approved by the Ghana Health Services ethics review board, the CDC Human Subjects Office, and the Emory University Institutional Review Board.
2.3. Scale development: construct validity assessment
To evaluate construct validity, we used exploratory factor analysis (EFA) to analyze the Ghana dataset. Complete methodologic details for construct validity assessment are provided in the supplementary materials. In brief, in EFA, we used principal axis factor extraction (PAF) with a polychoric dispersion matrix, as this is recommended for analyzing ordinal data collected via Likert-type scales or variables that have few categories such as dichotomous items [29,30]. For factor rotations, we used promax, an oblique rotation, since we hypothesized some correlation between factors [31]. Exploratory factor analysis and reliability assessment were analyzed using a combination of the R psych package, MPlus 8, and FACTOR 10 software [32,33].
To determine the number of factors to extract, we used parallel analysis, very simple structure, scree plots, and proportion of variance explained methods. The final selection of number of factors to extract was based on review of the results from the latter methods alongside theoretical coherence of factors and simplicity of the factor loadings. Bentler’s simplicity index and the loading simplicity index were used to assess the level of factor loading simplicity, essentially a measure of how well each item loads onto a single factor versus multiple factors. To determine which items loaded onto each factor, we used a cutoff of 0.30. We tested the goodness of fit of the explanatory model using goodness of fit index (GFI), which ranges between 0 and 1, with values in excess of 0.9 considered an indication of adequate model fit.
2.4. Reliability assessment
To assess reliability/internal consistency of the derived factor solution, we examined Cronbach’s coefficient alpha and McDonald’s omega statistic. The omega statistic is preferable to use for skewed data and has been shown to be more robust than the alpha statistic for measuring closer to true reliability in these situations [34]. Additionally, the alpha statistic assumes equal factor loadings across items loading onto a factor to properly estimate the true reliability; if this is not the case, then alpha will underestimate reliability [35]. We also examined the Mislevy & Bock reliability estimate; further details provided in the supplemental materials.
2.5. Criterion validity assessment: vaccination outcomes
After the construct validity and reliability assessment steps yielded an initial version of a scale, single factor scale scores and an overall multi-factor scale score were calculated for each surveyed parent. A response for each survey item included in the scale was scored as either a 0 (non-hesitant response), 1 (partially hesitant response), or 2 (hesitant response). Survey items, which were negatively framed, were converted to the same direction scoring-wise as items that were positively framed. For instance, the “Agree” response for the negatively worded item “Healthy children do not need immunizations” was scored as a ‘‘2”, whereas the “Disagree” response for the positively worded survey item ‘‘When a parent refuses to vaccinate a child, it harms the entire community through risk of disease” was also scored as a ‘‘2”. Next, a parent’s responses to the survey items within a single factor were averaged to calculate the parent’s single factor scale score; this was done for each single factor scale include within the overall scale. Last, a parent’s total scale score was calculated by summing the parent’s separate single-factor scale scores together. The scale score was constructed so that the lowest scores were considered the least hesitant parents and the highest scores were the most hesitant parents.
To evaluate the relationship between parental attitudes and childhood vaccination outcomes, we used separate regression models to assess the association between the mean scale score and two separate outcomes: vaccination by 12 months of age and vaccination delay up to 12 months of age. As indicated earlier, both vaccination receipt and vaccination delay are seen as key outcome measures associated with caregiver vaccine hesitancy and both outcomes have been used in the development of previous vaccine acceptance scales such as the PACV [9,11–13,36]. We used generalized estimating equation (GEE) models with a logit-link function to examine the association between the parental attitudes scale score (main exposure) and vaccination status as a dichotomous outcome (receipt of all vaccines recommended under 12 months of age, based on review of the child’s card or caregiver’s recall of vaccinations when the card was unavailable), as well as for receipt of measles-containing vaccine 1st dose (MCV1) and DTPcv3 vaccines separately.
We used GEE models to examine vaccination delay as a continuous outcome for the combined series of MCV1, DTPcv 3-dose series, oral polio vaccine 3-dose series, rotavirus vaccine 2-dose series and pneumococcal conjugate vaccine 3-dose series, as well as for MCV1 and DTPcv3 vaccinations alone. Vaccination delay was defined as number of days under-vaccinated, per the method developed by Luman [37] and described in detail in supplementary materials. In brief, the number of days under-vaccinated was calculated by determining the age at which a child received each examined vaccine dose and comparing it to the recommended age (in days) based on the 2014–2016 Ghana vaccination schedule, accounting for minimum dose intervals and minimum eligible age (supplemental Table S1).
To explore the influence of each scale factor, we re-ran the non-vaccination and vaccination delay outcome models using each factor. Models controlled for the following demographic factors that prior research indicates are associated with under-vaccination in Ghana and elsewhere: mother’s age, mother’s education level, child’s gender, and child’s birth order [38]. Due to the clustered survey design, we accounted for the primary sampling unit as a repeated effect in the GEE models. In our modeling analyses conducted using SAS 9.3, we report the frequencies, means, percentages and odds ratios with 95% confidence intervals.
3. Results
3.1. Sample characteristics
There were 373 parent-child pairs surveyed. Detailed descriptive results are found in the supplementary materials. In brief, among caregivers, 371 (99%) indicated receipt of at least 1 vaccination for the child and 353 (95%) of children had vaccination cards (Supplemental Table S2). For analysis of vaccination delay, multiple records were excluded due to lack of sufficient information on vaccination dates (missing day, month, and/or year data). Of the 373 records, 279 (75%) were usable for the vaccination delay analysis across all vaccine doses, 344 records (92%) for DTPcv3 vaccination delay, and 353 (95%) for MCV1 vaccination delay.
Children of mothers who did not attend school were less likely than children of mothers with primary or secondary educational attainment to receive DTPcv3 vaccination (88% versus 92% and 98%, respectively). Similarly, children of parents following a Traditionalist religion were less likely than Christian and Muslims to have received DTPcv3 vaccination (81% versus 92% and 90%, respectively). Firstborn children were slightly more likely to have received DTPcv3 versus later-born children (93% versus 90%), as were female children compared to male children (93% versus 88%).
3.2. Scale survey item descriptive results
Among interviewed caregivers, 20% indicated they had seen an individual with either polio, pneumonia, measles or whooping cough and 13% knew of someone in their family or community who had one of the latter diseases. Nearly all (99%) knew the location of vaccination and days/times of vaccination (94%) (Supplemental Table S3). Nearly all believed vaccines to be safe (97%), although 22% indicated that people in their community had expressed concerns possible side effects from vaccination. Although nearly all (97%) believed that following a nationally recommended vaccination schedule is a good idea and 96% would want to have any future children get all recommended vaccinations, 22% and 15% had indicated either ever delaying or ever deciding not to have a child receive a vaccination for reasons other than illness or allergy. A sizeable minority (23%) believed that healthy children did not need immunizations and expressed concerns about the number of vaccinations provided; with 41% agreeing that children get more vaccinations than are good for them and 23% disagreeing that children should get two injectable vaccinations in one visit rather than one per visit. Further descriptive details are provided in the supplemental materials.
3.3. Factor analysis
The distribution of scale items was examined visually using histograms and multivariate tests for skewness and kurtosis were conducted. One variable was dropped due to lack of sufficient data for each response category. There was evidence of asymmetry: values for skewness were >|1| for 14 items, and excess kurtosis was found for 16 items. The multivariate test of skewness was not statistically significant (p = 1.00), but the test of kurtosis was significant (P< 0.0001), further indicating the need to use a polychoric correlation matrix for EFA. Sampling adequacy tests indicated suitability of the data for EFA as the KMO measure of sampling adequacy was 0.58 and Bartlett’s test of sphericity was statistically significant (X2 = 749.9, P < 0.0001).
The results from parallel analysis using MRFA extraction and polychoric correlation suggested extraction of six factors from the dataset. Very simple structure analysis, using PAF extraction, polychoric correlation and promax rotation all suggested extraction of five factors. Visual assessment of the scree plot suggested extraction of between four and six factors, and the Kaiser Criterion method resulted in three eigenvalues above 1.00, indicating suggested extraction of three factors. We chose to run EFA with models that had four, five and six factors extracted.
The 5-factor model included 11 items, with two loadings per factor for all except the fifth which had three items load greater than 0.30 (Table 2). The 4-factor model included the same first four factors and same eight items loading onto each factor. A 6-factor model included a factor where only one item loaded greater than 0.30. Based on the items that loaded onto each factor in the 5-factor model, we chose to name the factors as: VPD Awareness, Vaccine Benefits, Past Behavior, Efficacy and Safety, and Trust. The 4-factor model excluded the Trust factor.
Table 2.
Factor loadings and reliability measures for development of 5-factor scale version of the caregiver vaccine acceptance scale, Ghana 2017.
| Standardized factor loading | ||||||
|---|---|---|---|---|---|---|
| Item | Item mean (SD) | VPD Awareness | Benefits | Past Behavior | Efficacy and Safety | Trust |
| Have you personally seen someone with either | 1.58 (0.04) | 0.93 | ||||
| polio, pneumonia, measles or whooping cough? | ||||||
| Do you know of someone in your family or | 1.71 (0.04) | 0.93 | ||||
| community who had either polio, pneumonia, | ||||||
| measles or whooping cough? | ||||||
| I believe vaccines are safe | 0.03 (0.01) | 0.93 | ||||
| I believe vaccines protect my child from vaccine | 0.03 (0.01) | 0.95 | ||||
| preventable disease. | ||||||
| Have you ever delayed having your child get a | 0.48 (0.04) | 0.89 | ||||
| vaccination for reasons other than illness or | ||||||
| allergy? | ||||||
| Have you ever decided not to have your child get a | 0.32 (0.04) | 0.78 | ||||
| vaccination for reasons other than illness or | ||||||
| allergy? | ||||||
| Vaccination does more good than harm | 0.24 (0.03) | 0.85 | ||||
| Many of the illnesses which vaccination prevent are | 0.19 (0.02) | 0.45 | ||||
| severe | ||||||
| If you had another infant today would you want | 0.07 (0.02) | 0.55 | ||||
| your infant to get all recommended | ||||||
| vaccinations? | ||||||
| Do you trust the information that you receive from | 0.05 (0.01) | 0.54 | ||||
| your healthcare worker about vaccinations? | ||||||
| Following the nationally recommended vaccination | 0.04 (0.01) | 0.66 | ||||
| schedule is a good idea for my child | ||||||
| Omega coefficient | 0.94 | 0.99 | 0.86 | 0.92 | 0.78 | |
| Alpha coefficient | 0.78 | 0.87 | 0.64 | 0.54 | 0.41 | |
| Mislevy & Bock reliability | 0.90 | 0.94 | 0.85 | 0.80 | 0.73 | |
Factor loadings <0.30 not shown and items which failed to load onto any of the five factors not listed in table.
Definitions: SD: standard deviation; VPD: vaccine-preventable disease.
3.4. Model fit, simplicity and reliability
The goodness of fit index value of 0.90 for the selected 5-factor model indicated an acceptable model fit. Bentler’s simplicity index value (0.96) and loading simplicity index (0.93) both indicated the 5-factor model to be an acceptable structural solution.
Mislevy and Bock reliability estimates for all five factors were >0.73; the factor, or subscale, with the lowest reliability was trust (Table 2). McDonald’s omega coefficients showed similar values, all >0.78. Cronbach’s alpha coefficients were >0.60 for the VPD Awareness, Vaccine Benefits and Past Behavior subscales; the coefficient for Efficacy and Safety was 0.54 and for Trust was 0.41. Dropping any items from the Trust subscale failed to improve any internal reliability measures.
3.5. Criterion validation analysis: vaccination receipt
A one-point increase in a caregiver’s full scale score was associated with an odds ratio of 0.58 (95% confidence interval [Cl]: 0.41, 0.80) for the odds of a child receiving a DTPcv3 vaccination, indicating decreased likelihood of DTPcv3 vaccination as a caregiver’s full scale score increased (Table 3, Fig. S3). In separate analysis of each subscale, the Benefits domain showed the strongest association (odds ratio [OR]: 0.09; 95% CI: 0.02,0.39) whereas VPD Awareness showed the weakest association (OR: 0.94; 95% CI: 0.54,1.64) with DTPcv3 vaccination. Trust also showed a null association, even though the OR point estimate was far from the null (OR: 0.43; 95% CI: 0.07, 2.38). Receipt of MCV1 and of all vaccines showed similar patterns as those reported for DTPcv3 receipt (Supplemental Table S4). Four-factor and three-factor scales, which did not include the VPD Awareness domain (dropped in both) or the Trust domain (dropped in 3-factor scale only) showed stronger associations with the odds of receipt of each assessed vaccination outcome compared to the 5-factor scale (Table 3).
Table 3.
Association of caregiver vaccination acceptance scale score and subscale scores with child’s receipt of listed vaccination(s); cross-sectional survey in Northern Region, Ghana, 2017.
| Vaccine(s) | Received | n(%) | Complete scale (11 items) |
Factor subscale |
||||
|---|---|---|---|---|---|---|---|---|
| OR (95% CI) | VPD Awareness (2 items) OR (95% CI) |
Benefits (2 items) OR (95% CI) |
Past Behavior (2 items) OR (95% CI) |
Efficacy and Safety (2 items) OR (95% CI) |
Trust (3 items) OR (95% CI) |
|||
| All vaccines1 (n = 373) | Yes | 299(80%) | 0.56 (0.43, 0.72) | 0.77 (0.50, 1.18) | 0.16 (0.04, 0.64) | 0.64 (0.45, 0.92) | 0.32 (0.19, 0.55) | 0.69 (0.15, 3.22) |
| No | 74 (20%) | Ref. | Ref. | Ref. | Ref. | Ref. | Ref. | |
| DTPcv32 (n = 373) | Yes | 337 (90%) | 0.58 (0.41, 0.80) | 0.94 (0.54, 1.64) | 0.09 (0.02, 0.39) | 0.65 (0.40, 1.04) | 0.34(0.17,0.66) | 0.43 (0.07, 2.38) |
| No | 36 (10%) | Ref. | Ref. | Ref. | Ref. | Ref. | Ref. | |
| MCV13 (n = 373) | Yes | 316(85%) | 0.50 (0.37, 0.68) | 0.98 (0.62, 1.55) | 0.12 (0.03, 0.50) | 0.50 (0.33, 0.75) | 0.32 (0.18, 0.58) | 0.43 (0.09, 1.93) |
| No | 57(15%) | Ref. | Ref. | Ref. | Ref. | Ref. | Ref. | |
Definitions:
All vaccines includes 3-dose oral polio vaccine series, 3-dose pentavalent vaccine series, 3-dose pneumococcal vaccine series, 2-dose rotavirus vaccine series and 1st dose of measles-containing vaccine.
DTPcv3 = 3rd dose of the diphtheria, tetanus, pertussis containing vaccine series.
MCV1 = 1st dose of the measles-containing vaccine.
OR = odds ratio. Cl = confidence interval. VPD = vaccine-preventable disease. Ref. = reference level for the given measure of association.
3.6. Criterion validation analysis: vaccination delay
For every 1 point gain in a caregiver’s complete scale score, children were 11.1 (95% CI: 3.7, 18.4) more days under-vaccinated for DTPcv3 compared to children who received a timely DTPcv3 vaccination (Table 4, Fig. S4). In separate analysis of each subscale, the Benefits domain showed the strongest association (101.0 days undervaccinated; 95% CI: 51.3, 150.6) whereas VPD Awareness showed the weakest association (–1.0 days undervaccinated; 95% CI: –12.9,10.8). Past Behavior and Trust also showed a null association. For every 1 point gain in the caregiver’s complete scale score, children were 5.6 (95% CI: 2.2, 8.9) more days undervaccinated for MCV1 compared to children who received timely MCV1 vaccination (Supplemental Table S5). Separate subscale analyses indicated association between days undervaccinated for MCV1 and VPD Awareness. Days undervaccinated for all vaccines showed associations with the Vaccine Benefits, Past Behavior and Efficacy and Safety domains and null associations for VPD Awareness and Trust.
Table 4.
Association of caregiver vaccination acceptance scale score and subscale scores with child’s delay in vaccinations received as measured by days undervaccinated through 12 months of age, Ghana 2017.
| Vaccines | Delayed n(%) |
Mean days under- vaccinated4 (95% CI) |
Beta coefficient: days undervaccinated (95% CI) |
|||||
|---|---|---|---|---|---|---|---|---|
| Complete scale | VPD Awareness (2 items) |
Benefits (2 items) |
Past Behavior (2 items) |
Efficacy and Safety (2 items) |
Trust (3 items) |
|||
| All vaccines1 (n = 279) | 262(94%) | 382.4 | 85.5 | 12.0 | 1230.9 | 116.0 | 214.7 | 303.3 |
| (294.7, 468.1) | (28.2, 142.8) | (–103.3,127.4) | (768.4, 1693.3) | (0.1, 232.2) | (46.2, 383.1) | (–174.8, 781.5) | ||
| DTPcv32 (n = 344) | 113(33%) | 110.6 | 11.1 | –1.0 | 101.0 | 7.0 | 23.4 | 31.2 |
| (91.9, 129.4) | (3.7, 18.4) | (–12.9, 10.8) | (51.3, 150.6) | (–5.1, 19.0) | (5.3, 41.4) | (–16.3, 78.7) | ||
| MCV13 (n = 353) | 314 (89%) | 51.3 | 5.6 | 6.5 | 19.1 | 4.6 | 4.1 | –11.4 |
| (47.7, 54.8) | (2.2, 8.9) | (1.3, 11.7) | (–3.3, 41.5) | (–0.5, 9.8) | (–3.9, 12.1) | (–32.7, 9.9) | ||
Definitions:
All vaccines includes 3-dose oral polio vaccine series, 3-dose pentavalent vaccine series, 3-dose pneumococcal vaccine series, 2-dose rotavirus vaccine series and 1st dose of measles-containing vaccine.
DTPcv3 = 3rd dose of the diphtheria, tetanus, pertussis containing vaccine series.
MCV1 = 1st dose of the measles-containing vaccine.
Days undervaccinated calculated only among the proportion who were delayed, as the number of days a child had not received the given vaccine(s) after the end of the buffer period that determines a timely vaccination, using the 2016 Ghana vaccination schedule for recommended age of vaccination, with a 30-day buffer period after that age.
Cl = confidence interval. VPD = vaccine-preventable disease.
3.7. Characteristics of recommended scale
The 3-factor scale with six items that included Benefits, Past Behavior, and Vaccine Efficacy and Safety domains showed the most consistency in terms of significance of subscale associations with assessed vaccination outcomes (Tables S3 and S4). Mislevy and Bock reliability estimates and omega coefficients were >0.80 for the three factors in this scale and factor loadings were ≥0.45 for all six items.
4. Discussion
In our study of Ghanaian parents of children aged 12–35 months, we were able to develop a contextually valid and internally reliable scale for parental attitudes and beliefs towards vaccination and this scale score was highly associated with the child’s vaccination status and number of days undervaccinated. The psychometric domain, Vaccine Benefits, showed a strong association with the two evaluated vaccination outcome indicators, and could be the basis for a short-form (single factor) scale. We identified one new domain not seen in previous scales, VPD Awareness, which may be unique to settings where VPDs are still commonly seen in the community; however, it was not associated with most vaccination outcome indicators. Several items proposed used in other high-income country-based scales failed to load onto any factors in this setting, but replicating such research will help further inform recommendations for use of these items.
In comparison to other scales for assessing parental attitudes towards childhood vaccination, four out of five of the CVAS domains showed similarities with the domain structures of the vaccine confidence scale (VCS) and the parental attitudes towards childhood vaccines scale (PACV). The VCS was developed using existing behavioral survey items inserted into the US national immunization survey, whereas the PACV was developed from review of previous parent attitude and belief surveys in the US and then through data collected from a convenience survey in Seattle, Washington. The two items in the CVAS beliefs domain closely overlap two of the items that comprise the beliefs domain in the vaccine confidence scale (VCS), although one of the items in the CVAS vaccine efficacy and safety domain is also listed in the beliefs domain of the VCS [6,26]. The two items in the CVAS vaccine efficacy and safety domain are derived from the same domain found in the PACV scale [36]. In our scale, we did face challenges in naming the Vaccine Benefits domain and the Efficacy and Safety domain as the items within each generally appear to overlap from a wording perspective. However, we chose not to eliminate either domain or merge them as none of our factor analyses indicated that these items all loaded onto the same factor. Additionally, from a wording perspective, key differences exist, as both items in the Vaccine Benefits domain start with “I believe...” and were Yes/No/Don’t know formats, whereas the two items in the Efficacy and Safety domain were statements using a Likert scale format. Lastly, our two VPD Awareness domain items are de novo, although they have overlap to items in the threats domain of a Canada-based HPV attitudes and beliefs scale [10].
Our findings in Ghana reflect both similarities and differences in scales developed in the United States (US). Our overall scale score was associated with both child’s vaccination receipt and vaccination delay, while three of five factors were consistently associated with both of receipt and delay. In the PACV study, originally developed in an urban setting of the US, the overall scale was also associated with vaccination delay [12], although, in an adapted version of the PACV for adolescent vaccinations in the United States, the two-domain scale score was not associated with vaccination receipt [9]. Analyses of the vaccine confidence scale (VCS), also developed in the US, indicated that the overall score was associated with vaccination receipt, but only one of the three VCS domains was associated with delay [26,39]. Similar to our finding in Ghana that the Trust domain was not associated with vaccination outcomes, the VCS also reported that the Trust domain was not associated with vaccination refusal, status or delay in a US-based population [39]. In our Ghana study, the lack of a strong relationship between the Trust domain and the immunization outcomes was surprising, considering that the Trust domain is described as a core component of caregiver vaccine confidence, defined by the WHO vaccine hesitancy working group as: “trust in vaccine safety, the system that delivers vaccines, and the policymakers who recommend vaccinations” [40]. In our Ghana survey, nearly all participants stated high levels of trust in healthcare providers and government-recommended vaccination schedule, per responses to our Trust domain survey items. We hypothesize that the weak relationship in our Ghana survey results could be due to either the selection of Trust survey items that failed to sufficiently dichotomize between low trust and high trust individuals or to the Trust being so universally high that it failed to be a key hurdle to vaccine compliance in this high compliance population. Future research on the latter hypothesis would help with better understanding this situation.
The identification of the VPD Awareness domain in our Ghana scale was unique from previously published scales developed in high-income country settings and this may be due, in part, to the different context within which we developed this scale compared to these previously developed scales. Both items in this domain ask about a caregiver’s experience with VPDs; we developed these items on the basis of the availability heuristic, which is used in the context of vaccinations to describe how a caregiver perceives the probability of a vaccine-preventable infection based upon the availability/ease of recalling relevant past examples [41]. In Ghana, however, because vaccination coverage has been high for several years, most VPDs are relatively uncommon. Future research may consider including similar VPD Awareness items to assess their criterion validity in settings with higher VPD burden. The differences in scale structure, such as the VPD awareness domain, for Ghana compared to scales developed in previous high-income country settings indicate the importance of implementing a scale development process in settings that one considers to be quite different from the settings where similar scales have been developed [14,42]. By identifying the importance of the VPD awareness domain in Ghana, which would not have been identified if previously developed scales such as the PACV were directly used illustrates the importance of this tailored scale development work, rather than using an existing scale which would not have identified the existence and importance of this factor. The GHS immunization program team is able to make use of these findings in a variety of ways.
The planned use of the validated scale in Ghana provides an example of its practical applications from the viewpoint of an immunization program manager. The identification of specific parental attitudes about vaccination that were and were not correlated with vaccine compliance is being used in the planning for tailored health worker trainings designed to improve vaccine acceptance and demand in low-coverage areas of the country. These trainings focused on methods to improve interpersonal communications between the healthcare provider and the caregiver; thus the specific communication topics covered in the trainings were tailored towards the findings from the scale around addressing caregivers’ concerns about vaccine safety, their perceptions of the efficacy of vaccination, and understanding how previous vaccination and vaccine-preventable disease experiences can play a role in how caregivers perceive the importance of childhood vaccination. Additionally, the validated scale will be used as an evaluation tool for a series of vaccine acceptance and demand promotion activities designed to improve caregiver attitudes towards vaccination. Specifically, in the evaluation of these vaccine acceptance and demand promotion activities, parents will be surveyed before and after activity implementation to calculate pre and post-scale scores for parents and pre-post scale score differences will be examined for statistical significance using regression modeling techniques. Lastly, in future household health surveys, the scale will be incorporated to allow for measuring these caregiver attitudes that have shown consistent correlations with vaccine compliance in Ghana, thus providing an opportunity to assess attitude trends over time.
Replicating scale development in other settings is highly desirable to ensure a fuller picture of how such scales may need to vary in domain structure and item specification. Generally, when a scale is used in a population that differs from the one where it was initially validated, then both the validity and reliability should be checked again to ensure it maintains its psychometric properties [14,42]. In particular the use of the scale in a new setting will likely include translation to a new language, which can alter the psychometric qualities of the scale [14,42]. This process of scale assessment in a new setting can use other methods beyond EFA, including confirmatory factor analysis, item response theory, or related methodologies to examine scale validity and reliability to re-examine the psychometric properties. The psychometric differences that emerge across scales validated in different settings can provide important methodological conclusions (i.e. it may not be feasible to use a single scale across countries). In Ghana, for instance, we developed our scale by starting with survey items derived from scales used in high-income countries or suggested for global use [4]. However, a systematic review of studies conducted to assess caregiver attitudes and beliefs towards vaccination in LMICs would be useful to generate a new listing of possible scale items. Additionally, future research should incorporate a prospective study whereby the predictive criterion validity of this scale is assessed. After further validation, consideration may be given for incorporating the scale into routine local household surveys to allow for ongoing vaccine hesitancy surveillance.
Our study is subject to limitations. The survey was cross-sectional, so information for the scale and for vaccination status was collected at the same time; thus our criterion validity was limited to concurrent rather than predictive validity. Our sample size was sufficient for EFA, but we could not split the sample into two sets to also do confirmatory factor analysis, which could have further strengthened our results. For the vaccination status outcome, we did incorporate both card-based and caregiver recall information so we could utilize the entire dataset, and caregiver recall could have resulted in some misclassification of vaccination status. However, card retention was very high (data for only 20/373 children relied on recall-based information) and in a sub-analysis, vaccination status of children with only recall-based information did not differ from children with card-based information. Lastly, we originally planned to use a 5-level Likert scale for Likert-formatted survey items which could have provided more precision on agreement level for respondents. However in a formative evaluation of these survey items in Ghana and similar settings, respondents generally found 5-level Likert items to be difficult to understand, compared to the 3-level design.
Understanding the caregivers’ beliefs and attitudes that drive acceptance of childhood vaccination is critical for the success of any immunization program. Our study is the first to document development of a valid and reliable scale to assess caregiver attitudes and beliefs towards vaccination in a low- or middle- income country setting and show a high level of association of the scale score with child’s vaccination status. Continued development of these types of tools is increasingly important for both understanding and monitoring vaccine confidence trends, and facilitating effective response, so that the greatest number of children receive the benefits from vaccination.
Supplementary Material
Acknowledgement
This study was funded by the United States Centers for Disease Control and Prevention.
Footnotes
Appendix A. Supplementary material
Supplementary data to this article can be found online at https://doi.Org/10.1016/j.vaccine.2018.12.055.
Conflict of interest
The authors declare that they have no known competing financial interests or personal relationships that could have appeared to influence the work reported in this paper.
References
- [1].Salmon DA, Dudley MZ, Glanz JM, Omer SB. Vaccine hesitancy: causes, consequences, and a call to action. Vaccine 2015;33:D66–71. [DOI] [PubMed] [Google Scholar]
- [2].Muñoz DC, Llamas LM, Bosch-Capblanch X. Exposing concerns about vaccination in low-and middle-income countries: a systematic review. Int J Public Health 2015;60(7):767–80. [DOI] [PubMed] [Google Scholar]
- [3].Larson HJ, Jarrett C, Eckersberger E, Smith DM, Paterson P. Understanding vaccine hesitancy around vaccines and vaccination from a global perspective: a systematic review of published literature, 2007–2012. Vaccine 2014;32 (19):2150–9. [DOI] [PubMed] [Google Scholar]
- [4].Larson HJ, Jarrett C, Schulz WS, Chaudhuri M, Zhou Y, Dube E, et al. Measuring vaccine hesitancy: the development of a survey tool. Vaccine 2015;33 (34):4165–75. [DOI] [PubMed] [Google Scholar]
- [5].Larson HJ, Schulz WS, Tucker JD, Smith DM. Measuring vaccine confidence: introducing a global vaccine confidence index. PLOS Curr: Outbreaks 2015. [DOI] [PMC free article] [PubMed] [Google Scholar]
- [6].Gilkey MB, Magnus BE, Reiter PL, McRee A-L, Dempsey AF, Brewer NT. The Vaccination Confidence Scale: a brief measure of parents’ vaccination beliefs. Vaccine 2014;32(47):6259–65. [DOI] [PMC free article] [PubMed] [Google Scholar]
- [7].Thomas TL, Strickland OL, DiClemente R, Higgins M, Williams B, Hickey K. Parental Human Papillomavirus Vaccine Survey (PHPVS): nurse-led instrument development and psychometric testing for use in research and primary care screening. J Nurs Meas 2013;21(1):96. [DOI] [PMC free article] [PubMed] [Google Scholar]
- [8].McRee A-L, Brewer NT, Reiter PL, Gottlieb Sl, Smith JS. The Carolina HPV Immunization Attitudes and Beliefs Scale (CHIAS): scale development and associations with intentions to vaccinate. Sex Transm Dis 2010;37(4):234–9. [DOI] [PubMed] [Google Scholar]
- [9].Roberts JR, Thompson D, Rogacki B, Hale JJ, Jacobson RM, Opel DJ, et al. Vaccine hesitancy among parents of adolescents and its association with vaccine uptake. Vaccine 2015;33(14):1748–55. [DOI] [PMC free article] [PubMed] [Google Scholar]
- [10].Perez S, Shapiro GK, Tatar O, Joyal-Desmarais K, Rosberger Z. Development and validation of the human papillomavirus attitudes and beliefs scale in a national Canadian sample. Sex Transm Dis 2016;43(10):626–32. [DOI] [PubMed] [Google Scholar]
- [11].Opel DJ, Mangione-Smith R, Taylor JA, Korfiatis C, Wiese C, Catz S, et al. Development of a survey to identify vaccine-hesitant parents: the parent attitudes about childhood vaccines survey. Human Vaccines 2011;7 (4):419–25. [DOI] [PMC free article] [PubMed] [Google Scholar]
- [12].Opel DJ, Taylor JA, Mangione-Smith R, Solomon C, Zhao C, Catz S, et al. Validity and reliability of a survey to identify vaccine-hesitant parents. Vaccine 2011;29(38):6598–605. [DOI] [PubMed] [Google Scholar]
- [13].Report of the SAGE working group on vaccine hesitancy. World Health Organization; 2014. [Google Scholar]
- [14].Furr M Scale construction and psychometrics for social and personality psychology. SAGE Publications Ltd; 2011. [Google Scholar]
- [15].Azizi FSM, Kew Y, Moy FM. Vaccine hesitancy among parents in a multi-ethnic country, Malaysia. Vaccine 2017;35(22):2955–61. [DOI] [PubMed] [Google Scholar]
- [16].Domek GJ, O’Leary ST, Bull S, Bronsert M, Contreras-Roldan IL, Ventura GAB, et al. Measuring vaccine hesitancy: field testing the WHO SAGE Working Group on Vaccine Hesitancy survey tool in Guatemala. Vaccine 2018;36 (35):5273–81. [DOI] [PMC free article] [PubMed] [Google Scholar]
- [17].Cooper S, Betsch C, Sambala EZ, Mchiza N, Wiysonge CS. Vaccine hesitancy – a potential threat to the achievements of vaccination programmes in Africa. Hum Vaccines Immunotherapeutics 2018. [in press]. [DOI] [PMC free article] [PubMed] [Google Scholar]
- [18].Akmatov MK, Mikolajczyk RT. Timeliness of childhood vaccinations in 31 low and middle-income countries. J Epidemiol Commun Health 2012;66(7). e14–e14. [DOI] [PubMed] [Google Scholar]
- [19].Nyaku M, Wardle M, Eng JV, Ametewee L, Bonsu G, Opare JKL, et al. Immunization delivery in the second year of life in Ghana: the need for a multi-faceted approach. Pan Afr Med J 2017;27(suppl 3). [DOI] [PMC free article] [PubMed] [Google Scholar]
- [20].Gust DA, Strine TW, Maurice E, Smith P, Yusuf H, Wilkinson M, et al. Underimmunization among children: effects of vaccine safety concerns on immunization status. Pediatrics 2004;114(1):e16–22. [DOI] [PubMed] [Google Scholar]
- [21].Gust DA, Kennedy A, Shui I, Smith PJ, Nowak G, Pickering LK. Parent attitudes toward immunizations and healthcare providers the role of information. Am J Prev Med 2005;29(2):105–12. [DOI] [PubMed] [Google Scholar]
- [22].Gust D, Brown C, Sheedy K, Hibbs B, Weaver D, Nowak G. Immunization attitudes and beliefs among parents: beyond a dichotomous perspective. Am J Health Behav 2005;29(1):81–92. [DOI] [PubMed] [Google Scholar]
- [23].Gust DA, Darling N, Kennedy A, Schwartz B. Parents with doubts about vaccines: which vaccines and reasons why. Pediatrics 2008;122(4):718–25. [DOI] [PubMed] [Google Scholar]
- [24].Shui IM, Weintraub ES, Gust DA. Parents concerned about vaccine safety: differences in race/ethnicity and attitudes. AmJ Prev Med 2006;31(3):244–51. [DOI] [PubMed] [Google Scholar]
- [25].Salmon DA, Sotir MJ, Pan WK, Berg JL, Omer SB, Stokley S, et al. Parental vaccine refusal in Wisconsin: a case-control study. WMJ 2009;108(1):17–23. [PMC free article] [PubMed] [Google Scholar]
- [26].Gilkey MB, Reiter PL, Magnus BE, McRee A-L, Dempsey AF, Brewer NT. Validation of the vaccination confidence scale: a brief measure to identify parents at risk for refusing adolescent vaccines. Acad Pediatrics 2016;16 (1):42–9. [DOI] [PMC free article] [PubMed] [Google Scholar]
- [27].Kennedy AM, Brown CJ, Gust DA. Vaccine beliefs of parents who oppose compulsory vaccination. Public Health Rep 2005;120(3):252–8. [DOI] [PMC free article] [PubMed] [Google Scholar]
- [28].Prislin R, Dyer JA, Blakely CH, Johnson CD. Immunization status and sociodemographic characteristics: the mediating role of beliefs, attitudes, and perceived control. Am J Public Health 1998;88(12):1821–6. [DOI] [PMC free article] [PubMed] [Google Scholar]
- [29].Holgado-Tello FP, Chacón-Moscoso S, Barbero-García I, Vila-Abad E. Polychoric versus Pearson correlations in exploratory and confirmatory factor analysis of ordinal variables. Qual Quant 2010;44(1):153–66. [Google Scholar]
- [30].Baglin J Improving your exploratory factor analysis for ordinal data: a demonstration using FACTOR. Pract Assess Res Eval 2014;19(5):2. [Google Scholar]
- [31].Cureton EE, Mulaik SA. The weighted varimax rotation and the promax rotation. Psychometrika 1975;40(2):183–95. [Google Scholar]
- [32].Revelle W psych: procedures for personality and psychological research. Evanston, Illinois, USA: Northwestern University; 2017. [Google Scholar]
- [33].Lorenzo-Seva U, Ferrando P. FACTOR: a computer program to fit the exploratory factor analysis model. Reus, Spain: Rovira i Virgili University; 2017. [DOI] [PubMed] [Google Scholar]
- [34].Trizano-Hermosilla I, Alvarado JM. Best alternatives to Cronbach’s alpha reliability in realistic conditions: congeneric and asymmetrical measurements. Front Psychol 2016:7. [DOI] [PMC free article] [PubMed] [Google Scholar]
- [35].McNeish D Thanks coefficient alpha, we’ll take it from here; 2017. [DOI] [PubMed] [Google Scholar]
- [36].Opel DJ, Taylor JA, Zhou C, Catz S, Myaing M, Mangione-Smith R. The relationship between parent attitudes about childhood vaccines survey scores and future child immunization status: a validation study. JAMA Pediatrics 2013;167(11):1065–71. [DOI] [PMC free article] [PubMed] [Google Scholar]
- [37].Luman ET, Barker LE, Shaw KM, McCauley MM, Buehler JW, Pickering LK. Timeliness of childhood vaccinations in the United States: days undervaccinated and number of vaccines delayed. JAMA 2005;293 (10):1204–11. [DOI] [PubMed] [Google Scholar]
- [38].Rainey JJ, Watkins M, Ryman TK, Sandhu P, Bo A, Banerjee K. Reasons related to non-vaccination and under-vaccination of children in low and middle income countries: findings from a systematic reviewofthe published literature, 1999¬2009. Vaccine 2011;29(46):8215–21. [DOI] [PubMed] [Google Scholar]
- [39].Gilkey MB, McRee A-L, Magnus BE, Reiter PL, Dempsey AF, Brewer NT. Vaccination confidence and parental refusal/delay of early childhood vaccines. PLoS ONE 2016;11(7):e0159087. [DOI] [PMC free article] [PubMed] [Google Scholar]
- [40].MacDonald NE. Vaccine hesitancy: definition, scope and determinants. Vaccine 2015;33(34):4161–4. [DOI] [PubMed] [Google Scholar]
- [41].Tversky A, Kahneman D. Availability: a heuristic for judging frequency and probability. Cogn Psychol 1973;5(2):207–32. [Google Scholar]
- [42].Clark LA, Watson D. Constructing validity: basic issues in objective scale development. Psychol Assess 1995;7(3):309. [Google Scholar]
Associated Data
This section collects any data citations, data availability statements, or supplementary materials included in this article.