

Abstract
Cancer stem cells (CSCs) contribute to multidrug resistance, tumor recurrence and metastasis, making them prime therapeutic targets. Their ability to differentiate and lose stem cell properties makes them challenging to study. Currently, there is no simple assay that can capture and trace the dynamic phenotypic changes on the CSC surface. Here, we report rapid discrimination of breast CSCs from non-CSCs using a nanoparticle-fluorescent-protein based sensor. This nanosensor was employed to discriminate CSCs from non-CSCs, as well CSCs that had differentiated in vitro in two breast cancer models. Importantly, the sensor platform could also discriminate CSCs from the bulk population of cells in patient-derived xenografts of human breast cancer. Taken together, the results obtained demonstrate the feasibility of using the nanosensor to phenotype CSCs and monitor their fate. Furthermore, this approach provides a novel area for therapeutic interventions against these challenging targets.
Keywords: Cancer stem cell, Array-based sensing, Discrimination, Patient-derived xenografts, Personalized medicine
Background
The complex geno-and phenotypic heterogeneity of tumors is reflected in the observation that tumor cells within a given cancer differ in their morphology, proliferative capacity, sensitivity to therapeutic agents and metastatic potential. Although quantitative analysis of phenotypic markers is an essential tool for drug discovery,1 it can be challenging because of tumor heterogeneity. One of the most telling aspects of such nature is that only a subset of cells within a tumor are capable of initiating a new primary tumor or metastasis.2 These cells are referred to as cancer stem cells (CSCs). They have the ability to self-renew and differentiate into multiple lineages, metastasizing and populating new tumors.3 CSCs are highly resistant to standard chemotherapeutic strategies and are considered prime drivers of tumor recurrence and metastasis, making them important therapeutic targets.4,5
CSCs present in solid tumors are often de-differentiated and exhibit properties of an epithelial-to-mesenchymal transition (EMT).6,7 In fact, EMT can enrich a CSC population, a process associated with cancer progression and metastasis.8,9 CSCs are also inherently plastic and they can differentiate i.e., undergo a mesenchymal-epithelial transition (MET), in response to stimuli from the microenvironment and other factors.10,11 This process results in loss of stem cell properties, which make them even more difficult to detect and monitor. Interestingly, however, the EMT and MET may not be all-or-none responses, but rather multi-stage and reversible processes involving intermediate states.12,13 During each transition state, both genomic and phenotypic changes can occur, with concomitant alterations in their behavior and response to drugs.14 This complexity of CSC phenotypes even within the same cancer creates a challenge when profiling CSCs from individual tumors.
Current methods of phenotyping cells are mainly through fluorescent imaging and flow cytometry.15,16 While providing useful information, these methods are limited in a few aspects: expensive instrumentation, specific antibodies, and burdensome data collection and analysis. Moreover, current strategies rely heavily on cell surface markers.17–19 Such biomarker-based approaches, however, are hindered by ambiguity and end-point evaluation. For instance, CD133 was thought to be a suitable marker for colon CSCs, but alternative sensing modalities show this biomarker to be unreliable.20,21 In addition, evidence has shown that a partial EMT gives rise to hybrid cells expressing both epithelial and mesenchymal markers.13,22 Since end-point biomarker evaluation only targets one phenotype, using this approach is likely to miss any intermediate states. Thus, there is an urgent need for a simple and general method to phenotype and trace the dynamic changes that occur within populations of CSCs.
Nanotechnology in combination with natural science has emerged to become a powerful tool for investigating challenging biological questions.23,24 Inspired by the human olfactory system, chemical nose sensing was developed as a hypothesis-free, signature-based tool to identify complex bioanalytes.25–27 Gold nanoparticles (AuNPs) with tunable surface functionality and strong quenching ability28 are ideal for constructing nanosensors. Nanoparticle-based sensor arrays can be engineered to selectively interact with a target analyte, generating a unique response signature. Since no specific recognition is involved in the process, extensive pre-knowledge of analytes is not required, making it a hypothesis-free approach. Once trained, nanosensors can quickly identify target analytes through pattern recognition and results can be obtained within minutes. Successful implementation has been shown in a wide range of biomolecules including proteins,29 bacteria,30 and mammalian cells.25
In this paper, we employ an array-based strategy to profile CSCs and monitor their phenotypic alterations (Figure 1). The nanosensor used here is composed of a functionalized gold nanoparticle (AuNP) and three fluorescent proteins (FP) of which the fluorescence is initially quenched by AuNP but restored upon addition of cells. We tested our sensor against CSC models created both in vitro and in vivo, demonstrating a feasible approach to detect differentiation and other phenotypic changes for both screening applications and personalized diagnostics.
Figure 1.
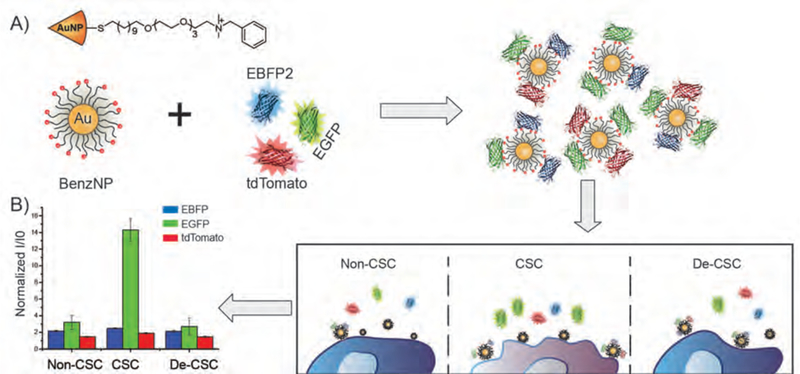
Schematic illustration of signature-based sensing of CSCs. A) Equimolar amount of three fluorescent proteins are incubated with Benzyl-AuNP forming BenzNP-FP complexes. B) Upon the additional of cells, fluorescent proteins are displaced and turned on by cell surface. Populations of CSCs, non-CSCs and CSCs that have differentiated and lost stem cell properties (de-CSCs) interact differentially with sensor elements, resulting in unique fluorescent patterns.
Methods
Ethical Statement
Human breast tumor tissue was obtained and used in compliance with the institutional review board of the University of Massachusetts Medical School. All mouse experiments were performed following a protocol approved by the Institutional Animal Care and Use Committee of the University of Massachusetts Medical School.
Nanoparticle Synthesis and Characterization
Benzyl gold nanoparticles with a core diameter of 2nm were synthesized according to previous reports.31 Detailed synthesis scheme and characterization of BenzNPs can be found in the supplementary information. The characterization data corresponds well with that reported in the literature.
Fluorescent Proteins Expression
EGFP, EBFP, tdTomato32 were synthesized and characterized following previously reported procedures. In brief, Escherichia coli BL21 (DE3) strain was transformed with plasmids containing recombinant proteins. Fluorescent proteins were then purified by Co2+ nitrilotriacetate columns and characterized by SDS-PAGE gel, absorbance and fluorescence spectra. The characterization data is similar with previous published work.27
Isolation of Mammary Epithelial Cells
MCF-10A cells that express a tamoxifen-inducible ER-SRC were provided by Dr. Kevin Struhl (Harvard Medical School, Boston, MA). Protocols for the isolation of the CD44high/CD24low population from these Src-transformed MCF10A cells and characterization of distinct EPTH and MES subpopulations within the CD44high/CD24low population based on the expression of the P6 integrin have been described.33
Engineering S1 Cell Lines
HMT-3522 S1 human mammary epithelial cells were obtained from Dr. Mina Bissell34 (Lawrence Berkeley National Laboratory) and maintained as described by the Bissell laboratory.35 These cells were transfected with either empty vector (pLVX-puro) or a constitutively active form of TAZ that contains the following S to A point mutations (S66A, S89A, S117A and S311A) and is referred to as 4SA-TAZ (pLVX-4SA-TAZ; provided by Xaralabos Varelas, Boston University).36 Stable transfectants were selected using 2 ug/ml puromycin. To induce differentiation of S1 cells expressing 4SA-TAZ, these cells were transfected with a β4 integrin plasmid (pRC-β4) and selected with neomycin. All cell populations used were stable cell lines, which were cultured for two passages without any antibiotics to avoid potential problems related to transfection-or selection-related surface alterations. All cell populations were assessed for self-renewal ability using serial mammosphere assay as described previously.37 The expression of key stem cell and EMT genes was quantified by qPCR.
Patient-derived Xenografts (PDX)
PDX models of human triple-negative breast cancer were maintained in immunocompromised NOD.Cg-Prkdcscid IL2rgtm1Wjl (abbreviated as NSG) mice as described previously.38 Tumors were harvested, minced and digested for 2–3 hours at 37°C with a mixture of collagenase (Roche, Indianapolis, IN, USA) and hyaluronidase (MP Biomedicals, Solon, OH, USA). The digested cells were passed through a cell strainer to obtain single cell suspensions and plated briefly in serum (1–2 h) to deplete mammary fibroblasts. To isolate CSCs from PDX tumors, dissociated cells were stained with antibodies for lineage markers (CD31, CD45, Ter-119), CD44 and CD24. The lineage antibodies were purchased from eBioscience. The various populations were sorted using flow cytometry [(nozzle size (mm)/pressure (psi): 85/45)]. Both populations (CSC and non-CSC) were sorted at the same time using two-way sort to minimize the sorting effect on cell surface alterations.
Immunoblotting and qPCR
Cells were extracted using a Triton X-100 buffer (1% Triton X-100, 150 mM NaCl, 50 mM Tris-HCl [pH 7.5], 1 mM phenylmethanesulfonylfluoride [PMSF] and protease inhibitors), and proteins were separated by SDS-PAGE under reducing conditions. These gels were immunoblotted using the following Abs: N-Cadherin (Invitrogen); E-Cadherin (Invitrogen); β4 integrin 505;39 c-myc (Cell Signaling); actin (Sigma); FLAG (Sigma). For qPCR, RNA was isolated using the NucleopSpin RNA kit (Macherey-Nagel) and 1 ug of total RNA was used to make cDNAs using a cDNA synthesis kit (Biorad). qPCR was performed using a SYBR green (Applied Biosystems) master mix as described by the manufacturer. qPCR primers were designed using primer bank.40
Cell Culture
MCF10A-ER-Src cells were cultured in DMEM/F12 medium containing 5% horse serum and other growth factors as described previously.41 S1 cell lines were grown and maintained as described by the Bissell laboratory.35 All cells were maintained at 37 °C in a humidified atmosphere containing 5% CO2. Cells were regularly passaged by trypsinization with 0.25% trypsin with EDTA, (Invitrogen) in PBS (pH 7.2). At ~80% confluence, cells were trypsinized and plated in 96-well plates (Greiner black-and-clear bottom) and cultured for 24 hrs. Cells were washed once with PBS buffer before proceeding to the sensing studies.
Sensing Studies
The sensor was prepared by mixing 100nM of BenzNP with equimolar (100nM) of EBFP, EGFP and tdTomato in 5mM sodium phosphate buffer (pH7.4) for 30 minutes at room temperature. Then, 200uL of sensor solution was incubated with and without the cell populations (washed once with PBS) in 96-well microplates for 30 minutes. The change of fluorescence intensity in each channel was recorded at its respective wavelength (EBFP: 380/450nm, EGFP: 475/510nm, tdTomato: 550/585nm) on a Molecular Devices SpectraMax M2 microplate reader using appropriate filters.
Linear Discriminant Analysis
The raw fluorescence data was processed by classical linear discriminant analysis using SYSTAT software (version 11.0, SystatSoftware, Richmond, CA, USA). In LDA, all variables were used in the model (complete mode) and the tolerance was set as 0.001. The raw fluorescence response patterns were transformed to canonical patterns where the ratio of between-class variance to the within-class variance was maximized according to the preassigned grouping. To identify the unknown samples, the fluorescence response patterns of each new case was first converted to canonical scores using the discriminant functions established on the training cases. Then, Mahalanobis distance42 was computed. Blinded cases were predicted to belong to the closest group, defined by the shortest Mahalanobis distance.
Receiver Operating Characteristic Analysis
Receiver operating characteristic (ROC) analysis was used to evaluate the performacne of LDA algorithm. ROC analysis calcualtes the true and fales postive rate of a given binary sample set. By ploting the two rates, an area under the curve can be derived, which indicates the ability of the test to discriminate the desired two populations. ROC analysis was done using Rstudio (version 1.0.143, Integrated Development for R. RStudio, Inc., Boston, MA).
Results
Complexation of nanosensor
The sensor array used here is composed of a benzyl headgroup-terminated AuNP (BenzNP) and three types of fluorescent proteins (EGFP, EBFP, and tdTomato) as shown in Figure 1A. The cationic BenzNP binds strongly with anionic fluorescent proteins, resulting in fluorescence quenching. Upon incubation with cells, cell surface functionalities compete with fluorescent proteins for AuNP binding. The released fluorescent proteins can then freely emit light, simultaneously giving out three-channel information in one well from the microplate. We hypothesized that CSCs and non-CSCs would interact differently with the BenzNP-FP supramolecular complexes, resulting in the generation of unique fluorescence patterns that could be used to profile CSC states (Fig. 1B).
Sensing of established CSC model
We first used a system that involves Src-transformation of mammary epithelial (MCF10A) cells to test our hypothesis. Upon transformation, the frequency of CSCs (CD44high/CD24low) increases significantly.43 Interestingly, though, this CD44high/CD24low population is comprised of two distinct populations that differ in their differentiation status and stem cell properties.33 The epithelial population (EPTH) is comprised of differentiated cells and lacks stem cell properties. The mesenchymal population (MES) is comprised of de-differentiated cells and exhibits stem cell properties (self-renewal, expression of stem cell genes, mammosphere formation and tumor initiation). The two subpopulations were isolated using previously reported procedures33 and seeded at a density of 104 cells/well in a 96-well microplate for 24 hours. Subsequently, an equimolar amount of BenzNP and three FPs were mixed at room temperature to form the nanosensor. Cells were washed once with phosphate buffered saline (PBS) and incubated with the nanosensor for 30 minutes before fluorescent measurement. The changes in fluorescence responses were statistically analyzed using linear discriminate analysis (LDA).
As shown in Figure 2, the MES population that harbors CSC properties was completely discriminated from the EPTH population that lacks CSC properties with 100% correct classification (two shaded ellipses). An important issue is whether our nanosensor could detect CSCs in a heterogeneous population of cells. To address this question, MES and EPTH cells, which had been cultured either separately or as a mixture, were incubated with the nanosensor. We found that the nanosensor could discriminate the relative proportion of CSCs with a high level of confidence (Fig. 2). Significantly, the sensor detected a corresponding trend across all the heterogeneous populations. Cross-validation among 0%, 50% and 100% CSC groups showed 100% correct classification (Table S5). Blinded cell mixture samples were tested for unknown identification among the three groups. 96% accurate unknown identification was achieved with only one case of 0% CSC misclassified as 50% CSC (Table S7).
Figure 2.
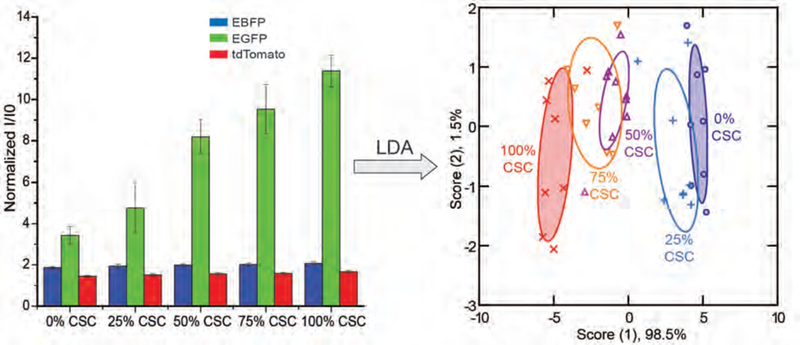
Discrimination of CSCs from the MCF-10A ER-Src system using BenzNP-FP nanosensor. Normalized fluorescent intensities against sensor only (I/I0) were obtained with nanosensor against different ratios of the MES (harboring CSCs) and EPTH subpopulations isolated from MCF-10A Src-transformed cells. Canonical scores for the first two factors of fluorescence patterns were generated and plotted through Linear Discriminant Analysis (LDA) with 95% confidence ellipses (n = 8).
Development of a phenotypic plastic CSC model
Although the MCF-10A ER-Src system provides a way to enrich CSCs, it does not reflect their dynamic plasticity. For this reason, we developed a second model system to monitor the CSC plasticity using a diploid, non-tumorigenic cell line (S1 cells).44 These cells are highly differentiated and polarized. Expression of the Hippo transducer TAZ in these cells induced transformation, an EMT and the acquisition of stem cell properties (Fig. 3A–C), consistent with previous findings.45,46 A consequence of TAZ transformation and the EMT was loss of the integrin α6β4, and this loss had a causal role in the genesis of CSCs. Re-expression of this integrin in TAZ-transformed cells reversed the EMT and resulted in loss of stem cell properties (Fig. 3A–C). We termed these cells de-CSCs. The identity of non-CSCs, CSCs, and de-CSCs was further verified by morphology, relative expression of epithelial and mesenchymal markers, as well as self-renewal ability (Fig. 3A–D).
Figure 3.
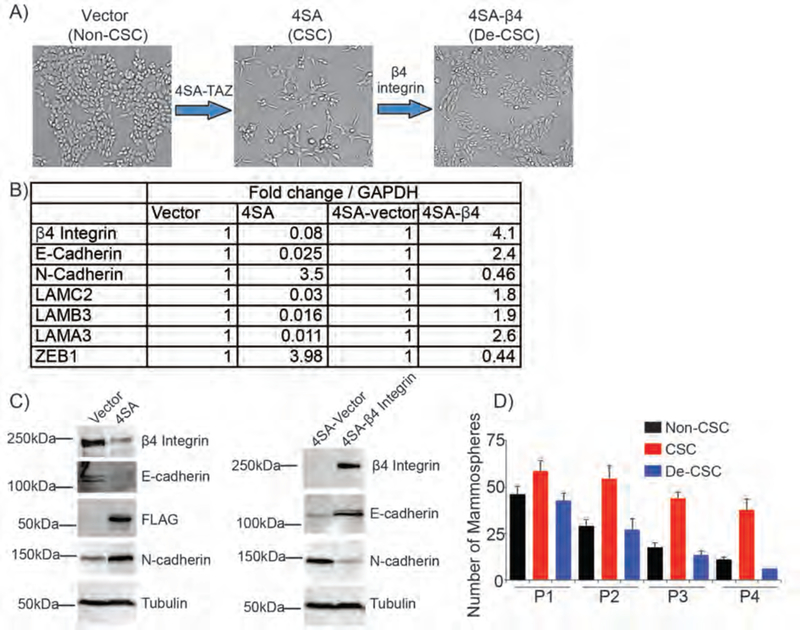
Workflow of generating reversible S1 model. Expression of active TAZ (4SA-TAZ) in S1 epithelial cells generated an EMT and CSCs. CSCs were induced to differentiate and lose sternness by overexpressing β4 integrin. A) The morphology of each population generated was shown. B) The expression of key EMT and epithelial genes was quantified by qPCR. Fold changes in mRNA level were shown in the table. C) Immunoblots of the S1 system showing the change in epithelial (β4 integrin and E-cadherin) and mesenchymal (N-cadherin) proteins. Tubulin loading control was shown in each blot. D) Cell self-renewal ability of each population was evaluated by serial passage of mammosphere formation assay.
Detection of phenotypical changes on CSCs
After establishing the S1 system, each of these populations was incubated with the sensor for 30 minutes, fluorescent patterns were obtained and analyzed. Consistent discrimination between the CSC and non-CSC groups was observed (Fig. 4A). In addition, de-CSCs clustered closely and overlapped with non-CSCs on the LDA plot, which could be due to the fact that both groups lack stem cell phenotypes and share a similar morphology (Fig. 3A). The nanosensor was also able to detect different percentages of CSCs in the heterogeneous populations (Fig. 4B). Cross-validation among 0%, 50% and 100% CSC mixtures showed 100% accurate classification (Table S6). Complete correct unknown identification of the blinded cell mixtures was also achieved (Table S9). To evaluate the performance of the LDA algorithm used, we employed the receiver operating characteristic (ROC) analysis on the S1 data set. As shown in Figure 4C, ROC results showed an area under the curve of 1.0, indicating a complete separation between CSC and non/de-CSC population.
Figure 4.

Discrimination of CSCs, non-CSCs and de-CSCs from S1 system using BenzNP-FP nanosensor. A) A canonical score plot for the first two factors of fluorescence patterns was obtained with BenzNP-FP nanosensor against CSCs, non-CSCs, and de-CSCs from S1 cell lines. The scores were generated through LDA with 95% confidence ellipses (n = 8). B) Similarly, a canonical score plot was derived for the classification of different ratios of CSC and non-CSC mixture. C) Receiver operating characteristic analysis of CSCs, non-CSCs and de-CSCs from the S1 system. For analysis purpose, non-CSC and de-CSC were combined into one group and referred as non/de-CSC. The area under the curve was calculated to be 1.0 indicating complete discrimination between the two groups.
Sensing of patient-derived xenografts
To determine the potential utility of our sensor in human tumors, we tested the sensing system on patient-derived xenografts (PDX). PDX tumors were generated by transplanting tumor specimens from an individual breast cancer patient into immuno-compromised NSG mice. CSCs (CD44high/CD24low) and non-CSCs (CD44low/CD24high) were isolated from PDX tumors by fluorescence-activated cell sorting (FACS) (Fig. 5A). Both populations (CSC and non-CSC) were sorted at the same time using a two-way sort to minimize the sorting effect on cell surface alterations. The identity of each population was validated by assessing their self-renewal ability in mammosphere assays (Fig. 5B). A similar sensing strategy was performed on PDX-derived CSCs and non-CSCs. The canonical score plot obtained showed complete separation of the two groups with 100% classification accuracy (Fig. 5C). Unknown samples from each group were tested and correctly identified into either CSCs or non-CSCs with 100% accuracy (Table S10).
Figure 5.
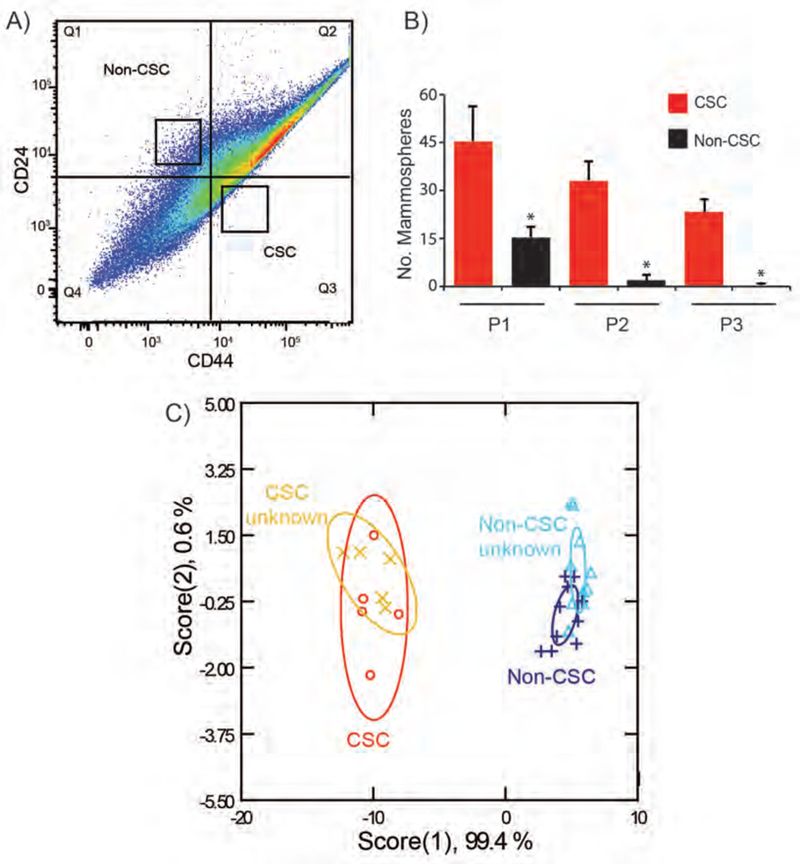
Isolation, characterization, and discrimination of primary CSCs from patient-derived xenografts. A) CSCs and non-CSCs were isolated from PDX models of human breast cancer by FACS using CD44 and CD24 markers. B) Self-renewal potential of these two populations was assessed by serial passage mammosphere formation assay. C) CSC and non-CSCs from PDX were sensed with BzNP-FP nanosensor. Fluorescence patterns were analyzed through LDA. Canonical plot of the first two scores for CSC and Non-CSC samples was generated with 95% confidence ellipses. Unknown samples from each group were correctly identified based on the established training set.
Discussion
CSCs present crucial targets for breast cancer therapy.47,48 The plastic nature of CSCs as they respond to the environment has enriched our knowledge of the EMT and MET.10,11 Much information is harbored in the physical properties of cells, yet there are significant challenges in extracting that data in a quantitative and reliable way. In this paper, we use a nanosensor array as an alternative strategy to phenotype CSCs. The key in this ‘olfaction’ array-based sensing is being able to generate distinct patterns through selective interactions between sensor elements and analytes. To achieve these interactions, the surface functionality of AuNPs is carefully considered in the sensor design. Previously, we explored a library of AuNPs with different hydrophobicity, aromaticity, and hydrogen bonding characteristics. We discovered that benzyl-terminated AuNP contributed significantly to the differential sensor responses with cells.25,26,49 To ensure a high selectivity in profiling the overall physicochemical changes on cancer stem cells, we chose the Benzyl-NP as the interacting unit in this study. The successful discrimination between non-CSC and CSCs shows high accuracy of such sensing approach (Fig. 2). In the cell mixture studies for both MCF-10A ER-Src and S1 models, we observed that when CSCs were added to non-CSCs at a percentage as low as 25%, the sensor output was altered, demonstrating a reasonable level of sensitivity of the nanosenor (Fig. 2 & 4B). The reliability of our sensor strategy is further demonstrated in its ability to identify unknown samples. By computing the Msahalanobis squared distance between the test samples and trained groups (CSCs and non-CSCs), unknown samples were clustered into the closest group. The high percentage of correct unknown identification validates the reliability of our sensor. Furthermore, all sensor elements were mixed in one well in the microplate, which reduces sensor material cost and analysis steps.
Currently, the exact nature of the interactions between the nanosensor and cell surfaces is not well understood. The sensor must interact with different components of cell membranes in order to preferentially release quenched fluorescent proteins. Our previous study showed that the sensor system was highly sensitive to glycosylation patterns, providing a possible origin for the responses observed in the current study,50 so it quite likely that glycosylation is at least in part responsible for the observed discrimination. Additional interactions could also occur, including electrostatic51 and aromatic stacking52 contacts between the particle and protein.. Since cell surface composition varies significantly among cell types and states,53,54 the differential fluorescence responses of CSCs, non-CSCs, and de-CSCs observed here are likely due to a mixture of changes in the cell surface functionalities.
Poorly differentiated tumors such as triple negative breast cancer exhibit an embryonic gene expression pattern55 and are dependent upon developmental signaling pathways.56–58 These pathways play crucial roles initiating and maintaining the pluripotency of CSCs,59, 60 in particular the Hippo pathway because the Hippo transducer TAZ has a causal role in sustaining CSC function.38,45 Our data on TAZ-mediated genesis of CSCs revealed that a key integrin, α6β4, has an important role in impeding the CSC phenotype. The restoration of α6β4 reverted stem cell properties (Fig. 3). The results demonstrate that the S1 system has the advantage of generating CSCs from breast epithelial cells and being able to reverse stemness by expressing a single integrin. The reversible S1 system reflected the dynamic state of CSCs and the sensing results showed that the nanosensor can capture such phenotypic changes by clustering them into different groups. Taken together, the data obtained using two different in vitro models demonstrate the power of array-based sensing in profiling CSCs.
There has been intense interest in personalized cancer medicine based on the fact that the geno- and phenotypic properties of tumors differ significantly among patients. Interestingly, recent data revealed that CSCs isolated from patients with same cancer (colon) differ in their properties and response to chemotherapeutics.14 This observation highlights the need to profile CSCs from individual breast cancer patients. In our study, a clear discrimination of CSCs in PDX models of human breast cancer was observed in Figure 5. This result is exciting because it opens the possibility of phenotyping CSCs from individual patients, though further refinement of individual samples is needed due to tumor heterogeneity. The system presents a promising future of monitoring each patient’s CSCs responses to different chemotherapeutics, which could be a potential new dimension for precision medicine.
In summary, we report a nanoparticle-fluorescent-protein based multi-channel sensor that rapidly discriminates CSC from non-CSC phenotypes. This sensor platform provides a tool with applications in both diagnostics and screening approaches for therapeutic design. The nanosensor is highly versatile, as demonstrated by rapid detection of CSCs in both in vitro and in vivo models. Taken together, the ability to rapidly identify and profile CSCs provides access to new strategies to combat the multidrug resistance, tumor recurrence and metastasis associated with CSCs.
Supplementary Material
Acknowledgments
Funding: This work was supported by the National Institutes of Health [GM077173, CA168464 and CA203439 CA207932]; the JSPS Research Fellowships for Young Scientists; and the University of Massachusetts President’s Science and Technology fund.
Footnotes
Conflict of interests: The authors declare that they have no conflicts of interest with the contents of this article.
REFERENCES
- 1.Moffat JG, Rudolph J, and Bailey D Phenotypic screening in cancer drug discovery - past, present and future. Nat. Rev. Drug Discovery. 2014, 13, 588–602. [DOI] [PubMed] [Google Scholar]
- 2.Dick JE Stem cell concepts renew cancer research. Blood. 2008, 112, 4793–4807. [DOI] [PubMed] [Google Scholar]
- 3.Meacham CE, and Morrison SJ Tumour heterogeneity and cancer cell plasticity. Nature 2013, 501, 328–337. [DOI] [PMC free article] [PubMed] [Google Scholar]
- 4.Dean M, Fojo T, and Bates S Tumour stem cells and drug resistance. Nat. Rev. Cancer. 2005, 5, 275–284. [DOI] [PubMed] [Google Scholar]
- 5.Vinogradov S, and Wei X Cancer stem cells and drug resistance: The potential of nanomedicine. Nanomedicine (Lond) 2012, 7, 597–615. [DOI] [PMC free article] [PubMed] [Google Scholar]
- 6.Mani SA, Guo W, Liao MJ, Eaton EN et al. The epithelial-mesenchymal transition generates cells with properties of stem cells. Cell 2008, 133, 704–715. [DOI] [PMC free article] [PubMed] [Google Scholar]
- 7.Scheel C, and Weinberg RA Cancer stem cells and epithelial-mesenchymal transition: concepts and molecular links. Semin. Cancer Biol. 2012, 22, 396–403. [DOI] [PMC free article] [PubMed] [Google Scholar]
- 8.Yang J, and Weinberg RA Epithelial-mesenchymal transition: At the crossroads of development and tumor metastasis. Dev. Cell. 2008, 14, 818–829. [DOI] [PubMed] [Google Scholar]
- 9.Singh A, and Settleman J EMT, cancer stem cells and drug resistance: An emerging axis of evil in the war on cancer. Oncogene 2010, 29, 4741–4751. [DOI] [PMC free article] [PubMed] [Google Scholar]
- 10.Polyak K, and Weinberg RA Transitions between epithelial and mesenchymal states: Acquisition of malignant and stem cell traits. Nat. Rev. Cancer. 2009, 9, 265–273. [DOI] [PubMed] [Google Scholar]
- 11.Tsai JH, Donaher JL, Murphy DA, Chau S, and Yang J Spatiotemporal regulation of epithelial-mesenchymal transition is essential for squamous cell carcinoma metastasis. Cancer Cell 2012, 22, 725–736. [DOI] [PMC free article] [PubMed] [Google Scholar]
- 12.Andriani F, Bertolini G, Facchinetti F, Baldoli E, Moro M, Casalini P et al. Conversion to stem-cell state in response to microenvironmental cues is regulated by balance between epithelial and mesenchymal features in lung cancer cells. Mol. Oncol. 2016, 10, 253–271. [DOI] [PMC free article] [PubMed] [Google Scholar]
- 13.Jolly MK, Tripathi SC, Jia D, Mooney SM, Celiktas M, Hanash SM, et al. Stability of the hybrid epithelial/mesenchymal phenotype. Oncotarget 2016, 7, 27067–27084. [DOI] [PMC free article] [PubMed] [Google Scholar]
- 14.Carstens MR, Fisher RC, Acharya AP, Butterworth EA, Scott E, Huang EH et al. Drug-eluting microarrays to identify effective chemotherapeutic combinations targeting patient-derived cancer stem cells. Proc. Natl. Acad. Sci. U.S.A. 2015, 112, 8732–8737. [DOI] [PMC free article] [PubMed] [Google Scholar]
- 15.Yang B, Treweek JB, Kulkarni RP, Deverman BE, Chen CK, Lubeck E et al. Singlecell phenotyping within transparent intact tissue through whole-body clearing. Cell 2014, 158, 945–958. [DOI] [PMC free article] [PubMed] [Google Scholar]
- 16.Pockley AG, Foulds GA, Oughton JA, Kerkvliet NI, and Multhoff G Immune cell phenotyping using flow cytometry. Curr. Protoc. Toxicol. 2015, 66, 1–34. [DOI] [PubMed] [Google Scholar]
- 17.Al-Hajj M, Wicha MS, Benito-Hernandez A, Morrison SJ, and Clarke MF Prospective identification of tumorigenic breast cancer cells. Proc. Natl. Acad. Sci. U.S.A. 2003, 100, 3983–3988. [DOI] [PMC free article] [PubMed] [Google Scholar]
- 18.Ginestier C, Hur MH, Charafe-Jauffret E, Monville F, Dutcher J, Brown M et al. ALDH1 is a marker of normal and malignant human mammary stem cells and a predictor of poor clinical outcome. Cell Stem Cell 2007, 1, 555–567. [DOI] [PMC free article] [PubMed] [Google Scholar]
- 19.Dontu G, Abdallah WM, Foley JM, Jackson KW, Clarke MF, Kawamura MJ et al. In vitro propagation and transcriptional profiling of human mammary stem/progenitor cells. Genes Dev. 2003, 17, 1253–1270. [DOI] [PMC free article] [PubMed] [Google Scholar]
- 20.Kemper K, Sprick MR, de Bree M, Scopelliti A, Vermeulen L, Hoek M et al. The AC133 epitope, but not the CD133 protein, is lost upon cancer stem cell differentiation. Cancer Res. 2010, 70, 719–729. [DOI] [PubMed] [Google Scholar]
- 21.Mak AB, Blakely KM, Williams RA, Penttila PA, Shukalyuk AI, Osman KT et al. CD133 protein n-glycosylation processing contributes to cell surface recognition of the primitive cell marker AC133 epitope. J. Biol. Chem. 2011, 286, 41046–41056. [DOI] [PMC free article] [PubMed] [Google Scholar]
- 22.Strauss R, Li ZY, Liu Y, Beyer I, Persson J, Sova P et al. Analysis of epithelial and mesenchymal markers in ovarian cancer reveals phenotypic heterogeneity and plasticity. PLoS One 2011, 6, 10.1371/journal.pone.0016186. [DOI] [PMC free article] [PubMed] [Google Scholar]
- 23.Barkalina N, Charalambous C, Jones C, and Coward K Nanotechnology in reproductive medicine: emerging applications of nanomaterials. Nanomedicine. 2014, 10, 921–938. [DOI] [PubMed] [Google Scholar]
- 24.Sobczak-Kupiec A, Venkatesan J, Alhathal AlAnezi A, Walczyk D, Farooqi A, Malina D, et al. Magnetic nanomaterials and sensors for biological detection. Nanomedicine. 2016, 12, 2459–2473. [DOI] [PubMed] [Google Scholar]
- 25.Bajaj A, Miranda OR, Kim IB, Phillips RL, Jerry DJ, Bunz UH et al. Detection and differentiation of normal, cancerous, and metastatic cells using nanoparticle-polymer sensor arrays. Proc. Natl. Acad. Sci. U. S. A. 2009, 106, 10912–10916. [DOI] [PMC free article] [PubMed] [Google Scholar]
- 26.Rana S, Singla AK, Bajaj A, Elci SG, Miranda OR, Mout R et al. Array-based sensing of metastatic cells and tissues using nanoparticle-fluorescent protein conjugates. ACS Nano. 2012, 6, 8233–8240. [DOI] [PMC free article] [PubMed] [Google Scholar]
- 27.Rana S, Le ND, Mout R, Saha K, Tonga GY, Bain RE et al. A multichannel nanosensor for instantaneous readout of cancer drug mechanisms. Nat. Nanotechnol. 2015, 10, 65–69. [DOI] [PMC free article] [PubMed] [Google Scholar]
- 28.De M, Ghosh PS, and Rotello VM Applications of nanoparticles in biology. Adv. Mater. 2008, 20, 4225–4241. [Google Scholar]
- 29.Pode Z, Peri-Naor R, Georgeson JM, Ilani T, Kiss V, Unger T et al. Protein recognition by a pattern-generating fluorescent molecular probe. Nat. Nanotechnol. 2017, 10.1038/nnano.2017.175. [DOI] [PubMed] [Google Scholar]
- 30.Miranda OR, Li X, Garcia-Gonzalez L, Zhu Z-J, Yan B, Bunz UHF et al. Colorimetric bacteria sensing using a supramolecualr enzyme-nanoparticle biosensor. J. Am. Chem. Soc. 2011, 133, 9650–9653. [DOI] [PMC free article] [PubMed] [Google Scholar]
- 31.Tonga GY, Jeong Y Duncan B, Mizuhara T, Mout R, Das R et al. Supramolecular regulation of bioorthogonal catalysis in cells using nanoparticle-embedded transition metal catalysts. Nat. Chem. 2015, 7, 597–603. [DOI] [PMC free article] [PubMed] [Google Scholar]
- 32.De M, Rana S, and Rotello VM Nickel-ion-mediated control of the stoichiometry of his- tagged protein/nanoparticle interactions. Macromol. Biosci. 2009, 9, 174–178. [DOI] [PubMed] [Google Scholar]
- 33.Goel HL, Gritsko T, Pursell B, Chang C, Shultz LD, Greiner DL et al. Regulated splicing of the a6 integrin cytoplasmic domain determines the fate of breast cancer stem cells. Cell Rep. 2014, 7, 747–761. [DOI] [PMC free article] [PubMed] [Google Scholar]
- 34.Briand P, Petersen OW, and Van Deurs B A new diploid nontumorigenic human breast epithelial cell line isolated and propagated in chemically defined medium. In Vitro Cell Dev. Biol. 1987, 23, 181–188. [DOI] [PubMed] [Google Scholar]
- 35.Bissell Laboratory Protocols. [online] http://www2.lbl.gov/LBL-Programs/lifesciences/BissellLab/protocols.html (accessed January 26, 2017).
- 36.Lei QY; Zhang H; Zhao B; Zha ZY; Bai F; Pei XH et al. TAZ Promotes Cell Proliferation and Epithelial-Mesenchymal Transition and is Inhibited by the Hippo Pathway. Mol. Cell Biol. 2008, 28, 2426–2436. [DOI] [PMC free article] [PubMed] [Google Scholar]
- 37.Goel HL, Pursell B, Chang C, Shaw LM, Mao J, Simin K et al. GLI1 regulates a novel neuropilin-2/α6β1 integrin based autocrine pathway that contributes to breast cancer initiation. EMBO Mol. Med. 2013, 5, 488–508. [DOI] [PMC free article] [PubMed] [Google Scholar]
- 38.Chang C, Goel HL, Gao H, Pursell B, Shultz LD, Greiner DL et al. A laminin 511 matrix is regulated by TAZ and functions as the ligand for the α6Bβ1 integrin to sustain breast cancer stem cells. Genes Dev. 2015, 29, 1–6. [DOI] [PMC free article] [PubMed] [Google Scholar]
- 39.Rabinovitz I, Toker A, and Mercurio AM Protein kinase C-dependent mobilization of the α6β4 integrin from hemidesmosomes and its association with actin-rich cell protrusions drive the chemotactic migration of carcinoma cells. J. Cell Biol. 1999, 146, 1147–1160. [DOI] [PMC free article] [PubMed] [Google Scholar]
- 40.Primer Bank. [online] https://spga.mgh.harvard.edu/primerbank (accessed January 26, 2017).
- 41.Iliopoulos D, Hirsch HA, Wang G and Struhl K Inducible formation of breast cancer stem cells and their dynamic equilibrium with non-stem cancer cells via IL6 secretion. Proc. Natl. Acad. Sci. U. S. A. 2011, 108, 1397–1402. [DOI] [PMC free article] [PubMed] [Google Scholar]
- 42.Mahalanobis PC On the generalized distance in statistics. Proc. Natl. Inst. Sci. India. 1936, 2, 49–55. [Google Scholar]
- 43.Iliopoulos D, Polytarchou C, Hatziapostolou M, Kottakis F, Maroulakou IG, Struhl K et al. MicroRNAs differentially regulated by Akt isoforms control EMT and stem cell renewal in cancer cells. Sci. Signaling 2009, 2, 10.1126/scisignal.2000356. [DOI] [PMC free article] [PubMed] [Google Scholar]
- 44.Fournier MV, Martin KJ, Kenny PA, Xhaja K, Bosch I, Yaswen P et al. Gene expression signature in organized and growth-arrested mammary acini predicts good outcome in breast cancer. Cancer Res. 2006, 66, 7095–7102. [DOI] [PMC free article] [PubMed] [Google Scholar]
- 45.Cordenonsi M, Zanconato F, Azzolin L, Forcato M, Rosato A, Frasson C et al. The Hippo transducer TAZ confers cancer stem cell-related traits on breast cancer cells. Cell 2011, 147, 759–772. [DOI] [PubMed] [Google Scholar]
- 46.Zanconato F, Cordenonsi M, and Piccolo S YAP/TAZ at the roots of cancer. Cancer Cell 2016, 29, 783–803. [DOI] [PMC free article] [PubMed] [Google Scholar]
- 47.Gupta PB, Onder TT, Jiang G, Tao K, Kuperwasser C, Weinberg RA et al. Identification of selective inhibitors of cancer stem cells by high-throughput screening. Cell 2009, 138, 645–659. [DOI] [PMC free article] [PubMed] [Google Scholar]
- 48.Hirsch HA, Iliopoulos D, Tsichlis PN, and Struhl K Metformin selectively targets cancer stem cells, and acts together with chemotherapy to block tumor growth and prolong remission. Cancer Res. 2009, 69, 7507–7511. [DOI] [PMC free article] [PubMed] [Google Scholar]
- 49.Bajaj A, Rana S, Miranda OR, Yawe JC, Jerry DJ, Bunz UHF et al. Cell surface-based differentiation of cell types and cancer states using a gold nanoparticle-GFP based sensing array. Chem. Sci. 2010, 1, 134. [Google Scholar]
- 50.Rana S, Le ND, Mout R, Duncan B, Elci SG, Saha K et al. A multichannel biosensor for rapid determination of cell surface glycomic signatures. ACS Cent. Sci. 2015, 1, 191–197. [DOI] [PMC free article] [PubMed] [Google Scholar]
- 51.Escribá PV, González-Ros JM, Goñi FM, Kinnunen PKJ, Vigh L, Sánchez-Magraner L et al. Membranes: a meeting point for lipids, proteins and therapies, J. Cell. Mol. Med. 2008, 12, 829–875. [DOI] [PMC free article] [PubMed] [Google Scholar]
- 52.McGaughey GB, Gagné M, and Rappé AK Pi-Stacking interactions. Alive and well in proteins. J. Biol. Chem. 1998, 273, 15458–15463. [DOI] [PubMed] [Google Scholar]
- 53.Lanctot PM, Gage FH, and Varki AP The glycans of stem cells. Curr. Opin. Chem. Biol. 2007, 11, 373–380. [DOI] [PMC free article] [PubMed] [Google Scholar]
- 54.Srinivas PR, Kramer BS, and Srivastava S Trends in biomarker research for cancer detection. Lancet Oncol. 2001, 2, 698–704. [DOI] [PubMed] [Google Scholar]
- 55.Ben-Porath I, Thomson MW, Carey VJ, Ge R, Bell GW, Regev A et al. An embryonic stem cell-like gene expression signature in poorly differentiated aggressive human tumors. Nat. Genet. 2008, 40, 499–507. [DOI] [PMC free article] [PubMed] [Google Scholar]
- 56.Cai WY, Wei TZ, Luo QC, Wu QW, Liu QF, Yang M et al. The wnt-beta-catenin pathway represses let-7 microrna expression through transactivation of lin28 to augment breast cancer stem cell expansion. J. Cell Sci. 2013, 126, 2877–2889. [DOI] [PubMed] [Google Scholar]
- 57.Abel EV, Kim EJ, Wu J, Hynes M, Bednar F, Proctor E et al. The Notch pathway is important in maintaining the cancer stem cell population in pancreatic cancer. PLoS One 2014, 9, 10.1371/journal.pone.0091983. [DOI] [PMC free article] [PubMed] [Google Scholar]
- 58.Liu SL, Dontu G, Mantle ID, Patel S, Ahn NS, Jackson KW et al. Hedgehog signaling and bmi-1 regulate self-renewal of normal and malignant human mammary stem cells. Cancer Res. 2006, 66, 6063–6071. [DOI] [PMC free article] [PubMed] [Google Scholar]
- 59.Oishi N, Yamashita T, and Kaneko S Molecular biology of liver cancer stem cells. Liver Cancer 2014, 3, 71–84. [DOI] [PMC free article] [PubMed] [Google Scholar]
- 60.Takebe N, Harris PJ, Warren RQ, and Ivy SP Targeting cancer stem cells by inhibiting wnt, notch, and hedgehog pathways. Nat. Rev. Clin. Oncol. 2011, 8, 97–106. [DOI] [PubMed] [Google Scholar]
Associated Data
This section collects any data citations, data availability statements, or supplementary materials included in this article.