

Abstract
Introduction:
Physical activity (PA) has demonstrated substantial physical and psychological benefits. However, Hispanics engage in less leisure-time PA when compared with other groups, putting them at higher risk for diseases associated with obesity, such as diabetes mellitus type 2. This literature review was conducted to identify best practices with regard to interventions designed to increase PA among Hispanic adults.
Methods:
Extensive searching located 21 randomized controlled studies conducted in the United States.
Results:
Common conceptual frameworks were the transtheoretical model and social cognitive theory. Most interventions used educational sessions with a variety of topics and many used promotoras to increase PA. Outcomes were predominantly examined using self-report PA measures. Walking was the most commonly reported PA behavior. Studies with significant results were those that measured moderate-to-vigorous PA and used theory to guide interventions. Male and older participants were underrepresented.
Conclusions:
Effective culturally appropriate PA interventions for Hispanics adults are needed. Particular attention to intervention tailoring based on country of origin could enhance intervention effectiveness.
Keywords: systematic review, physical activity, Latino/a, adults, Hispanic
Introduction
The link between physical inactivity and overweight/obesity has been well documented (Kwon, Wang, & Hawkins, 2016). Overweight/obesity is associated with the development of chronic conditions such as diabetes mellitus type 2, coronary heart disease, and hypertension (HTN; Centers for Disease Control and Prevention, 2018). Approximately 69% of adults are overweight/obese (National Institute of Diabetes and Digestive and Kidney Diseases, 2017), and only 1 in 5 adults meets the recommendations of at least 150 minutes of physical activity (PA) every week (Centers for Disease Control and Prevention, 2014). Hispanics, the fastest growing group in the United States, engage in less leisure-time PA than other subsets of the U.S. population and are more likely to be diagnosed with diabetes mellitus type 2 (Brown, 2014; Marquez, Neighbors, & Bustamante, 2010).
Due to the burden that chronic health conditions place on Hispanic adults, it is critical to promote PA in this population. Previous published reviews focusing on factors that promote PA have been limited to healthy adults (Conn, Phillips, Ruppar, & Chase, 2012), females (Keller & Fleury, 2006; Perez, Fleury, & Keller, 2010; Sharma, 2008), non-Hispanic samples, or acculturation without a PA emphasis (Ickes & Sharma, 2012; Martinez, Ainsworth, & Elder, 2008; Mier, Ory, & Medina, 2010). This literature review aimed to identify intervention strategies to increase PAs that are culturally appropriate, and effective, for U.S. Hispanic adults. Such strategies could be used in clinical practice to enhance the health of this population.
Methods
Inclusion criteria for the literature search were randomized controlled PA intervention studies that included at least 75% U.S. Hispanic adults (i.e., age 18 or older) as participants. PubMed, the Cumulative Index to Nursing and Allied Health Literature (CINAHL), and PsycINFO were searched from start date to June 2018. Only randomized controlled trials (RCTs), due to the stronger level of evidence, were included. Studies that did not include a measurable PA outcome measures were excluded as were family-centered interventions that focused on PA behaviors of children.
Search Strategy
Searches were conducted following PRISMA guidelines (Moher, Liberati, Tetzlaff, Altman, & The PRISMA Group, 2009) and in the same manner for each database using the terms physical activity, intervention, Hispanic, Latino(a), and adults. For PubMed, the initial search yielded 882 results using the terms [physical activity AND intervention AND adult AND “Hispanic or Latino or Latina”]. After reading the titles and abstracts, 838 were excluded and 44 were read in full text. For CINAHL, 3,877 results were obtained; 4 were duplicates, 3,853 were excluded based on the title and abstract, and 20 were read in full text. For PsycINFO, there were 496 results; 6 duplicates, 481were excluded based on the title/abstract, and 9 studies read in full text (Figure 1). An additional 15 articles were excluded because there was no intervention, 20 were not RCTs, 5 did not measure a PA outcome, and 12 focused on children. In the end, 21 studies were included in the review.
Figure 1.
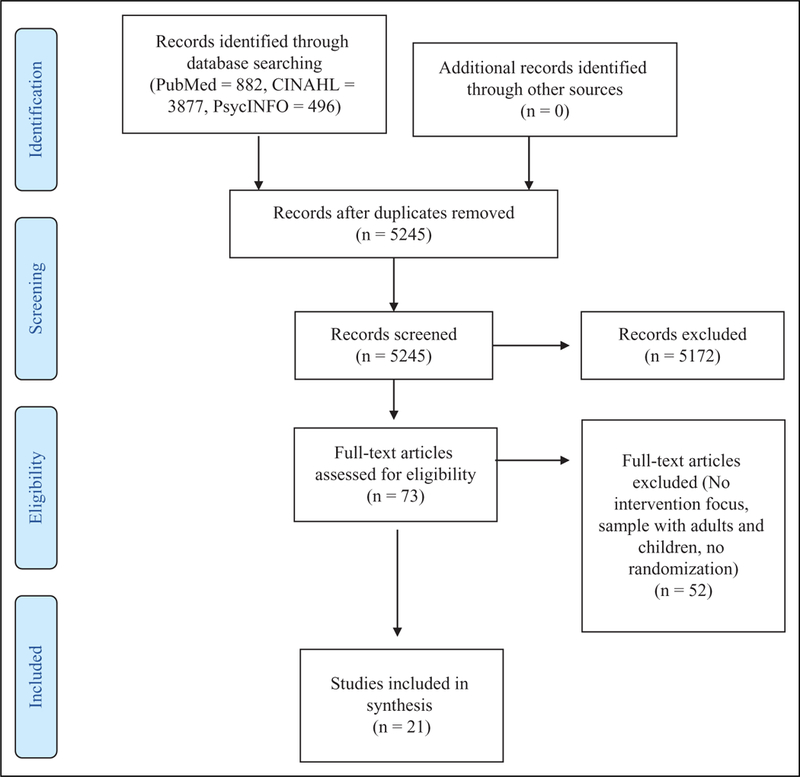
PRISMA diagram of search results. Adapted from Moher et al. (2009).
Data Extraction
One author independently extracted data and synthesized the results. Demographic data (i.e., sample size, age, gender, ethnicity, country of origin, and health status), theoretical approach, intervention description, and research design were extracted for each study. In addition, the type of PA behavior, how it was measured, and the pertinent results of each study were extracted.
Results
The 21 studies (Table 1) ranged in dates of publication from January 2001 to June 2018. All studies were RCTs; however, there was variation with regard to the intervention strategies and outcome measures used.
Table 1.
Randomized Controlled PA Intervention Studies With Hispanic Adults (N = 21)
| Author, Sample | Theoretical framework |
Intervention | Design, Follow-up length |
PA measure | Results |
|---|---|---|---|---|---|
|
Arredondo et al. (2017); N = 380; females, mean age (SD) = 44.4 (44.4) (100% Latina); various participants with T2DM, arthritis, heart disease, cancer |
Ecological framework Promotora model |
Weekly promotora-led free PA classes Start group with prayer, end class with review of monthly mailed health handouts with topics including setting goals and overcoming barriers to PA and short discussion on how to apply lesson or skill Culturally appropriate component: not specified |
Cluster randomized controlled trial (2 walking groups, 2 cardio dance classes, and 2 strength training classes) 12 months |
PA accelerometer weekly averages of MVPA; self-report PA World Health Organization Global Physical Activity Questionnaire: minutes per week of leisure time MVPA |
Accelerometer-based MVPA: Measured in logged units; PA adjusted mean (SE) IG = 4.93 (0.05) CG = 4.78 (0.03) Difference in adjusted means 0.15, p = .03 Self report leisure time PA: Measured in logged units; PA adjusted mean (SE) IG = 4.86 (0.05) CG = 4.47 (0.10) Difference in adjusted means 0.39, p = .003 IG participants had significant results |
|
Babamoto et al. (2009); N = 189; female 64%, male 36%, mean age (SD) = 50.0 (11.9); self-identified as Hispanic/Latino; various participants with hyperlipidemia |
No theory specified | Participants assigned to 1 of 3 study arms: CHW, CM, or SPC CHW: 3 bilingual CHWs delivered 10 weekly education individual sessions. Follow-up telephone calls. CM: 2 registered nurses worked with patients individually for diabetes education and monitoring. Monthly visits and monthly phone calls as needed SPC: Usual care Culturally appropriate component: Incorporating patient cultural and spiritual beliefs for CHW group; using culturally appropriate educational materials based on stages of change for CM group |
3-group RCT with 2 treatment and 1 control groups 6 months |
Exercise at least 3 times per week Self-reported PA |
CHW (n = 75): Baseline n = 21 (28%), 6-month n = 47 (63%), p < .05 within groups at 6-month follow-up CM (n = 60): Baseline n = 15 (25%), 6-month n = 23 (38%), p < .05 between groups at 6-month follow-up SPC (n = 54): Baseline n = 9 (17%), 6-month n = 19 (35%), p < .05 within groups at 6-month follow-up PA improved in CHW and SPC |
|
Coleman et al. (2012); N = 868; females, mean age = 52 (65% Mexican and 35% Central/South American) at-risk for developing CVD, HTN, or hyperlipidemia |
Behavior change theory |
Bilingual CHWs delivered intervention of three 50- minute, individually tailored 1:1 counseling sessions at 1 month, 2 months, and 6 months Culturally appropriate component: Not specified |
2-group RCT 6 months |
Self-reported PA; Physical Activity Assessment Survey |
Moderate PA CG: Baseline 328 (75%), follow-up 335 (77%), OR (95% Cl)= 1.10 [0.80, 1.50], p = .57 IG: Baseline 309 (71%), follow-up 365 (84%), OR (95% Cl) =2.19 [1.57, 3.07], p<. 001 Vigorous PA CG: Baseline 69 (16%), Follow-up 75 (17%), OR (95% Cl)= III [0.77, 1.59], p = . 58 IG: Baseline 57 (13%), follow-up 143 (33%), OR (95% Cl) = 3.37 [2.38, 4.77], p<. 001 IG group had significant results |
|
Duggan et al. (2014); N = 320; female 70.6%, male 29.4%, mean age = 50.6 years ( 100% Hispanic/Latino), 67% TD2M |
No theory specified | Educational curriculum provided by CHWs at participants’ homes 5 weekly guided sessions on diabetes education Culturally appropriate component: Not specified |
2-group RCT 6 months |
Self-reported PA IPAQ |
Leisure time PA mean (SE) IG 3 months: Vigorous = 0.96 (0.2), p = .09; moderate = 2.13 (0.2), p = .13; mild = 3.59 (0.2), p = .72 CG 3 months: Vigorous = 0.72 (0.1); moderate = 1.76 (0.2); mild = 3.67 (0.2) No significant results |
|
Eakin et al. (2007); N = 135, 6 weeks; N = 162, 6 months; female 78.5%, male 21.5%, mean age (SD) intervention group = 50 (13), control group = 49 ( 13); Hispanic (75%) with 1 or more chronic health conditions (HTN, heart disease, T2DM) |
Socioecological model and behavioral– ecological approach for intervention development |
Health educator conducted two f2f self- management support and community linkage sessions, 60-90 minutes, 3 months apart. Phone calls at 2, 6, and 14 weeks 3 tailored newsletters reinforcing behavior change goals Culturally appropriate component: Intervention culturally adapted and translated into Spanish |
2-group RCT 6 months |
Two PA outcome variables: Total minutes of walking/week Yes/No dichotomous measure whether meeting guidelines of 30 minutes/day of moderate PA at the rate of least 5 days/week or 20 minutes/day of vigorous PA at least 3 days/week |
Change in minutes of walking/week: IG: Baseline 60 (0–840) total minutes walking/week [median and range] 6 weeks: 11 ± 20 6 months: 16 ± 20 Wald F(2) = 2.04, p = . 132 CG: Baseline 70 (0–840) total minutes walking/week [median and range] 6 weeks: 47 ± 23 6 months: — 1 1 ±23 No significant results |
|
Hawkins et al. (2015); N = 68; females, no mean age provided (100% Hispanic), gestational diabetes |
TTM and SCT | 6 monthly f2f counseling sessions and 5 telephone booster sessions Contacts provided by bicultural and bilingual health educators encouraging PA ≥30 minutes of moderate-intensity activity on most days of the week Pedometer provided to participants Culturally appropriate component: Intervention based on individually tailored strategies to promote diet and PA change among Hispanic populations. All materials available in English and Spanish |
2-group pilot RCT 6 weeks postpartum |
MET hours/week measured by Pregnancy Physical Activity Questionnaire |
Smaller reduction of moderate-intensity PA from baseline to mid- pregnancy compared with CG (mean ± SE = –23.4 ± 16.6 MET hours/week vs. –27.0 ± 16.2 MET hours/week, p = .88) IG: Vigorous-intensity PA increase 1.6 ± 0.8 MET hours/week CG: –0.8 ± MET hours/week in CG, p = .004 Small baseline to postpartum increase 0.5 ± 0.5 MET hours/week vs. –0.9 ± 0.5 MET hours/week, p = .046 Vigorous PA increased in IG |
|
Hovell et al. (2008); N = 137; females, mean age (SD) = 31.36 (6.21); 100% Hispanic, country of origin Mexico 96.7%, other 3.3%, 70% of participants obese |
Operant learning theory and applied behavior analysis |
Three weekly 90-minute aerobic exercise group sessions for 6 months held in a community setting. Bilingual Latina aerobics instructor-led vigorous, low-impact aerobic dance sessions 30 minutes of exercise/diet education with “hands- on” learning activities Culturally appropriate component: Bilingual health educators and guest speakers provided culturally tailored, low-literacy education on home safety and selected disease prevention topics unrelated to exercise, diet, or CVD to CG. Education component following exercise segment included exercise and diet education with “hands-on” learning activities culturally appropriate for low-literacy Latinas for IG |
2-group RCT 12 months |
Self-reported PA via question Direct PA observation |
Minutes (min) of activity per 2 weeks as percentiles of PA measures IG Vigorous exercise: Baseline: 9 min 70th, 61 min 80th, 191 min 90th Posttest 90 min 30th, 180 min 40th, 270 min 50th, 360 min 60th, 360 min 70th, 392 min 80th, 486 min 90th, p < .001 Follow-up: 38 min 60th, 138 min 70th, 300 min 80th, 399 min 90th Walking: Baseline: 40 min 90th Posttest 35 min 50th, 60 min 60th, 90 min 70th, 180 min 80th, 271 min 90th, p < .001 Follow-up: 30 min 70th, 60 min 80th, 159 min 90th Moderate exercise: Baseline: 6 min 60th, 53 min 70th, 120 min 80th, 333 min 90th Posttest 60 min 60th, 102 min 70th, 156 min 80th, 280 min 90th, p = .310 Follow-up: 6 min 60th, 60 min 70th, 92 min 80th, 240 min 90th CG; vigorous exercise: Baseline: 30 min 90th Posttest 82 min 80th, 180 min 90th, p < .001 Follow-up: 99 min 90th Walking: Baseline: 85 min 90th Posttest 50 min 70th, 90 min 80th, 149 min 90th Follow-up: 36 min 80th, 198 min 90th Moderate exercise: Baseline: 40 min 60th, 80 min 70th, 144 min 80th, 289 min 90th Posttest 12 min 60th, 40 min 70th, 108 min 80th, 198 min 90th Follow-up: 22 min 60th, 60 min 70th, 120 min 80th, 152 min 90th IG had significant results |
|
Khare etal. (2014); N= 155; females, mean age (SD) = 50.87 (6.88); Mexican or Central American |
SCT and TTM | CVD risk factor screening, related educational handout, PRN physician care referral, follow-up assessment at 1 and 2 years from baseline, postcards and newsletter for both groups IG received 12-weekly lifestyle change f2f intervention sessions and extra orientation session for family members Culturally appropriate component: Not specified |
2-group RCT 12 months |
CHAMPS summary scores Hours/week in all PA |
Increases in all PA and moderate-intensity PA within groups: All PA: IG: Baseline: all PA 8.45 ± 5.36 Postintervention: 13.53 ± 6.59, F = 20.94, p < .01 1 year 8.48 ± 5.73, F < 0.01, p = .99 CG: Baseline: all PA 8.81 ±5.18 Postintervention: 11.11 ± 7.74, F = 3.89, p = .05 1 year 10.00 ± 5.61, F = 0.72, p = .40 Moderate Intensity PA: CG: Baseline: all PA 2.57 ± 2.89 Postintervention: 5.06 ± 3.73, F = 15.95, p < .01 1 year 3.26 ± 3.17, F = 0.79, p = .38 CG: Baseline: all PA 2.99 ± 3.33 Postintervention: 4.41 ± 4.92, F = 3.59, p = .06 1 year 3.81 ± 3.87, F = 0.57, p = .45 No significant results |
|
King et al. (201 3); N = 39; female 65%, male 35%; mean age (SD) = 72.1 (8.2); 92.5% Hispanic, country of origin 40% Mexico, 40% U.S., 20% other; with previous health conditions |
TTM and SCT | 4-month ECA PA intervention delivered through a computer in a local community senior center Participants encouraged to complete virtual advisor sessions regularly Pedometer provided to participants Culturally appropriate component: 12 months of participatory formative research and evaluation to enhance ECA cultural and linguistic congruity for Latino and, to some extent, Filipino older adults |
2-group RCT 4 months |
CHAMPS Questionnaire Walking changes at baseline, 2 months, and 4 months |
4-month changes in mm/walking/week CG: M change 26.8 (67.0) Virtual advisor IG: Al change 253.5 (248.7) Between-group difference: 226.8, 95% Cl = [ 107.0, 346.4], F( 1,38) = 13.6, p = .0008 IG had significantly more steps |
|
Koniak-Griffin et al. (2015); N = 223; females, mean age (SD) = 44.6 (7.9); 84% Mexican, 14% Dominican, Central or South American, 2% born in the United States but raised in Mexico, with T2DM and HTN |
No theory specified |
Mujeres Sonos y Precavidas 6-month lifestyle intervention consisting of group education plus individual teaching and coaching Eight 2-hour weekly classes for first 2 months Individual teaching and coaching had 8 contacts delivered over 4 months (4 home visits plus 4 telephone calls). Personal goals established by participants for lifestyle changes. Messages included increasing PA to 10,000 steps per day; PA diaries provided Accelerometer provided to participants Culturally appropriate component: Classes based on culturally relevant, promotora-led educational program developed for Latino communities by National Heart, Lung, and Blood Institute |
2-group RCT 9 months |
Daily steps via accelerometer | IG: Baseline: 8,579 ± 3,268 6 months: 8,769 ± 2,747 9 months: 8,577 ± 2,872 Contrast t = 2.07, df = 201, p = .04 CG: Baseline: 8,571 ± 3,130 6 months 8,480 + 3,506 9 months 7,241 ± 2,764 IG had more steps |
|
Marcus et al. (2016); N = 218; females, mean age (SD) = 39.2 (10.47); 87.3% Hispanic, 84.4% Mexican American, 3.4% Colombian, 1.0% Guatemalan, 1.0% Puerto Rican, 0.5% Dominican Republic, 12.7% other |
SCT and TTM | Participants provided with study website access, including self-monitoring of minutes of activity and steps Components included goal setting, message board for support, “ask the expert,” maps for walking routes, and exercise videos Monthly questionnaires generated tailored PA reports, including information on current stage of motivational readiness for PA, comparison of participants with other individuals who are physically active, comparison of participant responses with previous responses, and useful PA facts Weekly email prompts to access intervention website in Month 1, biweekly in Months 2 and 3, and monthly during Months 4-6 Culturally appropriate component: nonspecific culturally and linguistically adapted, individually tailored, Internet-based PA intervention |
2-group RCT 6 months |
Accelerometer PA total min/week 7-day PAR Questionnaire |
IG: Baseline: 8.0 (SD = 15.0) min/week MVPA 6 months: 1 12.8 (SD = 97.1) min/week MVPA CG: Baseline: 10.44 (SD = 23.98) min/week MVPA 6 months: 63.5 (SD = 88.7) min/week MVPA Adjusted model: IG had 50.0 more min/week of MVPA at 6 months compared with CG (adjusting for baseline), SE = 9.5, p = .01 IG had more steps |
|
Marcus et al. (2013); N = 266; females, mean age (SD) =41.61 (10.07); 34.1% Dominican, Colombian 30.3%, 10.6% Puerto Rican, 6.8% Guatemalan, 5.3% Mexican, American or Chicana, other 12.9%, with increased BMI |
TTM and SCT | Print interventions to increase PA, 4 mailings in Month 1, 2 mailings in Months 2 and 3, and 1 mailing in Months 4–6 Pedometer provided to participants Culturally appropriate component: Formative research conducted to culturally and linguistically adapt intervention for Latinas, and adapted intervention tested in a pilot study |
2-group RCT 6 months |
3 psychosocial measures at baseline, 3 months via mail, and 6 months f2f to develop intervention 7-day PAR Questionnaire |
Mean (SD) min/week of MVPA IG: 6 months: 73.36 (89.73), M = 41.36 (SE = 7.93), p < .01 CG: 6 months: 32.98 (82.82) IG had significant results |
|
Marshall et al. (2013); N = 180; females, mean age (SD) Intervention 1 36.94 (8.86), Intervention 2 35.27 (8.76), Intervention 3 35.42 (8.41); 100% Latina, country of origin Intervention 1 Mexico 98.2%, U.S. 1.8%, Intervention 2 Mexico 94%, U.S. 2%, other 4%, Intervention 3 Mexico 94.6%, U.S. 3.4%, with increased BMI |
Behavioral and socioecological models for Latino health promotion and Communication Persuasion Model |
12-week Spanish language PA program (Pasos Adeiante). Weekly 1-hour group meetings led by a promotora Intervention 1 self-selected step goal, Intervention 2 10,000 steps/day, Intervention 3 3,000 steps in 30 minutes Culturally appropriate component: Culturally targeted and tailored flyers, letters, friend referral, presentations at community gatherings and parent-teacher meetings, and incentives to follow recommendations for recruiting minorities and underserved populations |
3-group RCT with 2 treatment and 1 control groups 3 months Pedometers provided to participants |
Accelerometer-based PA measured at baseline and after 12 weeks |
Median minutes of moderate-to-vigorous-intensity physical activity (fAVPA) Intervention 1: Baseline 17, postintervention 22 Intervention 2: Baseline 13, postintervention 15 Intervention 3: Baseline 13, postintervention 29 Least square mean difference test Estimate (SE) Intervention 1 vs. 2: 0.1967 (0.1910), p = .3029 Intervention 1 vs. 3: 0.3581 (0.1905), p = .0601 Intervention 2 vs. 3: 0.1613 (0.1498), p = .2815 No significant results |
|
McEwenetal. (2017); NT1, = 157, NT2 = 105, NT3 = 87; Participant: female 65%, male 35%, mean age (SD) = 53.53 (9.0); Mexican American 100%, with T2DM, increased BMI Family: female 72.6%, male 27.4%, mean age (SD) =47.27 (16.1); Mexican American 100%, with increased BMI |
No theory specified | 12-week intervention program with six weekly 2- hour education (led by a certified diabetes educator registered nurse) and social support (led by promotoras) sessions focused on managing diabetes Three weekly 2-hour home visits and three 20- minute phone calls completed by promotoras Goals established in group sessions and evaluated/ refined as needed in home visits. Phone calls completed to check participants’ progress or barriers in meeting goals Wait-list: 2-hour education sessions weekly for 3 weeks Culturally appropriate component: Mexican American participants with T2DM and family members participated in focus groups to inform intervention using community-based participatory research principles |
2-group experimental repeated measures with dyad cohorts and wait list control 6 months |
IPAQ; MET minutes per week |
IPAQ Vigorous activity: MET minutes/week, mean (SD) T1Control = 1706.05 (3222.0) T1Intervention = 1939.53 (4444.2) T2control = 1887.44 (4090.0) T2Intervention = 2003.72 (3381.4) T3control = 2081.86 (5343.2) T3Intervention = 2138. 16 (4425.8) F (df), P Group × Time: 0.01 (1.9, 155.7), .984 Contrast T1 vs. T2 0.01 (1, 84), .906 Contrast T2 vs. T3 0.002 (1, 84) .963 IPAQ Moderate activity: MET minutes/week, mean (SD) T1Control = 1600.00 (3195.0) T1Intervention = 639.50 (1336.0) T2control = 1135.79 (2217.0) T2Intervention= 1 165.50 (1873.2 T3control = 1271.58 (2077.0) T3Intervention = 1057.50 (2306.8) F (df), P Group × Time 1.26 (1.8, 136.1), .285 Contrast T1 vs. T2 2.86 (1, 76), .095 Contrast T2 vs. T3 0.17 (1, 76), .686 IPAQ Walking: MET minutes/week, mean (SD) T1Control= H05.93 (1860.6) T1Intervention = 762.67 (1400.2) T2control = 1790.25 (2820.5) T2Intervention = 1669.71 (3108.4) T3control = 1829.33 (3022.0) T3Intervention = 1390.13 (2200.0) F (df), P Group × Time 0.09 (2, 144), .915 Contrast T1 vs. T2 0.08 (1, 72), .778 Contrast T2 vs. T3 0.15 (1, 72), .697 IPAQ Total activity: MET minutes/week, mean (SD) T1Control = 3877.17 (5284.2) T1Intervention =4278.16 (7291.3) T2control =4406.01 (7090.4) T2Intervention = 4874. 10 (6803.7) T3control = 5027.09 (8791.5) T3Intervention = 4322.76 (7294.5) F (df), P Group × Time 0.25 (2, 190), .783 Contrast T1 vs. T2 0.001 (1, 95), .970 Contrast T2 vs. T3 0.38 (1, 95), .538 No significant results |
|
Mitchell et al. (2015); N = 254; female 72%, male 28%, mean age (SD) = 33.2 (7.8) female, 30.2 (7.0) male (Latino 100%), with increased BMI |
No theory specified | Ten weekly 90-minute sessions with PA for 15–20 minutes, with participants sharing a healthy snack and promising to improve lifestyle Culturally appropriate component: Use of a Mexican specialist to create intervention program and development of culturally and linguistically appropriate low-literacy materials |
RCT 12–14 weeks |
PA changes in days/week performing at least 30 minutes of PA, days/ week of at least 10 minutes of PA producing moderate heart and respiratory rate increases, and days/week of at least 10 minutes of PA producing large increases in heart and respiratory rate PA Confidence Scales and Behavioral Risk Factor Surveillance System 2009 questionnaire |
Nonwork PA in days/week: At least 30 minutes: CG: 2.1 (1.6–2.6) IG: 3–7 sessions 2.5 (1.7–3.3) IG: 8–10 sessions 3.2 (2.8–3.7) p = .004 Moderate PA: CG: 2.8 (2.2–3.4) IG: 3–7 sessions 3.7 (2.8–4.7) IG: 8–10 sessions 3.8 (3.3–4.3) p = .022 Vigorous PA: CG: 1.4 (1.0–1.9) IG: 3–7 sessions 1.3 (0.5–2.1) IG: 8–10 sessions 1.7 (1.3–2.1) p = 0.60 Total PA increased with attendance, except for vigorous PA |
|
Pekmezi et al. (2009); N = 93; females, mean age (SD) = 41.37 (1 1.18); Dominican 35%, Colombian 3 1%, Puerto Rican 1 1%, Guatemalan 10%, other 13%, with increased BMI |
TTM and SCT | IG: Six monthly PA manual mailings matched to participants’ current level of motivational readiness and individually tailored computer expert-system feedback reports CG: Six monthly mailings of health information on topics other than PA Culturally appropriate component: Cultural and linguistic adaptation of an existing empirically supported, computer-tailored PA intervention. Formative research on individually tailored PA print intervention conducted by bilingual/ bicultural staff. |
2-group RCT 6 months |
7-day PAR |
Mean min/week of at least moderate-intensity PA mean (SD) IG: Baseline: 16.56 (25.76), 6 months: 147.27 (241.55) F(l, 91) = 1.37, p = .25 CG: Baseline 1 1.88 (21.99), 6 months 96.79 (1 18.49) No significant results |
|
Poston et al. (2001); N= 379; females, mean age (SD) = IG 39.2 (10.6), CG 40.0 (6.4); Mexican American 100%, with increased BMI |
SCT | Weekly 90-minute meetings for 6 months led by bilingual Mexican American health professionals Content used individually oriented behavioral techniques with culturally compatible strategies Culturally appropriate content: Use of bilingual materials and instructors/peer leaders, modification of native diets, culturally tailored rationales for diet and activity modification, and use of established social support networks |
2-group RCT 12 months |
7-day PAR |
Mean (SD) for PA (kcal/kg/day) Baseline: IG 35.0 (3.8), CG 36.3 (4.2) 6 months: IG 36.2 (6.2), CG 37.6 (6.5) 12 months: IG 36.1 (5.0), CG 37.1 (4.8), p < .05 Activity in hours of moderate or greater activity per week Baseline: IG 8.1 (8.3), CG 1 1.3 (1 1.4) 6 months: IG 1 1.7 (1 1.2), CG 14.0 (16.4) 12 months: IG 10.5 (8.8), CG 12.9 (12.0), p < .05 IG group had more hours of moderate or greater PA and PA in kcal/ kg/day |
|
Rosal et al. (201 1); N = 252; female 77%, male 23%, age 18–44 16.3%, 45–54 29.8%, 55–64 32.9%, ≥65 21.0% (Puerto Rican 87.7%), with T2DM |
SCT | 12 weekly sessions and follow-up phase of 8 monthly sessions. Week 1 60-minute session at participant’s home. Subsequent weekly 150- minute sessions in groups at community settings, with first 60 minutes of personalized counseling and cooking, and last 90 minutes of group protocol and meal Sessions delivered by nutritionist, health educator, or trained lay person Pedometer provided to participants Culturally appropriate component: Cultural tailoring included use of an educational soap opera to introduce self-management information and model attitudinal change and desired behaviors in the context of culturally relevant situations, use of bingo games to reinforce information taught, emphasis on making traditional foods healthier via healthy preparation methods, and addressing family preferences |
2-group RCT 12 months |
PA Survey question MET or total time of walking, sitting, or PA |
Self-report walking for exercise IG: Baseline: 61.3% 4 months: 88.4%, p = .057 12 months: 70.9%, p = .435 CG: Baseline: 52.3% 4 months: 70.9%, p = .057 12 months: 66.4%, p = .435 No significant results reported for PA |
|
Rosal et al. (2005); N = 25; female 80%, male 20%, mean age (SD) = 62.6 (8.6); Puerto Rican 100%, with T2DM |
SCT | Individual initial 60-minute session and two 15- minute individual sessions preceding group sessions Ten weekly 150–180-minute group sessions targeting diabetes knowledge, attitudes, and self-management skills. Delivered by diabetes nurse, nutritionist, and assistant Booklet describing importance of lifestyle factors and recommendations for diet, PA, and self- monitoring blood glucose Drama (soap opera) developed to convey messaged discussed at each session Culturally appropriate component: Intervention tailored to low-literacy needs and imparted through culturally familial experiences in English and Spanish. |
2-group pilot RCT 6 months |
CHAMPS Questionnaire (modified version) |
Kilocalories/week mean (SD) IG: Baseline 660 (705) 3 months: 439 (935) 6 months: 272 (929) p = .1 1 CG: Baseline 976 (1,154) 3 months 180 (1,262) 6 months 512 (967) p = .1 1 No significant results |
|
Rothschild et al. (2014); N = 144; female 67.4%, male 32.6%, mean age (SD) = 53.7 (12.2); Mexican American 100%, with T2DM |
Self-Management Theory |
Baseline evaluations in 2 separate encounters approximately 30 days apart 36 home visits over 2 years, average visit duration 99 minutes. CHWs delivered behavioral self- management training. Sessions focused on knowledge and skills in diabetes self- management with goal-setting Culturally appropriate content: CHWs taught in the participants’ preferred language and used culturally appropriate examples or metaphors |
2-group RCT 24 months |
PA Subscales of Diabetes Self-Care Activities and Diabetes Empowerment Scale Mean days/week of PA |
IG: Baseline 1.63 days/week 2 years: 2.64 days/week No significant results provided |
|
Vincent (2009); N = 17; female 71%, male 29%, mean age 56 (Mexican American 100%), with T2DM |
Chronic Disease Self- Management Model based on SCT |
Eight weekly 120-minute sessions Sessions consisted of didactic content related to diabetes and taught by bilingual certified diabetes educator. Also, promotoras led cooking demonstrations, and group sessions as well as calling participants weekly. Pedometers provided to participants Culturally appropriate component: Content included low-fat modifications of traditional foods, discussing use of traditional home remedies, and emphasizing culturally appropriate exercise strategies such as walking and dancing for Mexican Americans. Participants were also encouraged to bring a family member as a support person. Participants received low-literacy materials in Spanish to share with family members. |
2-group RCT PA measure: step count with pedometer, daily record on log 3-month follow-up |
Steps per day IG: Baseline: 4,175 8 weeks: 7,238 t = –2.51, p = .03 CG: No data provided IG had more steps per day |
|
Note. 7-day PAR = 7-Day Physical Activity Recall; BMI = body mass index; CHAMPS = Community Healthy Activities Model Program for Seniors; CHW = community health worker; CM = case management; CVD = cardiovascular disease; ECA = embodied conversational agent; HTN = hypertension; IPAQ = International Physical Activity Questionnaire; f2f = face-to-face; MET = metabolic equivalent task; MVPA = moderate-to- vigorous physical activity; OR = odds ratio; PA = physical activity; RCT = randomized controlled trial; SCT = social cognitive theory; SD = standard deviation; SE: standard error; SPC = standard provider care; T2DM = type 2 diabetes mellitus; TTM = transtheoretical model
Participant Characteristics
Almost half (48%) of the studies reported participant country of origin (Coleman et al., 2012; Hovell et al., 2008; Khare, Cursio, Locklin, Bates, & Loo, 2014; King, Bickmore, Campero, Pruitt, & Yin, 2013; Koniak-Griffin et al., 2015; Marcus et al., 2013; Marcus et al., 2016; Marshall et al., 2013; Pekmezi et al., 2009; Rosal et al., 2011) or self-identified ancestry, and 16 studies referred to participants as Hispanic/Latino (Arre-dondo et al., 2017; Babamoto et al., 2009; Coleman et al., 2012; Duggan et al., 2014; Hawkins et al., 2015; Hovell et al., 2008; Khare et al., 2014; Koniak-Griffin et al., 2015; Marshall et al., 2013; Mitchell, Andrews, & Schenker, 2015; Pekmezi et al., 2009; Poston et al., 2001; Rosal et al., 2005; Rosal et al., 2011; Rothschild et al., 2014; Vincent, 2009). Almost half (48%) of the studies had at least some participants who self-identified as Mexican or Mexican American (Arre-dondo et al., 2017; Coleman et al., 2012; Hovell et al., 2008; Koniak-Griffin et al., 2015; Marcus et al., 2016; Marshall et al., 2013; McEwen, Pasvogel, Murdaugh, & Hepworth, 2017; Poston et al., 2001; Rothschild et al., 2014; Vincent, 2009). Other countries of origin represented in the study samples were Mexico, Puerto Rico, Dominican Republic, Guatemala, and Colombia (Koniak-Griffin et al., 2015; Marcus et al., 2013; Marcus et al., 2016; Pekmezi et al., 2009; Rosal et al., 2011). All but two studies (Eakin et al., 2007; King et al., 2013) had study samples that were 100% Hispanic.
All studies had a majority of female participants, with 11 studies reporting 100% female participants (Arredondo et al., 2017; Coleman et al., 2012; Hawkins et al., 2015; Hovell et al., 2008; Khare et al., 2014; Koniak-Griffin et al., 2015; Marcus et al., 2013; Marcus et al., 2016; Marshall et al., 2013; Pekmezi et al., 2009; Poston et al., 2001). Sample sizes varied from 20 to 1,093 participants, and only two studies had participants that were older than64 years of age (King et al., 2013; McEwen et al., 2017). Most participants were between the ages of 18 and 64, and study samples were relatively homogenous. Men and older adults were underrepresented, with only half (48%) of the studies enrolling male participants (Babamoto et al., 2009; Duggan et al., 2014; Eakin et al., 2007; King et al., 2013; McEwen et al., 2017; Mitchell et al., 2015; Rosal et al., 2005; Rosal et al., 2011; Rothschild et al., 2014; Vincent, 2009). No study had greater than 36% male participants.
Most of the studies (19 of 21) reported the health status of participants through measures such as diagnosed medical conditions or risk factors (e.g., elevated body mass index [BMI] or HTN). Two studies did not provide health status information (Khare et al., 2014; Marcus et al., 2016). Health indicators reported were BMI (Hovell et al., 2008; Marcus et al., 2013; Marshall et al., 2013; McEwen et al., 2017; Mitchell et al., 2015; Pekmezi et al., 2009), diabetes mellitus (Arredondo et al., 2017; Duggan et al., 2014; Koniak-Griffin et al., 2015; Rosal et al., 2005; Rosal et al., 2011; Rothschild et al., 2014; Vincent, 2009), multiple health conditions (Arredondo et al., 2017; Eakin et al., 2007; King et al., 2013), gestational diabetes (Hawkins et al., 2015), and hyperlipidemia (Babamoto et al., 2009; Coleman et al., 2012).
Duration of Studies
The follow-up period ranged from 3 to 24 months; however, most (62%) studies had follow-up periods between 3 and 6 months (Babamoto et al., 2009; Coleman et al., 2012; Duggan et al., 2014; Eakin et al., 2007; King et al., 2013; Marcus et al., 2013; Marcus et al., 2016; Marshall et al., 2013; McEwen et al., 2017; Mitchell et al., 2015; Pekmezi et al., 2009; Rosal et al., 2005; Vincent, 2009). One study followed participants for 6 weeks postpartum (Hawkins et al., 2015). One study had a follow-up period of 9 months (Koniak-Griffin et al., 2015). Five studies had follow-up periods of 12 months (Arredondo et al., 2017; Hovell et al., 2008; Khare et al., 2014; Poston et al., 2001; Rosal et al., 2011). Only one study (Rothschild et al., 2014) followed participants for 12 months or longer.
Measures
Studies in this review used a wide variety of PA measures (Table 2). Some studies measured only the amount of activity (e.g., minutes, hours, days of PA), while others measured the amount and type of activity (e.g., mild, moderate, or vigorous). There were studies that measured kilocalories or metabolic equivalent minutes, while others did not measure these variables.
Table 2.
Outcome Measures Used in Studies.
| PA Measure | Study |
|---|---|
| Days per week of PA | Rothschild et al. (2014) |
| Exercise at least 3 times per week | Babamoto et al. (2009) |
| MET minutes of leisure-time and | Hawkins et al. (2015), McEwen |
| weekly PA | et al. (2017) |
| Number of days participants | Mitchell et al. (2015) |
| completed 30 minutes of PA | |
| Percentage of participants | Coleman et al. (2012) |
| reporting MVPA | |
| Difference in leisure-time mild, | Duggan et al. (2014) |
| moderate, and vigorous PA | |
| Percentiles of participants | Coleman et al. (2012), Duggan |
| engaging in walking, moderate | et al. (2014), Hovell et al. |
| exercise, and vigorous exercise | (2008) |
| Minutes of walking per week | Eakin et al. (2007), Rosal et al. (2011) |
| (2011) | |
| Minutes of walking per day | Koniak-Griffin et al. (2015) |
| Minutes of MVPA | Marshall et al. (2013) |
| MET hours per day and total PA | Rosal et al. (2011) |
| duration in hours per day | |
| Change in weekly MVPA in | Arredondo et al. (2017), Marcus |
| minutes | et al. (2013), Marcus et al. (2016) |
| (2016) | |
| Percentage of participants engaged | Hovell et al. (2008) |
| in aerobic activity | |
| PA in hours of moderate or | Khare et al. (2014), Pekmezi et al. |
| greater activity per week | (2009), Poston et al. (2001) |
| Change in kilocalories as a | Poston et al. (2001), Rosal et al. |
| measure of PA | (2005) |
| Mean number of participant steps | King et al. (2013), Koniak-Griffin |
| et al. (2015), Vincent (2009) | |
Note. PA = physical activity; MET = metabolic equivalent; MVPA = moderate- to-vigorous physical activity.
Interventions
Theoretical Frameworks.
Sixteen studies (Arredondo et al., 2017; Coleman et al., 2012; Eakin et al., 2007; Hawkins et al., 2015; Hovell et al., 2008; Khare et al., 2014; King et al., 2013; Marcus et al., 2013; Marcus et al., 2016; Marshall et al., 2013; Pekmezi et al., 2009; Poston et al., 2001; Rosal et al., 2005; Rosal et al., 2011; Rothschild et al., 2014; Vincent, 2009) reported a guiding framework and six interventions were based in transtheoretical model of change (TTM) and social cognitive theory (SCT; Hawkins et al., 2015; Khare et al., 2014; King et al., 2013; Marcus et al., 2013; Marcus et al., 2016; Pekmezi et al., 2009). Guiding theories included SCT (Poston et al., 2001; Rosal et al., 2005; Rosal et al., 2011; Vincent, 2009), the socioecological model (Arredondo et al., 2017; Eakin et al., 2007; Marshall et al., 2013), behavior change theory (Coleman et al., 2012), operant learning theory and applied behavior analysis (Hovell et al., 2008), and self-management theory (Rothschild et al., 2014). Nine studies that mentioned a theoretical framework had statistically significant results (Arredondo et al., 2017; Coleman et al., 2012; Hawkins et al., 2015; Hovell et al., 2008; King et al., 2013; Marcus et al., 2013; Marcus et al., 2016; Poston et al., 2001; Vincent, 2009). Of those with significant results, six used either SCT or a combination of SCT and the TTM (Hawkins et al., 2015; King et al., 2013; Marcus et al., 2013; Marcus et al., 2016; Poston et al., 2001; Vincent, 2009). Other studies with statistically significant results used behavior change theory (Coleman et al., 2012), ecological framework (Arredondo et al.,2017), and operant learning theory (Hovell et al., 2008).
Delivery of Interventions.
There were different modalities of intervention delivery described in the studies. Nine studies used community health workers (CHWs) or promotoras (i.e., lay health advisors; Martinez, Arredondo, & Roesch, 2013) to engage participants in the interventions (Arredondo et al., 2017; Babamoto et al., 2009; Coleman et al., 2012; Duggan et al., 2014; Koniak-Griffin et al., 2015; Marshall et al., 2013; McEwen et al., 2017; Mitchell et al., 2015; Vincent, 2009). Promotoras not only facilitated intervention sessions but also typically participated by engaging in PA behaviors themselves. Studies that used promotoras (Arredondo et al., 2017; Babamoto et al., 2009; Koniak-Griffin et al., 2015; Marshall et al., 2013; McEwen et al., 2017; Mitchell et al., 2015; Vincent, 2009) delivered face-to-face educational sessions at a predetermined location or at the participant’s home. The rest of the studies used research staff (i.e., professionals) to deliver interventions (Coleman et al., 2012; Duggan et al., 2014; Eakin et al., 2007; Hawkins et al., 2015; Hovell et al., 2008; Khare et al., 2014; King et al., 2013; Marcus et al., 2013; Marcus et al., 2016; Pekmezi et al., 2009; Poston et al., 2001; Rosal et al., 2005; Rosal et al., 2011; Rothschild et al., 2014). Most studies used face-to-face educational sessions (Arredondo et al., 2017; Babamoto et al., 2009; Coleman et al., 2012; Duggan et al., 2014; Eakin et al., 2007; Hawkins et al., 2015; Hovell et al., 2008; Khare et al., 2014; Koniak-Griffin et al., 2015; Marshall et al., 2013; McEwen et al., 2017; Mitchell et al., 2015; Poston et al., 2001; Rosal et al., 2005; Rosal etal., 2011; Rothschild etal., 2014; Vincent, 2009), and nine of these had significant results (Arredondo et al., 2017; Babamoto et al., 2009; Coleman et al., 2012; Hawkins et al., 2015; Hovell et al., 2008; Koniak-Griffin et al., 2015; Mitchell et al., 2015; Poston et al., 2001; Vincent, 2009). Three studies provided print materials via mail to engage participants in PA behaviors (Arredondo et al., 2017; Marcus et al., 2013; Pekmezi et al., 2009), one study used a computer to deliver the PA intervention (King et al., 2013), and one study emailed materials to participants (Marcus et al., 2016). Of five studies that used non-face-to-face contact, four had significant results (Arredondo et al., 2017; King et al., 2013; Marcus et al., 2013; Marcus et al., 2016).
Intervention Content and Dose.
Interventions varied with regard to the use of strategies to enhance, and measure, PA. Eight studies provided pedometers to the participants as well as activity logs to track PA (Hawkins et al., 2015; King et al., 2013; Koniak-Griffin et al., 2015; Marcus et al., 2013; Marshall et al., 2013; Pekmezi et al., 2009; Rosal et al., 2011; Vincent, 2009); five had significant results (Hawkins et al., 2015; King et al., 2013; Koniak-Griffin et al., 2015; Marcus et al., 2013; Vincent, 2009). Three studies provided accelerometers and had significant results (Arredondo et al., 2017; Koniak-Griffin et al., 2015; Marcus et al., 2016). Studies that provided pedometers to participants also provided logs to record PA. Hence, participants were aware of the measurement of PA by pedometer and also of the timeframe of data collection.
One study used a virtual advisor with an embodied conversational agent on a computer at a community senior center (King et al., 2013). One study designed an aerobic intervention with a Latina aerobics instructor, which included dance sessions accompanied by salsa/merengue music (Hovell et al.,2008). Two studies used print materials that were personalized to the participant’s current state of motivational readiness for PA and tip sheets on selected topics such as stretching or measuring heart rate (Marcus et al., 2013), and mailings of PA manuals matched to the participants’ current level of motivational readiness (Pekmezi et al., 2009).
Twelve (57%) studies reported significant improvement in PA from pre- to postintervention. Eight of 10 studies that listed walking as the primary intervention for PA had significant results (Arredondo et al., 2017; Coleman et al., 2012; Hovell et al., 2008; King et al., 2013; Marcus et al., 2013; Marcus et al., 2016; Marshall et al., 2013; Vincent, 2009). Also, one study featured a combination of dancing and walking (Vincent, 2009) and one study dancing alone (Hovell et al., 2008) as the primary modes of PA. The study that had dancing alone as the PA behavior also had statistically significant results with more participants engaging in the PA behavior postintervention (Hovell et al., 2008). The study that had a combination of dancing and walking also had statistically significant results (Vincent, 2009).
The educational sessions covered PA topics such as walking, leisure-time activity, and self-management of diabetes (Arredondo et al., 2017; Babamoto et al., 2009; Coleman et al., 2012; Duggan et al., 2014; Hawkins et al., 2015; Hovell et al., 2008; Koniak-Griffin et al., 2015; McEwen et al., 2017; Rosal et al., 2005; Rosal et al., 2011; Vincent, 2009). Intervention sessions ranged in duration from 50 minutes (Coleman et al., 2012) to 2 hours (Koniak-Griffin et al., 2015). One study had only three intervention sessions delivered at 1 month, 2 months, and 6 months, with significant results (Coleman et al., 2012). Finally, one study provided biweekly or monthly educational materials (Pekmezi et al., 2009), but did not have significant findings.
Cultural Relevance of Interventions.
Many (81%) of the studies mentioned cultural appropriateness as part of intervention development. Furthermore, 67% of the studies described cultural appropriateness explicitly (Babamoto et al., 2009; Hawkins et al., 2015; Hovell et al., 2008; King et al., 2013; Koniak-Griffin et al., 2015; Marcus et al., 2013; Marshall et al., 2013; McEwen et al., 2017; Mitchell et al., 2015; Pekmezi et al., 2009; Poston et al., 2001; Rosal et al., 2005; Rosal et al., 2011; Vincent, 2009). Nine (43%) studies provided detail on how interventions were adapted to be culturally appropriate (Hawkins et al., 2015; Hovell et al., 2008; Marshall et al., 2013; McEwen et al., 2017; Pekmezi et al., 2009; Poston et al., 2001; Rosal et al., 2005; Rosal et al., 2011; Vincent, 2009). Four (19%) studies mentioned interventions as being culturally appropriate but did not provide specific cultural components (Babamoto et al., 2009; Eakin et al., 2007; Marcus et al., 2016; Rothschild et al., 2014). Four studies (19%) provided succinct explanations regarding culturally appropriate interventions (King et al., 2013; Koniak-Griffin et al., 2015; Marcus et al., 2013; Mitchell etal., 2015). Finally, four (19%) studies did not mention culturally appropriate component (Arredondo et al., 2017; Coleman et al., 2012; Duggan et al., 2014; Khare et al., 2014).
Discussion
Engaging in leisure-time PA at least 1 hour per day decreases the probability of obesity (Sarma, Devlin, Gilliland, Campbell, & Zaric, 2015) and reduces the risk for chronic health conditions, such as diabetes mellitus (Bell et al., 2014). This literature review identified effective strategies to increase PA among Hispanic adults. However, the studies in this review had mixed samples of Hispanics.
It is important to note that there may be differences between Hispanic adults related to country of origin. Evidence suggests that nearly 7 in 10 Hispanic adults do not believe that there is a shared culture among Hispanic populations in the United States (Taylor, Lopez, Martinez, & Velasco, 2012). Therefore, preferences of Hispanic participants may differ with regard to tailoring of PA interventions. For example, this review found that studies that incorporated dancing and music had significant findings. However, musical styles vary among Hispanic cultures; the music preferences of Mexicans may differ from those of Central Americans, for example (Turino, 2003). Hence, selecting culturally appropriate music that caters to the musical taste of the participants’ country of origin or ancestry may be an important factor in efforts to increase participation PA behaviors among Hispanics.
There is evidence to suggest that Hispanic populations experience disparities in the incidence of type 2 diabetes mellitus, when compared with other U.S. populations (Bullard et al.,2018). Effective PA interventions can address health disparities and reduce the incidence of obesity and diseases linked to inactivity, such as diabetes and cardiovascular disease.
The studies in this review had mixed samples of Hispanics. Mexican or Mexican American ancestry was self-reported by participants in 10 studies; however, the other 11 studies reported various countries of origin.
There were five studies (Hawkins et al., 2015; King et al., 2013; Pekmezi et al., 2009; Rosal et al., 2005; Vincent, 2009) with sample sizes of less than 100 participants, which may have limited the ability to detect intervention impact and differences between groups. Recruitment challenges or limited fiscal resources may have contributed to frequent small samples. Restricted age range may limit the generalizability of findings of this review. Most study participants were between 30 and 50 years of age, hence there was a lack of information about the impact of PA interventions among younger and older Hispanic adults.
The majority of the studies examined interventions based on walking. There was great variety in the way that PA was measured, with some studies focusing solely on the amount (e.g., number of minutes) of PA, while other studies focused on the amount and type of PA (e.g., mild vs. vigorous). Two studies suggested that individuals of Mexican American ancestry prefer walking to engage in PA (Mier, Medina, & Ory, 2007; Wood, 2002). While walking appeared to be a convenient and inexpensive PA strategy, future research should explore other forms of more vigorous PA, such as dancing, which also appeared to be of interest to this subgroup.
Promotoras or lay health advisors were often used to promote the interventions among Hispanic populations. The use of promotoras may have had a dual purpose: to increase trust with and to enhance cultural appropriateness of the interventions. Additionally, these lay health advisors were often bilingual members of the community who could readily communicate with Spanish-speaking participants. The ability to communicate in the participants’ preferred language may facilitate PA behavior change. Findings suggests that the use of promotoras may influence the acceptance of interventions by Hispanic adults. However, more rigorous investigation comparing promotoras with other interventionists has been recommended to provide empirical evidence of promotora effectiveness (Ayala, Vaz, Earp, Elder, & Cherrington, 2010; Rhodes, Foley, Zometa, & Bloom, 2007).
Theoretically driven studies showed significant increases in PA, ranging from two- to tenfold increase per week. The predominant theoretical frameworks used, SCT and TTM, focus on the capability of individuals to enact desired PA behaviors. Hence, these theories may be an appropriate foundation to develop PA interventions for Hispanic populations in the future.
The use of pedometers to measure outcomes may have enhanced PA in and of itself. Evidence for use of pedometers to promote walking has had mixed results in the literature (Ogilvie et al., 2007). However, the use of a pedometer seemed to provide immediate visual feedback about the quantity of steps (Gabrys, Sperzel, Bernhoerster, Banzer, & Vogt, 2017), which may have motivated some individuals to engage in and sustain PA behaviors. Moreover, the relative cost of pedometers is low (Kolt et al., 2012; Sangster, Church, Haas, Furber, & Bauman, 2015), which facilitates access to this tool.
There were limitations to this literature review. Some studies that are relevant to this review may have been missed due to inadequate indexing in available databases. Additionally, ancestry searches conducted by hand did not yield any studies; furthermore, no dissertations were included in this review nor were articles published in Spanish. Some studies included in this review had small sample sizes, and many of the studies relied on self-report of PA by participants. While there is evidence to suggest that self-reported PA is reliable (Craig et al., 2003), there is also evidence confirming that individuals tend to underreport sedentary behavior and overestimate both intensity of PA and duration of moderate-to-vigorous PA (Cerin et al., 2016). Despite the heterogeneity among the U.S. Hispanic adult population, several studies did not describe country of origin or ancestry. Additionally, all studies had primarily female participants.
Conclusion
This literature review described randomized controlled studies that tested PA interventions in Hispanic samples in the United States. A number of effective strategies to enhance PA among Hispanic adults were identified. The use of promotoras or CHWs, a theoretical framework, and face-to-face delivery formats appeared to enhance intervention effectiveness. The use of pedometers produced significant results in some studies, as did studies that measured moderate-to-vigorous PA. Innovative strategies, including a virtual advisor and tailored mailings, were also effective and served to enhance engagement in PA behaviors. However, there was wide variety with regard to the type of intervention implemented and the manner in which PA was measured.
Recommendations for future research include increased efforts to recruit male, younger, and older participants. The use of more objective PA measures, rather than self-report, should be considered in future research. More consistency in the measures used to examine PA could enhance the ability to compare and contrast intervention effectiveness between studies. In addition, developing culturally appropriate interventions that target subsets of the Hispanic population appears to be missing from the literature. Interventions that are specifically tailored based on the participants’ country of origin or ancestry may enhance the effectiveness of PA interventions. Tailoring may also help sustain PA within the target populations.
Hispanics are the largest minority population in the United States. This population experiences increased rates of chronic health conditions, such diabetes mellitus type 2 and cardiovascular disease, which have been correlated to sedentary lifestyle behaviors and overweight/obesity (Caballero, 2005). Therefore, more research is warranted to develop effective intervention strategies that can increase PA in the growing population of U.S. Hispanic adults. Furthermore, such interventions must be tailored and amenable to implementation among America’s diverse Hispanic communities.
Funding
The author(s) disclosed receipt of the following financial support for the research, authorship, and/or publication of this article: This work was supported by a National Institute of Nursing Research-funded T32 Health Behavior Science Pre-Doctoral Fellowship.
Footnotes
Declaration of Conflicting Interests
The author(s) declared no potential conflicts of interest with respect to the research, authorship, and/or publication of this article.
References
- Arredondo EM, Elder JP, Haughton J, Slymen DJ, Sallis JF, Perez LG,…Ayala GX. (2017). Fe en Accion: Promoting physical activity among churchgoing Latinas. American Journal of Public Health, 107, 1109–1115. doi: 10.2105/ajph.2017.303785 [DOI] [PMC free article] [PubMed] [Google Scholar]
- Ayala GX, Vaz L, Earp JA, Elder JP, & Cherrington A(2010). Outcome effectiveness of the lay health advisor model among Latinos in the United States: An examination by role. Health Education Research, 25, 815–840. doi: 10.1093/her/cyq035 [DOI] [PMC free article] [PubMed] [Google Scholar]
- Babamoto KS, Sey KA, Camilleri AJ, Karlan VJ, Catalasan J, & Morisky DE (2009). Improving diabetes care and health measures among Hispanics using community health workers: Results from a randomized controlled trial. Health Education & Behavior, 36, 113–126. doi: 10.1177/1090198108325911 [DOI] [PubMed] [Google Scholar]
- Bell JA, Hamer M, Batty GD, Singh-Manoux A, Sabia S, & Kivimaki M (2014). Combined effect of physical activity and leisure time sitting on long-term risk of incident obesity and metabolic risk factor clustering. Diabetologia, 57, 2048–2056. doi: 10.1007/s00125-014-3323-8 [DOI] [PMC free article] [PubMed] [Google Scholar]
- Brown A (2014, February 26). The U.S. Hispanic population has increased sixfold since 1970. Retrieved from http://www.pewresearch.org/fact-tank/2014/02/26/the-u-s-hispanic-population-has-increased-sixfold-since-1970/
- Bullard KM, Cowie CC, Lessem SE, Saydah SH, Menke A, Geiss LS,… Imperatore G. (2018). Prevalence of diagnosed diabetes in adults by diabetes type: United States, 2016. Morbidity and Mortality Weekly Report, 67(12), 359–361. doi: 10.15585/mmwr.mm6712a2 [DOI] [PMC free article] [PubMed] [Google Scholar]
- Caballero AE (2005). Diabetes in the Hispanic or Latino population: Genes, environment, culture, and more. Current Diabetes Reports, 5, 217–225. doi: 10.1007/s11892-005-0012-5 [DOI] [PubMed] [Google Scholar]
- Centers for Disease Control and Prevention. (2014). Physical activity facts. Retrieved from https://www.cdc.gov/healthyschools/physicalactivity/facts.htm
- Centers for Disease Control and Prevention. (2018). Adult obesity causes & consequences. Retrieved from http://www.cdc.gov/obesity/adult/causes/index.html
- Cerin E, Cain KL, Oyeyemi AL, Owen N, Conway TL, Cochrane T, …Sallis JF. (2016). Correlates of agreement between accelerometry and self-reported physical activity. Medicine & Science in Sports & Exercise, 48, 1075–1084. doi: 10.1249/MSS.0000000000000870 [DOI] [PMC free article] [PubMed] [Google Scholar]
- Coleman KJ, Farrell MA, Rocha DA, Hayashi T, Hernandez M, Wolf J, & Lindsay S (2012). Readiness to be physically active and self-reported physical activity in low-income Latinas, California WISEWOMAN, 2006–2007. Preventing Chronic Disease, 9, E87. [PMC free article] [PubMed] [Google Scholar]
- Conn VS, Phillips LJ,Ruppar TM, & Chase JA (2012). Physical activity interventions with healthy minority adults: Meta-analysis of behavior and health outcomes. Journal of Health Care for the Poor and Underserved, 23, 59–80. doi: 10.1353/hpu.2012.0032 [DOI] [PMC free article] [PubMed] [Google Scholar]
- Craig CL, Marshall AL, Sjorstrom M, Bauman AE, Booth ML, Ainsworth BE,… Oja P. (2003). International physical activity questionnaire: 12-country reliability and validity. Medicine & Science in Sports & Exercise, 35, 1381–1395. [DOI] [PubMed] [Google Scholar]
- Duggan C, Carosso E, Mariscal N, Islas I, Ibarra G, Holte S,…Thompson B. (2014). Diabetes prevention in Hispanics: Report from a randomized controlled trial. Preventing Chronic Disease, 11, E28. doi: 10.5888/pcd11.130119 [DOI] [PMC free article] [PubMed] [Google Scholar]
- Eakin EG, Bull SS, Riley KM, Reeves MM, McLaughlin P, & Gutierrez S (2007). Resources for health: A primary-care- based diet and physical activity intervention targeting urban Latinos with multiple chronic conditions. Health Psychology, 26, 392–400. doi: 10.1037/0278-6133.26.4.392 [DOI] [PubMed] [Google Scholar]
- Gabrys L, Sperzel S, Bernhoerster M, Banzer W, & Vogt L (2017). Real-time visual activity feedback for physical activity improvement in breast and colon cancer patients. Research in Sports Medicine, 25, 1–10. doi: 10.1080/15438627.2016.1258639 [DOI] [PubMed] [Google Scholar]
- Hawkins M, Hosker M, Marcus BH, Rosal MC, Braun B, Stanek EJ III,… Chasan-Taber L. (2015). A pregnancy life-style intervention to prevent gestational diabetes risk factors in overweight Hispanic women: A feasibility randomized controlled trial. Diabetic Medicine, 32, 108–115. doi: 10.1111/dme.12601 [DOI] [PubMed] [Google Scholar]
- Hovell MF, Mulvihill MM, Buono MJ, Liles S, Schade DH, Washington TA,… Sallis JF. (2008). Culturally tailored aerobic exercise intervention for low-income Latinas. American Journal of Health Promotion, 22, 155–163. doi: 10.4278/ajhp.22.3.155 [DOI] [PubMed] [Google Scholar]
- Ickes MJ, & Sharma M (2012). A systematic review of physical activity interventions in Hispanic adults. Journal of Environmental and Public Health, 2012, 15. doi: 10.1155/2012/156435 [DOI] [PMC free article] [PubMed] [Google Scholar]
- Keller C, & Fleury J (2006). Factors related to physical activity in Hispanic women. Journal of Cardiovascular Nursing, 21, 142–145. [DOI] [PubMed] [Google Scholar]
- Khare MM, Cursio JF, Locklin CA, Bates NJ, & Loo RK(2014). Lifestyle intervention and cardiovascular disease risk reduction in low-income Hispanic immigrant women participating in the Illinois WISEWOMAN program. Journal of Community Health, 39, 737–746. doi: 10.1007/s10900-014-9820-3 [DOI] [PubMed] [Google Scholar]
- King AC, Bickmore TW, Campero MI, Pruitt LA, & Yin JL (2013). Employing virtual advisors in preventive care for underserved communities: Results from the COMPASS study. Journal of Health Communication, 18, 1449–1464. doi: 10.1080/10810730.2013.798374 [DOI] [PMC free article] [PubMed] [Google Scholar]
- Kolt GS, Schofield GM, Kerse N, Garrett N, Ashton T, & Patel A (2012). Healthy Steps trial: Pedometer-based advice and physical activity for low-active older adults. Annals of Family Medicine, 10, 206–212. doi: 10.1370/afm.1345 [DOI] [PMC free article] [PubMed] [Google Scholar]
- Koniak-Griffin D, Brecht ML, Takayanagi S, Villegas J, Melen- drez M, & Balcazar H (2015). A community health worker-led lifestyle behavior intervention for Latina (Hispanic) women: Feasibility and outcomes of a randomized controlled trial. International Journal of Nursing Studies, 52, 75–87. doi: 10.1016/j.ijnurstu.2014.09.005 [DOI] [PMC free article] [PubMed] [Google Scholar]
- Kwon S, Wang M, & Hawkins M (2016). Association between self-reported physical activity and obesity among White, Black, Hispanic, and Asian Americans: 2007 and 2009 BRFSS. Ethnicity & Disease, 23, 129–135. [PubMed] [Google Scholar]
- Marcus BH, Dunsiger SI, Pekmezi DW, Larsen BA, Bock BC, Gans KM,… Tilkemeier P. (2013). The Seamos Saludables study: A randomized controlled physical activity trial of Latinas. American Journal of Preventive Medicine, 45, 598–605. doi: 10.1016/j.amepre.2013.07.006 [DOI] [PMC free article] [PubMed] [Google Scholar]
- Marcus BH, Hartman SJ, Larsen BA, Pekmezi D, Dunsiger SI, Linke S,… Rojas C. (2016). Pasos Hacia La Salud: A randomized controlled trial of an internet-delivered physical activity intervention for Latinas. International Journal of Behavioral Nutrition and Physical Activity, 13(1), 62. doi: 10.1186/s12966-016-0385-7 [DOI] [PMC free article] [PubMed] [Google Scholar]
- Marquez DX, Neighbors CJ, & Bustamante EE (2010). Leisure time and occupational physical activity among racial or ethnic minorities. Medicine & Science in Sports & Exercise, 42, 1086–1093. doi: 10.1249/MSS.0b013e3181c5ec05 [DOI] [PubMed] [Google Scholar]
- Marshall SJ, Nicaise V, Ji M, Huerta C, Haubenstricker J, Levy SS, …Elder JE. (2013). Using step cadence goals to increase moderate-to-vigorous-intensity physical activity. Medicine & Science in Sports & Exercise, 45, 592–602. doi: 10.1249/mss.0b013e318277a586 [DOI] [PubMed] [Google Scholar]
- Martinez SM, Ainsworth BE, & Elder JP (2008). A review of physical activity measures used among US Latinos: Guidelines for developing culturally appropriate measures. Annals ofBehavioral Medicine, 36, 195–207. doi: 10.1007/s12160-008-9063-6 [DOI] [PMC free article] [PubMed] [Google Scholar]
- Martinez SM, Arredondo EM, & Roesch S (2013). Physical activity promotion among churchgoing Latinas in San Diego, California: Does neighborhood cohesion matter? Journal of Health Psychology, 18, 1319–1329. doi: 10.1177/1359105312462433 [DOI] [PMC free article] [PubMed] [Google Scholar]
- McEwen MM, Pasvogel A, Murdaugh C, & Hepworth J (2017). Effects of a family-based diabetes intervention on behavioral and biological outcomes for Mexican American adults. Diabetes Educator, 43, 272–285. doi: 10.1177/0145721717706031 [DOI] [PMC free article] [PubMed] [Google Scholar]
- Mier N, Medina AA, & Ory MG (2007). Mexican Americans with type 2 diabetes: Perspectives on definitions, motivators, and programs of physical activity. Preventing Chronic Disease, 4(2), A24. [PMC free article] [PubMed] [Google Scholar]
- Mier N, Ory MG, & Medina AA (2010). Anatomy of culturally sensitive interventions promoting nutrition and exercise in Hispa-nics: A critical examination of existing literature. Health Promotion Practice, 11, 541–554. doi: 10.1177/1524839908328991 [DOI] [PMC free article] [PubMed] [Google Scholar]
- Mitchell DC, Andrews T, & Schenker MB (2015). Pasos Salud-ables: A pilot randomized intervention study to reduce obesity in an immigrant farmworker population. Journal of Occupational and Environmental Medicine, 57, 1039–1046. doi: 10.1097/jom.0000000000000535 [DOI] [PubMed] [Google Scholar]
- Moher D, Liberati A, Tetzlaff J, & Altman DG, & The PRISMA Group. (2009). Preferred Reporting Items for Systematic Reviews and Meta-Analyses: The PRISMA statement. Annals of Internal Medicine, 151, 264–269. doi: 10.7326/0003-4819-151-4-200908180-00135. [DOI] [PubMed] [Google Scholar]
- National Institute of Diabetes and Digestive and Kidney Diseases.(2017). Overweight and obesity statistics. Retrieved from https://www.niddk.nih.gov/health-information/health-statistics/Pages/overweight-obesity-statistics.aspx#c
- Ogilvie D, Foster CE, Rothnie H, Cavill N, Hamilton V, Fitzsimons CF,… Mutrie N. (2007). Interventions to promote walking: Systematic review. British Medical Journal, 334(7605), 1204. doi: 10.1136/bmj.39198.722720.BE [DOI] [PMC free article] [PubMed] [Google Scholar]
- Pekmezi DW, Neighbors CJ, Lee CS, Gans KM, Bock BC, Morrow KM,… Marcus BH. (2009). A culturally adapted physical activity intervention for Latinas: A randomized controlled trial. American Journal of Preventive Medicine, 37, 495–500. doi: 10.1016/j.amepre.2009.08.023 [DOI] [PMC free article] [PubMed] [Google Scholar]
- Perez A, Fleury J, & Keller C (2010). Review of intervention studies promoting physical activity in Hispanic women. Western Journal of Nursing Research, 32, 341–362. doi: 10.1177/0193945909351300 [DOI] [PMC free article] [PubMed] [Google Scholar]
- Poston CWS, Haddock CK, Olvera NE, Suminski RR, Reeves RS, Dunn JK,… Foreyt JP. (2001). Evaluation of a culturally appropriate intervention to increase physical activity. American Journal of Health Behavior, 25, 396–406. doi: 10.5993/AJHB.25.4.5 [DOI] [PubMed] [Google Scholar]
- Rhodes SD, Foley KL, Zometa CS, & Bloom FR (2007). Lay health advisor interventions among Hispanics/Latinos: A qualitative systematic review. American Journal ofPreventive Medicine,33 418–427. doi: 10.1016/j.amepre.2007.07.023 [DOI] [PubMed] [Google Scholar]
- Rosal MC, Ockene IS, Restrepo A, White MJ, Borg A, Olendzki B,… Reed G. (2011). Randomized trial of a literacy-sensitive, culturally tailored diabetes self-management intervention for low-income Latinos: Latinos en Control. Diabetes Care,34, 838–844. doi: 10.2337/dc10-1981 [DOI] [PMC free article] [PubMed] [Google Scholar]
- Rosal MC, Olendzki B, Reed GW, Gumieniak O, Scavron J, & Ockene I (2005). Diabetes self-management among low-income Spanish-speaking patients: A pilot study. Annals of Behavioral Medicine, 29, 225–235. doi: 10.1207/s15324796abm2903_9 [DOI] [PubMed] [Google Scholar]
- Rothschild SK, Martin MA, Swider SM, Tumialan Lynas CM, Janssen I, Avery EF, & Powell LH (2014). Mexican American trial of community health workers: A randomized controlled trial of a community health worker intervention for Mexican Americans with type 2 diabetes mellitus. American Journal of Public Health, 104, 1540–1548. doi: 10.2105/ajph.2013.301439 [DOI] [PMC free article] [PubMed] [Google Scholar]
- Sangster J, Church J, Haas M, Furber S, & Bauman A (2015). A comparison of the cost-effectiveness of two pedometer-based telephone coaching programs for people with cardiac disease. Heart, Lung, and Circulation, 24, 471–479. doi: 10.1016/j.hlc.2015.01.008 [DOI] [PubMed] [Google Scholar]
- Sarma S, Devlin RA, Gilliland J, Campbell MK, & Zaric GS(2015). The effect of leisure-time physical activity on obesity, diabetes, high BP and heart disease among Canadians: Evidence from 2000/2001 to 2005/2006. Health Economics, 24, 1531–1547. doi: 10.1002/hec.3106 [DOI] [PubMed] [Google Scholar]
- Sharma M (2008). Physical activity interventions in Hispanic American girls and women. Obesity Reviews, 9, 560–571. doi: 10.1111/j.1467-789X.2008.00501.x [DOI] [PubMed] [Google Scholar]
- Taylor P, Lopez MH, Martinez J, & Velasco G (2012, April 4). When labels don’t fit: Hispanics and their views of identity. Retrieved from http://www.pewhispanic.org/2012/04/04/when-labels-dont-fit-hispanics-and-their-views-of-identity/
- Turino T (2003). Nationalism and Latin American music: Selected case studies and theoretical considerations. Latin American Music Review/Revista de Musica Latinoamericana, 24, 169–209. [Google Scholar]
- Vincent D (2009). Culturally tailored education to promote lifestyle change in Mexican Americans with type 2 diabetes. Journal of the American Academy of Nurse Practitioners, 21, 520–527. doi: 10.1111/j.1745-7599.2009.00439.x [DOI] [PubMed] [Google Scholar]
- Wood FG (2002). Ethnic differences in exercise among adults with diabetes. Western Journal of Nursing Research, 24, 502–515. doi: 10.1177/019394502400446388 [DOI] [PubMed] [Google Scholar]