

Abstract
In some non-small cell lung cancer (NSCLC) patients, lipid-poor adrenal adenomas cannot be adequately differentiated from metastases using imaging methods. Invasive diagnostic procedures also have a low negative predictive value (NPV) in such cases. The current study aims to establish a specific and clinically practical metabolic parameter for lipid-poor adrenal lesions (ALs) in NSCLC patients. This diagnostic approach may prevent unnecessary abdominal enhanced computed tomography (CT), magnetic resonance imaging, or invasive diagnostic procedures. Sixty-four NSCLC patients with 69 lipid-poor ALs and 28 control patients with 30 benign lipid-poor ALs, who underwent FDG-PET/CT, were retrospectively reviewed. Two morphological and four metabolic parameters were analyzed in FDG-PET/CT images of NSCLC and control patients. Baseline and post-chemotherapy images of 64 NSCLC patients were re-evaluated according to the PERCIST 1.0. In cases where ALs could not be differentiated, follow-up FDG-PET/CT images were re-examined. The receiver operating characteristic (ROC) curve method was used for the evaluation of diagnostic parameters. Out of 69 ALs, 39 were determined as metastatic lesions (adrenal metastasis), while 30 lesions were considered non-metastatic (adrenal adenomas). The mean attenuation value, SUVmax AL/SUVmax primary tumor, SUVmax, SUVmax AL/liver, and SUVmax AL/SUVmean liver were significantly different between metastatic and benign ALs from NSCLC patients. The SUVmax AL/SUVmean liver ≥1.81 had the best positive (PPV, 94.3%) and negative (NPV, 82.4%) predictive values, and the highest specificity (93.3%), sensitivity (84.6%) and accuracy (86.9%). Lipid-poor ALs with SUVmax AL/SUVmean liver ≥1.81 can be accepted as malignant in NSCLC. However, if SUVmax AL/SUVmean liver is <1.81, a pathologic examination is required. Utilizing this cut-off value to decide on adrenal core biopsy may prevent its unnecessary use. Moreover, this diagnostic approach can save time and reduce the healthcare costs.
Keywords: NSCLC, adrenal lesion, lipid-poor, 18F-FDG-PET/CT, diagnostic difficulties
INTRODUCTION
Lung cancer is the leading cause of cancer-related deaths worldwide. Non-small cell lung cancer (NSCLC) accounts for more than 85% of lung cancer cases [1]. According to the eighth edition of the tumor-node-metastasis (TNM) staging system for NSCLC, if a patient has an adrenal metastasis, he/she is considered to have M1b or M1c disease. This situation significantly affects patient management [2]. The incidence of adrenal metastases in patients with NSCLC is high at diagnosis. In addition, postmortem studies in these patients report a high incidence of metastatic adrenal lesions. However, because adrenal adenomas also have a high frequency (9%) in general population, in some NSCLC cases, benign adenoma and metastasis cannot be adequately differentiated using imaging methods [3-7]. A lesion with a density of <10 Hounsfield units (HU) on unenhanced computed tomography (CT) is described with high accuracy as lipid-rich adrenal adenoma. Clinicians, radiologists, and nuclear medicine specialists have no difficulty in diagnosing such lesions [8]. In contrast, lipid-poor adenomas, which have an attenuation value of >10 HU, are difficult to differentiate from metastasis. Approximately 30% of all adrenal adenomas are of this type [9]. Various parameters, such as lesion size, heterogeneity, calcification, irregularity, the presence of necrosis, and local invasion can be used for the evaluation; however, none of these have adequate diagnostic accuracy. Enhanced CT and/or magnetic resonance imaging (MRI) may improve diagnostic accuracy, however they are also usually not sufficient [10-12]. Moreover, a patient diagnosed with NSCLC is staged with fluorodeoxyglucose positron emission tomography (FDG-PET)/CT, not with abdominal enhanced CT or MRI. While FDG-PET/CT is a useful method for AL characterization, it has some limitations. For instance, false-positive or false-negative results may arise due to various pathologies. Moreover, the adrenal glands show a wide range of radiopharmaceutical uptake, from minimal to moderately increased activity [13], indicating the presence of interpatient heterogeneity in ALs. It is unclear which metabolic parameter is appropriate for AL characterization in NSCLC patients; maximum standardized uptake value (SUVmax), SUVmax AL/liver or SUVmax AL/SUVmean liver. Also, there is no specific cut-off value for lipid-poor ALs in NSCLC patients. These patients may undergo invasive diagnostic procedures, however, the negative predictive value (NPV) of such approaches is low. In addition, previous studies on diagnosis and management of ALs included patients with different cancers and data on specific cancer types are still very limited [14-16].
The current study aims to establish a specific and clinically practical metabolic parameter for the characterization of lipid-poor ALs in NSCLC patients. A more reliable parameter and cut-off value for this specific group of patients would make the characterization of ALs at baseline FDG-PET/CT easier. This strategy may prevent unnecessary abdominal enhanced CT or MRI, as well as unnecessary invasive diagnostic procedures.
MATERIALS AND METHODS
Patient selection
A total of 351 patients with NSCLC who underwent FDG-PET/CT from January 2015 to August 2018 at Balikesir State Hospital were retrospectively reviewed. Baseline FDG-PET/CT showed that 85 out of 351 patients had ALs. After 4–6 cycles of chemotherapy treatment, a second scan was performed. Moreover, in some patients, the third scan was taken during the follow-up. In 13 patients, 15 lesions with unenhanced CT attenuation value <10 HU were considered lipid-rich adenomas, and these patients were excluded from the study. Eight patients did not undergo post-chemotherapy FDG-PET/CT, and were also excluded from the study. Finally, 64 NSCLC patients with a total of 69 ALs diagnosed as lipid-poor were included in the study, representing the study group. A control group consisted of 28 patients with overall 30 lipid-poor ALs, in which biopsy did not show any malignant changes in the primary sites. In addition, the ALs of patients in control group did not have significant metabolic and morphological changes during long-term follow-up (mean: 23 months, range: 14–34 months).
FDG-PET/CT imaging
Blood glucose levels of patients who had been fasting for at least six hours were measured. In cases where the blood glucose was >180 mg/dL, FDG-PET/CT was not performed. Patients received 0.12 mCi/kg FDG and the imaging was started at approximately 60 ± 6 minutes after the injection. First, CT (120 keV, 80 mA) images from the vertex to the mid-thigh were acquired. Then, PET (GE Discovery STE 16-slice) scanning was conducted in the same region, in seven or eight bed positions, three minutes per position for normal weight patients and four minutes for overweight patients. The resulting raw data were transformed into axial, sagittal and coronal image sections, using iterative reconstruction (GE AW Volumeshare 4, GE Healthcare, WI, USA).
The long axis of the nodules, unenhanced CT attenuation values, SUVmax and SUL (SUV corrected for lean body mass) values of ALs were calculated after re-examination of the images. In addition, SUVmax liver, SUVmean liver, and SUVmax primary tumor values were calculated from FDG-PET/CT images. SUVmean liver and SUVmax liver were measured within the 3.0 × 3.0 cm region of interest of the normal tissue.
PET/CT interpretation
Baseline and post-chemotherapy images of 64 NSCLC patients were re-evaluated according to the PET Response Criteria in Solid Tumors (PERCIST 1.0). In each patient, SUL values of ALs were calculated in both images. In 34/64 NSCLC patients, significant changes were observed in the SUL values of ALs between baseline and post-chemotherapy FDG-PET/CT. In cases where ALs disappeared on post-chemotherapy FDG-PET/CT, ALs were accepted as completely responsive metastatic lesions. In patients in which the SUL value increased according to the PERCIST 1.0, the lesions were accepted as progressive adrenal metastasis. In cases where the SUL value of ALs significantly decreased on post-chemotherapy FDG-PET/CT, lesions were accepted as partially responsive metastatic lesions. All these patients also had significant changes in SULpeak (lesions with the highest SUL values) between baseline and post-chemotherapy images. On the contrary, in 30/64 NSCLC patients with 32 ALs, no significant changes were observed in the SUL values of ALs between baseline and post-chemotherapy FDG-PET/CT. Thus, we could not determine whether these lesions were malignant or benign. In these 30 patients, the follow-up FDG-PET/CT images were re-examined. According to the PERCIST 1.0, two ALs from 2/30 NSCLC patients showed significantly increased FDG activity in the follow-up images, and these masses were considered malignant. The remaining 30 ALs from 28/30 NSCLC patients showed no significant changes in SUL values in all three images, and these lesions were considered benign. In post-chemotherapy FDG-PET/CT images SULpeak was decreased in 8 and increased in 20 out of 28 NSCLC patients.
Statistical analysis
Data were evaluated using MedCalc Statistical Software version 18.9 (MedCalc Software bvba, Ostend, Belgium; http://www.medcalc.org; 2018). Descriptive statistics included unit number (n), percentage (%), and mean ± standard deviation (SD). Correlation between categorical variables was analyzed by correlation coefficient analysis. Receiver operating characteristic (ROC) curve method was used for the evaluation of diagnostic parameters. A value of p < 0.05 was considered statistically significant.
RESULTS
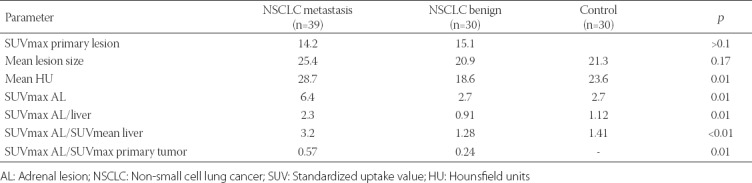
We included 64 NSCLC patients with 69 lipid-poor ALs as a study group. The control group consisted of 28 patients with 30 benign lipid-poor ALs. Sixty out of 64 patients were male, and the mean age was 62.9 years. Thirty-six out of 64 patients were diagnosed with squamous cell carcinoma and 28 with adenocarcinoma. Out of 69 ALs, 39 were determined as malignant, metastatic lesions (adrenal metastasis), while 30 lesions were considered non-metastatic (benign adrenal adenomas). Among 39 metastatic ALs from NSCLC patients, the mean lesion size, attenuation value and SUVmax AL/SUVmax primary tumor at baseline FDG-PET/CT were 25.4, 28.7 and 0.57, respectively. In 30 benign ALs from NSCLC patients, the mean lesion size, attenuation value and SUVmax AL/SUVmax primary tumor at baseline were 20.9, 18.6 and 0.24, respectively. The mean lesion size and attenuation value of ALs in control group were 21.3 and 23.6, respectively. The mean lesion size was not significantly different between benign and metastatic ALs of NSCLC patients, while the mean attenuation value and SUVmax AL/SUVmax primary tumor were significantly different between the two groups. Also, SUVmax, SUVmax AL/liver, and SUVmax AL/SUVmean liver differences were significant between metastatic and benign ALs from NSCLC patients. The parameters in control group were significantly different compared to metastatic ALs but not compared to benign ALs from NSCLC patients. The mean SUVmax, SUVmax AL/liver, and SUVmax AL/SUVmean liver were 6.40, 2.3 and 3.2, respectively in malignant ALs. These values were 2.70, 0.91 and 1.28 in benign ALs and 2.7, 1.12 and 1.41 in control group (Table 1).
TABLE 1.
Comparison of the mean values of morphological and metabolic parameters between lipid-poor AL groups
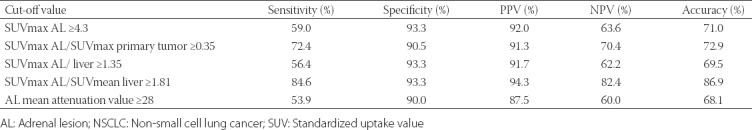
The ROC analysis was performed for four metabolic (Figure 1) and one morphological parameter. The cut-off values were as follows: SUVmax ≥4.3, SUVmax AL/liver ≥1.35, SUVmax AL/SUVmean liver ≥1.81, SUVmax AL/primary tumor >0.35, and mean attenuation value ≥28. The sensitivity, specificity, positive predictive value (PPV), NPV and accuracy (Table 2) were, respectively, 59.0%, 93.3%, 92.0%, 63.6% and 71.0% for SUVmax ≥4.3; 56.4%, 93.3%, 91.7%, 62.2% and 69.5% for SUVmax AL/liver ≥1.35; 84.6%, 93.3%, 94.3%, 82.4% and 86.9% for SUVmax AL/SUV mean liver ≥1.81; 72.4%, 90.5%, 91.3%, 70.4% and 72.9% for SUVmax AL/primary tumor ≥0.35; 53.9%, 90.0%, 87.5%, 60.0% and 68.1% for mean attenuation value ≥28. According to these results, SUVmax AL/SUVmean liver ≥1.81 had the best PPV and NPV, and the highest specificity, sensitivity and accuracy.
FIGURE 1.
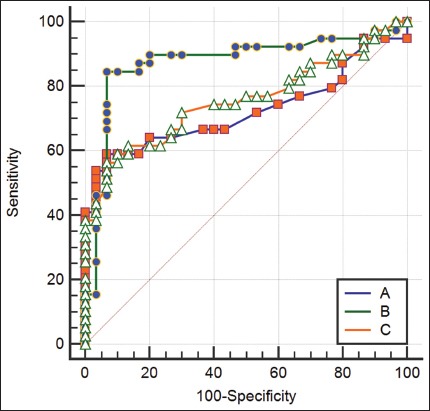
Receiver operating characteristic (ROC) curve analysis of three metabolic parameters for AL characterization in NSCLC. A) SUVmax AL/SUVmean liver; B) SUVmax; and C) SUVmax AL/SUVmax liver. AL: Adrenal lesion; NSCLC: Non-small cell lung cancer; SUV: Standardized uptake value.
TABLE 2.
Comparison of the cut-off values of morphological and metabolic parameters for metastatic lipid-poor ALs in NSCLC
DISCUSSION
Lung carcinoma is one of the leading causes of cancer-related mortality, and NSCLCs account for up to 85% of all cases [1]. According to the latest edition of the TNM classification for NSCLC, if there is an adrenal metastasis, the disease is categorized as M1b or M1c [2]. This stage IV diagnosis affects patient management significantly. The adrenal gland is one of the most common sites of metastasis in patients with lung cancer, and NSCLC metastases cause about 30% of all adrenalectomies [6,17-19]. Because adrenal adenomas also have a high incidence (around 9%) in general population [5], AL characterization is difficult in some NSCLC cases. An AL with an unenhanced CT attenuation value <10 HU is defined as a lipid-rich adenoma with high accuracy [8]. However, lesions with an attenuation value >10 HU can be either malignant or benign and as such are difficult to accurately characterize in NSCLC patients. According to some authors, a combined use of unenhanced and enhanced CT data improves the accuracy of AL characterization [10]. However, NSCLC staging is generally done by FDG-PET/CT and abdominal CT imaging is not frequently performed after the diagnosis. Moreover, conducting an abdominal CT after FDG-PET/CT exposes the patient to additional radiation. Chemical shift MRI also does not have high accuracy for lipid-poor adenomas [11]. Similarly, the results obtained with diffusion-weighted MRI are unsatisfactory [12].
The sensitivity and specificity of FDG-PET/CT for AL characterization were reported as 70–100% and 72–100%, respectively [16]. Nonetheless, most of the previous studies did not exclude lipid-rich adenomas. Moreover, they included patients with different cancer types. Different metabolic parameters for AL characterization are reported in the literature. While some studies used SUVmax as a metabolic parameter, others used SUVmax AL/liver or SUVmax lesion/SUVmean liver [16,20]. Due to these discrepancies in methodology, some authors utilized invasive methods for AL characterization. In a study including 204 patients, the sensitivity, specificity, PPV and NPV of adrenal core biopsy were 88%, 86%, 97% and 58%, respectively [20]. Besides a low NPV, this procedure requires a high level of experience and has high costs. Therefore, it is clear that we need a specific clinical parameter for the characterization of ALs with a CT attenuation value >10 HU in NSCLC patients.
The size of ALs is also considered as an indicator of malignancy. Morelli et al. showed an increased risk of malignancy in adrenal incidentalomas >3 cm [21]. Similarly, Allen and Francis indicated that lesions >4 cm are suspicious for malignancy [22]. However, current imaging techniques can also detect ALs that are much smaller in size, leading to a significant size overlap. For example, in the study of Evans et al. [23], the size range of malignant ALs was 1.0–9.2 cm, while the range of benign lesions was 0.7–5.3 cm. [23]. In the current study, the mean size of metastatic and benign lipid-poor ALs from NSCLC patients was 25.4 mm and 20.9 mm, respectively, with no significant difference. On the other hand, we found that the mean attenuation values were significantly different between metastatic and benign lipid-poor ALs of NSCLC patients. However, the mean attenuation value had the lowest sensitivity and NPV among all parameters in our analysis. Hence, in our opinion, neither the size nor attenuation value can be considered as reliable parameters for the characterization of lipid-poor ALs in NSCLC patients.
SUVmax is one of the most commonly used parameters for AL characterization in NSCLC patients. However, the results for this parameter differ between studies. For example, the cut-off values for SUVmax have been reported in the range of 2.3–5.0, sensitivity in the range 82.4–100%, and specificity in the range 50–100%. Moreover, these studies were not focused only on NSCLC patients and, in most cases, did not analyze lipid-rich and lipid-poor ALs separately [16,24]. Similar to our study, Nakajo et al. [25] evaluated only lipid-poor lesions using FDG-PET/CT. They reported 91% sensitivity, 67% specificity, and 73% accuracy for SUVmax >3.0 [25]. In another study, SUVmax cut-off value was reduced to >2.5 in lipid-poor ALs, and the sensitivity, specificity, PPV, NPV and accuracy were reported as 87.4%, 83.3%, 91.0%, 77.3% and 81.3%, respectively [26]. In our opinion, focusing solely on lipid-poor lesions is crucial in the characterization of ALs. In addition, applying this approach to specific cancer types is also important. Brady et al. reported that the sensitivity and specificity of SUVmax >3.1 were 97% and 86%, respectively in lipid-poor ALs of lung carcinoma patients [27]. A recent study [14] that included only NSCLC patients reported 87% sensitivity and 100% specificity for SUVmax >2.54. However, the authors did not provide information on CT density of adrenal masses [14]. In this study, we analyzed only NSCLC patients with lipid-poor ALs, which enabled us to have a more homogenous population compared to other studies. We observed significant differences in SUVmax values between metastatic and benign ALs from NSCLC patients. According to our ROC analysis, the SUVmax cut-off value was ≥4.3. The sensitivity, specificity, PPV and NPV for SUVmax ≥4.3 were 59.0%, 93.3%, 92.0% and 63.6%, respectively. Our SUVmax cut-off value differs from those of previous studies, which showed relatively lower diagnostic values. It is likely that the patient selection criteria were the main cause of these differences. According to our findings, SUVmax ≥4.3 has a very low NPV and may not be a reliable parameter in the characterization of lipid-poor ALs in NSCLC patients. Thus, a more specific parameter with appropriate cut-off value required for this specific patient group.
A recent study suggested that a comparison of FDG uptake between a lesion and the liver may be an appropriate method for AL characterization [20]. Another study found that 93.7% of adrenal adenomas had lower FDG uptake compared to the liver [28]. Nakajo et al. reported the sensitivity, specificity and accuracy of SUVmax lesion/liver >1.08 to be 100%, 70% and 78%, respectively [25]. Kunikowska et al. reported that the sensitivity and specificity were 93.8% and 91.4%, respectively for SUVmax AL/liver >1.53 [29]. A Japanese study including 30 patients found 85% sensitivity, 100% specificity, 100% PPV, 83% NPV and 91% accuracy for SUVmax lesion/liver cut-off value 1.8 [30]. However, most of these studies did not include homogeneous patient populations. In contrast, Kim et al. [14] analyzed only NSCLC patients (n = 24) and calculated SUVmax AL/liver cut-off value to be >1.4; the sensitivity was 100% and the specificity was 87% in their study [14]. In this study, in addition to SUVmax AL/liver, we analyzed SUVmax AL/SUV mean liver. We showed that the SUVmax AL/SUVmean liver ≥1.81 was more reliable than the other metabolic and morphological parameters. This parameter had the highest sensitivity, specificity, PPV and NPV, and around 87% accuracy (Figure 2).
FIGURE 2.
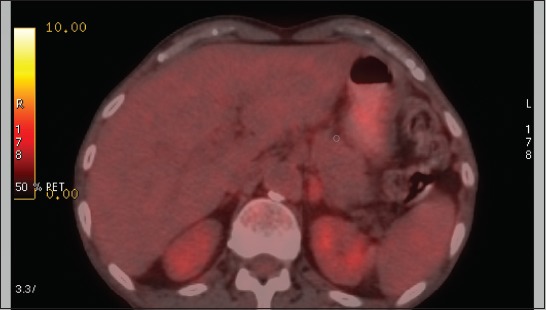
Sixty-year-old male patient who was diagnosed with NSCLC. He had a solid lesion in the left adrenal gland. The lesion size was 34 mm, the mean attenuation value was 30 HU, SUVmax was 4.9, SUVmax AL/liver was 1.37, and SUVmax AL/SUVmean liver was 1.77. Final diagnosis of the lesion was non-metastatic AL. Among all analyzed parameters, only SUVmax AL/SUVmean liver 1.77 indicated non-metastasis. AL: Adrenal lesion; NSCLC: Non-small cell lung cancer; SUV: Standardized uptake value; HU: Hounsfield units.
Finally, we evaluated SUVmax AL/primary tumor rate as another metabolic parameter for AL characterization, due to the fact that metabolic activity of a primary tumor affects its aggressiveness. SUVmax AL/primary tumor rate was previously investigated for the characterization of mediastinal lymph nodes in NSCLC patients and determined to be more useful than morphological parameters [31]. However, in the current study, we did not obtain satisfactory results using SUVmax AL/primary tumor rate for the characterization of lipid-poor ALs in NSCLC patients. Nonetheless, as far as we know, this is the first study to analyze SUVmax AL/primary tumor rate in NSCLC patients. Therefore, it may be premature to conclude on the usefulness of this parameter in lipid-poor ALs in NSCLC patients.
CONCLUSION
Lipid-poor ALs are difficult to characterize in clinical practice. We evaluated two morphological and four metabolic parameters for the characterization of ALs in NSCLC patients. The SUVmax AL/SUVmean liver ≥1.81 provided the most accurate results, as it had the highest NPV compared to the other parameters. According to our results, lipid-poor ALs with a SUVmax AL/SUVmean liver ≥1.81 can be accepted as malignant. However, if SUVmax AL/SUVmean liver is <1.81, a pathologic examination is still necessary. Nonetheless, due to the high NPV of SUVmax AL/SUVmean liver ≥1.81, utilizing this cut-off value to decide on adrenal core biopsy may prevent its unnecessary use. Moreover, this approach can save time and reduce the healthcare costs.
DECLARATION OF INTERESTS
The authors declare no conflict of interests.
REFERENCES
- 1.Global Burden of Disease Cancer Collaboration. Fitzmaurice C, Akinyemiju TF, Al Lami FH, Alam T, Alizadeh-Navaei R, et al. Global, regional, and national cancer incidence, mortality, years of life lost, years lived with disability, and disability-adjusted life-years for 29 cancer groups, 1990 to 2016:A systematic analysis for the Global Burden of Disease Study. JAMA Oncol. 2018;4(11):1553–68. doi: 10.1001/jamaoncol.2018.2706. https://doi.org/10.1001/jamaoncol.2018.2706. [DOI] [PMC free article] [PubMed] [Google Scholar]
- 2.Goldstraw P, Chansky K, Crowley J, Rami-Porta R, Asamura H, Eberhardt WE, et al. The IASLC lung cancer staging project:proposals for revision of the TNM stage groupings in the forthcoming (eighth) edition of the TNM classification for lung cancer. J Thorac Oncol. 2016;11(1):39–51. doi: 10.1016/j.jtho.2015.09.009. https://doi.org/10.1016/j.jtho.2015.09.009. [DOI] [PubMed] [Google Scholar]
- 3.Karanikiotis C, Tentes AA, Markakidis S, Vafiadis K. Large bilateral adrenal metastases in non-small cell lung cancer. World J Surg Oncol. 2004;2:37. doi: 10.1186/1477-7819-2-37. https://doi.org/10.1186/1477-7819-2-37. [DOI] [PMC free article] [PubMed] [Google Scholar]
- 4.Pędziwiatr M, Natkaniec M, Kisialeuski M, Major P, Matłok M, Kołodziej D, et al. Adrenal incidentalomas:should we operate on small tumors in the era of laparoscopy? Int J Endocrinol. 2014;658483 doi: 10.1155/2014/658483. https://doi.org/10.1155/2014/658483. [DOI] [PMC free article] [PubMed] [Google Scholar]
- 5.Hsu F, De Caluwe A, Anderson D, Nichol A, Toriumi T, Ho C. Patterns of spread and prognostic implications of lung cancer metastasis in an era of driver mutations. Curr Oncol. 2017;24(4):228–33. doi: 10.3747/co.24.3496. https://doi.org/10.3747/co.24.3496. [DOI] [PMC free article] [PubMed] [Google Scholar]
- 6.Aktas GE, Soyluoglu SD, Sarikaya A. Bilateral symmetrical adrenal hypermetabolism on FDG PET/CT due to Cushing syndrome in well differentiated neuroendocrine carcinoma. Rev Esp Med Nucl Imagen Mol. 2016;35(2):118–20. doi: 10.1016/j.remn.2015.08.011. https://doi.org/10.1016/j.remn.2015.08.011. [DOI] [PubMed] [Google Scholar]
- 7.Papierska L, Cichocki A, Sankowski AJ, Cwikła JB. Adrenal incidentaloma imaging - the first steps in therapeutic management. Pol J Radiol. 2013;78(4):47–55. doi: 10.12659/PJR.889541. https://doi.org/10.12659/PJR.889541. [DOI] [PMC free article] [PubMed] [Google Scholar]
- 8.Korivi BR, Elsayes KM. Cross-sectional imaging work-up of adrenal masses. World J Radiol. 2013;5(3):88–97. doi: 10.4329/wjr.v5.i3.88. https://doi.org/10.4329/wjr.v5.i3.88.8. [DOI] [PMC free article] [PubMed] [Google Scholar]
- 9.Mayo-Smith WW, Boland GW, Noto RB, Lee MJ. State-of-the-art adrenal imaging. Radiographics. 2001;21(4):995–1012. doi: 10.1148/radiographics.21.4.g01jl21995. https://doi.org/10.1148/radiographics.21.4.g01jl21995. [DOI] [PubMed] [Google Scholar]
- 10.Ng CS, Wei W, Altinmakas E, Li X, Ghosh P, Perrier NA, et al. Differentiation of malignant and benign adrenal lesions with delayed CT:multivariate analysis and predictive models. AJR Am J Roentgenol. 2018;210(4):W156–63. doi: 10.2214/AJR.17.18428. https://doi.org/10.2214/AJR.17.18428. [DOI] [PubMed] [Google Scholar]
- 11.Seo JM, Park BK, Park SY, Kim CK. Characterization of lipid-poor adrenal adenoma:chemical-shift MRI and washout CT. AJR Am J Roentgenol. 2014;202(5):1043–50. doi: 10.2214/AJR.13.11389. https://doi.org/10.2214/AJR.13.11389. [DOI] [PubMed] [Google Scholar]
- 12.Hida T, Nishie A, Asayama Y, Ishigami K, Ushijima Y, Takayama Y, et al. Apparent diffusion coefficient characteristics of various adrenal tumors. Magn Reson Med Sci. 2014;13(3):183–9. doi: 10.2463/mrms.2013-0113. https://doi.org/10.2463/mrms.2013-0113. [DOI] [PubMed] [Google Scholar]
- 13.Bagheri B, Maurer AH, Cone L, Doss M, Adler L. Characterization of the normal adrenal gland with 18F-FDG PET/CT. J Nucl Med. 2004;45(8):1340–3. [PubMed] [Google Scholar]
- 14.Kim BS, Lee JD, Kang WJ. Differentiation of an adrenal mass in patients with non-small cell lung cancer by means of a normal range of adrenal standardized uptake values on FDG PET/CT. Ann Nucl Med. 2015;29(3):276–83. doi: 10.1007/s12149-014-0937-3. https://doi.org/10.1007/s12149-014-0937-3. [DOI] [PubMed] [Google Scholar]
- 15.Glenn JA, Kiernan CM, Yen TWF, Solorzano CC, Carr AA, Evans DB, et al. Management of suspected adrenal metastases at 2 academic medical centers. Am J Surg. 2016;211(4):664–70. doi: 10.1016/j.amjsurg.2015.11.019. https://doi.org/10.1016/j.amjsurg.2015.11.019. [DOI] [PubMed] [Google Scholar]
- 16.Kim SJ, Lee SW, Pak K, Kim IJ, Kim K. Diagnostic accuracy of 18F-FDG PET or PET/CT for the characterization of adrenal masses:a systematic review and meta-analysis. Br J Radiol. 2018;91(1086):20170520. doi: 10.1259/bjr.20170520. https://doi.org/10.1259/bjr.20170520. [DOI] [PMC free article] [PubMed] [Google Scholar]
- 17.Kaygisiz O, Ozmerdiven G, Kordan Y, Coskun B, Vuruskan H, Yavascaoglu I. Role of PET/CT in the evaluation of metastatic adrenal masses. Eur Urol Supp. 2014;4S:e13–4. [Google Scholar]
- 18.Siegel R, Naishadham D, Jemal A. Cancer statistics. CA Cancer J Clin. 2013;63(1):11–30. doi: 10.3322/caac.21166. https://doi.org/10.3322/caac.21166. [DOI] [PubMed] [Google Scholar]
- 19.American Cancer Society. Cancer Facts and Figures 2015. Atlanta: American Cancer Society; 2015. [[cited 2018 May 05]]. Available from: https://www.cancer.org/ content/dam/ cancer-org/ research/cancer-facts-and- statistics/ annual-cancer-facts- and-figures /2015/cancer - facts-and-figures- 2015.pdf . [Google Scholar]
- 20.Villelli NW, Jayanti MK, Zynger DL. Use and usefulness of adrenal core biopsies without FNA or on-site evaluation of adequacy:a study of 204 cases for a 12-year period. Am J Clin Pathol. 2012;137(1):124–31. doi: 10.1309/AJCP4JE4FVDJFLIJ. https://doi.org/10.1309/AJCP4JE4FVDJFLIJ. [DOI] [PubMed] [Google Scholar]
- 21.Morelli V, Palmieri S, Salcuni AS, Eller-Vainicher C, Cairoli E, Zhukouskaya V, et al. Bilateral and unilateral adrenal incidentalomas:biochemical and clinical characteristics. Eur J Endocrinol. 2013;168(2):235–41. doi: 10.1530/EJE-12-0777. https://doi.org/10.1530/EJE-12-0777. [DOI] [PubMed] [Google Scholar]
- 22.Allen BC, Francis IR. Adrenal imaging and intervention. Radiol Clin N Am. 2015;53(5):1021–35. doi: 10.1016/j.rcl.2015.05.004. https://doi.org/10.1016/j.rcl.2015.05.004. [DOI] [PubMed] [Google Scholar]
- 23.Evans PD, Miller CM, Marin D, Stinnett SS, Wong TZ, Paulson EK, et al. FDG-PET/CT characterization of adrenal nodules:diagnostic accuracy and interreader agreement using quantitative and qualitative methods. Acad Radiol. 2013;20(8):923–9. doi: 10.1016/j.acra.2013.02.010. https://doi.org/10.1016/j.acra.2013.02.010. [DOI] [PubMed] [Google Scholar]
- 24.Watanabe H, Kanematsu M, Goshima S, Kondo H, Kawada H, Noda Y, et al. Adrenal-to-liver SUV ratio is the best parameter for differentiation of adrenal metastases from adenomas using (18)F-FDG PET/CT. Ann Nucl Med. 2013;27(7):648–53. doi: 10.1007/s12149-013-0730-8. https://doi.org/10.1007/s12149-013-0730-8. [DOI] [PubMed] [Google Scholar]
- 25.Nakajo M, Jinguji M, Fukukura Y, Kajiya Y, Tani A, Nakajo M, et al. FDG-PET/CT and FLT-PET/CT for differentiating between lipid-poor benign and malignant adrenal tumours. Eur Radiol. 2015;25(12):3696–3705. doi: 10.1007/s00330-015-3787-z. https://doi.org/10.1007/s00330-015-3787-z. [DOI] [PubMed] [Google Scholar]
- 26.Kim JY, Kim SH, Lee HJ, Kim MJ, Kim YH, Cho SH, et al. Utilisation of combined 18F-FDG PET/CT scan for differential diagnosis between benign and malignant adrenal enlargement. Br J Radiol. 2013;86(1028):20130190. doi: 10.1259/bjr.20130190. https://doi.org/10.1259/bjr.20130190. [DOI] [PMC free article] [PubMed] [Google Scholar]
- 27.Brady MJ, Thomas J, Wong TZ, Franklin KM, Ho LM, Paulson EK. Adrenal nodules at FDG PET/CT in patients known to have or suspected of having lung cancer:a proposal for an efficient diagnostic algorithm. Radiology. 2009;250(2):523–30. doi: 10.1148/radiol.2502080219. https://doi.org/10.1148/radiol.2502080219. [DOI] [PubMed] [Google Scholar]
- 28.Blake MA, Slattery JM, Kalra MK, Halpern EF, Fischman AJ, Mueller PR, et al. Adrenal lesions:characterization with fused PET/CT image in patients with proved or suspected malignancy-initial experience. Radiology. 2006;238(3):970–7. doi: 10.1148/radiol.2383042164. https://doi.org/10.1148/radiol.2383042164. [DOI] [PubMed] [Google Scholar]
- 29.Kunikowska J, Matyskiel R, Toutounchi S, Grabowska-Derlatka L, Koperski L, Królicki L. What parameters from 18F-FDG PET/CT are useful in evaluation of adrenal lesions? Eur J Nucl Med Mol Imaging. 2014;41(12):2273–80. doi: 10.1007/s00259-014-2844-1. https://doi.org/10.1007/s00259-014-2844-1. [DOI] [PMC free article] [PubMed] [Google Scholar]
- 30.Okada M, Shimono T, Komeya Y, Ando R, Kagawa Y, Katsube T, et al. Adrenal masses:the value of additional fluorodeoxyglucose-positron emission tomography/computed tomography (FDG-PET/CT) in differentiating between benign and malignant lesions. Ann Nucl Med. 2009;23(4):349–54. doi: 10.1007/s12149-009-0246-4. https://doi.org/10.1007/s12149-009-0246-4. [DOI] [PubMed] [Google Scholar]
- 31.Lee JW, Kim EY, Kim DJ, Lee JH, Kang WJ, Lee JD, et al. The diagnostic ability of 18F-FDG PET/CT for mediastinal lymph node staging using 18F-FDG uptake and volumetric CT histogram analysis in non-small cell lung cancer. Eur Radiol. 2016;26(12):4515–23. doi: 10.1007/s00330-016-4292-8. https://doi.org/10.1007/s00330-016-4292-8. [DOI] [PubMed] [Google Scholar]