

Abstract
Background:
Having nurse practitioners (NPs) as primary care providers for patients with congestive heart failure (CHF) is 1 way to address the growing shortage of primary care physicians (PCPs).
Methods and Results:
We used inverse probability of treatment weighted with propensity score to examine the processes and outcomes of care for patients under 3 care models. Approximately 72.9%, 0.8%, and 26.3% of CHF patients received care under the PCP model, the NP model, and the shared care model, respectively. Patients under the NP or shared care models were more likely than those under the PCP model to be referred to cardiologists (odds ratio 1.35, 95% confidence interval 1.32–1.37; odds ratio 1.32, 95% confidence interval 1.30–1.35) and to get guideline-recommended medications. NPs and PCPs had similar rates of emergency room (ER) visits and Medicare spending after adjusting for processes of care. Patients under the shared care model had a higher burden of comorbidity and experienced a higher rate of ER visits and hospitalizations than those under the PCP model.
Conclusion:
The delivery of CHF care mirrors the severity of comorbidity in these patients. The high rate of hospitalization and ER visits in the shared care model underscores the need to design and implement more effective chronic disease management and integrated care programs.
Keywords: Nurse practitioner, congestive heart failure, primary care, Medicare
Congestive heart failure (CHF) is a growing public health problem and a major contributor to emergency department (ER) visits and potentially preventable hospitalizations in the elderly population.1–4 The proportion of seniors living with CHF is projected to increase in the future, in part because of improved survival from myocardial infarction, coronary artery disease, and other causes of CHF.4–7 CHF contributes to premature death, disability, and increased health care costs.1–4 High-quality primary care can improve the processes of CHF care and reduce the occurrence of these negative outcomes.4,5 Having a stable primary care provider is critical to cost-effective care, better outcomes of care, and higher patient satisfaction, especially for seniors living with complex chronic diseases.8–13
Optimal primary care is particularly relevant to older patients with CHF because of the high prevalence of multiple coexisting diseases such as coronary artery disease and diabetes.3–7 CHF care requires effective integration and coordination of care across various settings and multiple providers.4–7,14 The growing shortage of primary care physicians (PCPs) is a major obstacle to effective primary care.5–7 To address this shortage, many states have enacted laws allowing nurse practitioners (NPs) to practice independently as primary care providers for seniors living with CHF and other chronic diseases.7,15 Because of the complexity of CHF care, most NPs work with physicians in a team care model, a model that is an integral part of the Patient-Centered Medical Home, which is a model of primary care organization that is comprehensive, patient-centered, accessible, integrated, and coordinated across all health systems, with strong emphasis on quality, safety, data-driven outcomes, and strong patient-provider partnerships.6,7,16–18
We previously studied quality of care provided by NPs versus PCPs for chronic obstructive pulmonary disease and diabetes.19–21 We have found NP care is associated with an increased use of specialists but similar health care costs and outcomes. We have not, however, previously studied a shared care model involving both NPs and PCPs. It is not clear how care provided to CHF patients varies by model of care (PCPs only, NPs only, or shared care). The current study used Medicare claims data to describe processes and outcomes of CHF care according to whether patients receive their primary care from PCPs only, NPs only, or both NPs and PCPs. We examined the differences among the 3 models of CHF primary care in adherence to processes of care (e.g., use of angiotensin-converting enzyme inhibitors or angiotensin receptor blockers and referrals for cardiac rehabilitation) and in outcomes of care (e.g., ER visits and hospitalizations). Relationships between adherence to guideline-recommended processes of care and better outcomes have been well documented in prior studies.3–5
Methods
Establishment of the Study Cohorts
As shown in a previous study,15 in 2010 about 10% of Medicare beneficiaries received care from NPs and less than 3% of them had NPs as their PCP. To allow sufficient sample size for each care model, we used Medicare claims data with different sampling schemes to define cohorts of care models: 100% of beneficiaries under the NP-only model, 5% of the PCP-only model, and 20% of the shared care model. The 5% sample was developed by the Centers for Medicare and Medicaid Services (CMS), which selects a random sample of 5% Medicare beneficiaries based on the eighth and ninth digits (05,20,45,70, and 95) of their health insurance claim number; this is the standard dataset available for research purposes. The 20% randomly selected shared care sample and 100% NP-only sample were developed by a CMS vendor that searched Medicare beneficiaries’ outpatient care provided by PCPs and NPs.
All Medicare beneficiaries with CHF identified in CMS Chronic Disease Data Warehouse for 2 consecutive years (2009 and 2010) were selected.22 To select the NP-only cohort, all patients who received all of their primary care from NPs in 2010 were identified by selecting individuals with billing records for 2 or more outpatient evaluation and management (E&M) services by NPs and none from PCPs (general practitioner, family physician, general internist, or geriatrician). To select the PCP-only cohort, we included individuals had at least 2 outpatient E&M services from PCPs and no outpatient E&M services from NPs in 2010. Last, to select the shared care cohort, we included at least 2 outpatient E&M services from both NPs and PCPs in 2010.
For all 3 groups, we excluded individuals younger than age 66; those with incomplete enrollment in Medicare Parts A, B, and D in 2009–2010; and those with enrollment based on original entitlement of disability or end-stage renal disease. Because those aged 65 qualify for Medicare enrollment, we selected beneficiaries at least 66 years old to capture their claim data in the previous year for identification of comorbidity, number of provider visits, and hospitalization. We excluded individuals who were covered by health maintenance organizations at any time in 2009–2010 and those who stayed in a nursing home in 2010. We used Medicare Provider Analysis and Review (MedPAR), Outpatient Standard Analytical File (OutSAF), professional claims (Carrier) files, beneficiary summary file, and enrollment files from 2009–2010 to define our study covariates and outcomes. Cohort derivation steps are provided in Fig. 1.
Fig. 1.
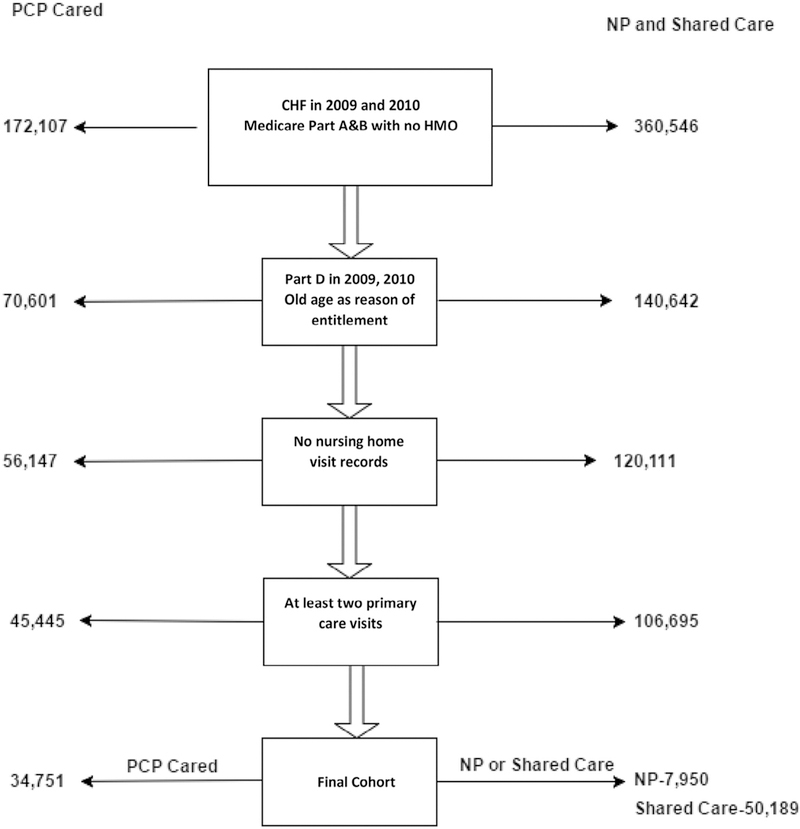
Summary of the selection of *CHF study cohorts for 3 groups (**PCPs only, NPs only, and shared care) of patients. *Patients were identified as having CHF in 2009 and 2010 Centers for Medicare and Medicaid Services Chronic Disease Data Warehouse. **Patients in the NP group were identified from 100% Medicare patients who received all of their primary care from NPs. Patients in the PCP group were identified from a 5% national sample of Medicare patients. Patients in the shared care group were identified from 20% Medicare patients received their primary care from both PCPs and NPs. CHF, congestive heart failure; HMO, health maintenance organization NPs, nurse practitioners; PCPs, primary care physicians.
Measurements
We obtained information on participant age, sex, county of residence, and race from Medicare enrollment files. Because the relationship between age and care model was not linear, age was categorized in the analyses. A Medicaid eligibility indicator in the enrollment file was used as a proxy for low income. The Elixhauser comorbidity measures23 were generated from inpatient facility (MedPAR), outpatient facility (OutSAF), and professional (Carrier files) claims in 2009. Federal Information Processing Standards codes were linked with available Rural-Urban Continuum Codes to define the size of the patient residential area as metro, nonmetro urban, or rural. Because levels of restrictions on NP scope of practice vary across states (some allow independent practice and others require physician supervision of NPs), state regulations of NP practice were classified into 5 categories from the least to most restricted.15 Number of provider visits in 2009 was calculated from OutSAF and Carrier files. Hospitalizations in 2009 were extracted from MedPAR 2009. We used 2009 data to describe the patient comorbidity, number of provider visits, and number of hospitalizations independent of the care model used in 2010.
Study Outcomes
For processes of care, we assess whether patients received chronic disease management, cardiac rehabilitation, and transthoracic or transesophageal echocardiogram based on billed claims (Appendix 1). Receipt of examinations and tests was assessed regardless of who provided them (NP, PCP, or other provider). The frequency of provider visits, the use of cardiologist consultations, and continuity of care in 2010 were also evaluated. The Modified “Modified” Continuity Index was used to measure continuity of care.24,25
Measures of medication management endorsed by the National Quality Forum were selected.26 We examined the use of angiotensin-converting enzyme inhibitors (ACEIs) or angiotensin receptor blockers (ARBs) and of beta-blockers. In addition, we also examined the use of diuretics and digoxin. Among the users of each studied medication group, we also calculated medication adherence as the proportion of days covered, defined as the proportion of days of 365 days that a patient had such medication available.27
For outcomes of care, ER visits and acute hospitalizations in 2010 were assessed. Finally, Medicare costs in 2010 were estimated according to the Medicare paid amount in the MedPAR, OutSAF, and Carrier files, following the payment calculation worksheets provided by the Research Data Assistance Center.
Statistical Analyses
To address the concern that patients cared for under each model has different demographics and complexity of disease, the propensity score (PS) method for multitreatments was calculated. We used the generalized boosted model, incorporating all the patient characteristics listed in Table 1 to estimate PS by multinomial PS function, available in the R package twang (twang: Toolkit for Weighting and Analysis of Nonequivalent Groups).28,29 The generalized boosted model is a nonparametric machine-learning classifying technique. We set the maximum number of regression trees to 15,000 to obtain optimum balance statistics. In every iteration, the model with the additional tree was assessed to see if the balance measure was improved. The final model with the number of trees providing the best balance of baseline characteristics was selected. To assess the balance of each characteristic, the absolute standardized mean difference of effect size (standardized bias) or Kolmogorov-Smirnov statistics was calculated and reported in tabular and graphical forms (Appendix 2). The overlap of PS among groups was also assessed (Appendix 3).
Table 1.
Characteristics of ParticipantsWith CHF, Stratified According to Whether They Received Primary Care From PCPs only, NPs only, or both (shared care) Before and After PSWeighting
| Before PS Weighting |
After PS Weighting |
|||||||||
|---|---|---|---|---|---|---|---|---|---|---|
| Variables | PCPs | NPs | Shared | P Value | Max. ASMD |
PCPs | NPs | Shared | P Value | Max. ASMD |
| N (92,890) | 34,751 | 7950 | 50,189 | 90,703 | 86,462 | 91,893 | ||||
| % | 37.41 | 8.56 | 54.03 | 33.71 | 32.13 | 34.15 | ||||
| Age (%) | <.0001 | .99 | ||||||||
| 66–70 | 7.30 | 11.52 | 9.40 | 0.143 | 8.65 | 8.93 | 8.91 | 0.008 | ||
| 71–75 | 16.32 | 21.32 | 19.55 | 0.126 | 18.35 | 18.51 | 18.51 | 0.005 | ||
| 76–80 | 20.90 | 21.25 | 22.60 | 0.041 | 21.80 | 21.77 | 21.83 | 0.004 | ||
| 81–85 | 24.20 | 21.56 | 23.67 | 0.061 | 23.80 | 23.81 | 23.73 | 0.004 | ||
| 86+ | 31.28 | 24.35 | 24.78 | 0.161 | 27.40 | 26.97 | 27.02 | 0.010 | ||
| Age (mean, SD) | 81.56 ± 7.34 | 79.82 ± 7.39 | 80.25 ± 7.09 | <.0001 | ||||||
| Gender (%) | <.0001 | .74 | ||||||||
| Female | 68.78 | 66.38 | 63.82 | 0.103 | 66.06 | 66.23 | 65.80 | 0.007 | ||
| Male | 31.22 | 33.62 | 36.18 | 0.103 | 33.94 | 33.77 | 34.20 | 0.007 | ||
| Race (%) | <.0001 | .85 | ||||||||
| Whites | 80.86 | 84.89 | 88.03 | 0.218 | 84.96 | 85.32 | 85.22 | 0.009 | ||
| Blacks | 8.26 | 9.17 | 6.98 | 0.084 | 7.75 | 7.84 | 7.63 | 0.002 | ||
| Hispanics | 6.86 | 3.70 | 3.04 | 0.219 | 4.62 | 4.41 | 4.58 | 0.009 | ||
| Other | 4.02 | 2.24 | 1.95 | 0.148 | 2.66 | 2.41 | 2.56 | 0.008 | ||
| Medicaid eligibility (%) | <.0001 | .95 | ||||||||
| No | 70.82 | 67.66 | 75.75 | 0.081 | 73.75 | 73.40 | 73.38 | 0.005 | ||
| Yes | 29.18 | 32.34 | 24.25 | 0.081 | 26.47 | 26.60 | 26.62 | 0.005 | ||
| Rural/urban (%) | <.0001 | .68 | ||||||||
| Metro | 76.14 | 56.91 | 65.85 | 0.402 | 69.14 | 68.43 | 68.83 | 0.015 | ||
| Nonmetro urban | 21.09 | 37.02 | 29.30 | 0.346 | 26.79 | 27.27 | 26.98 | 0.010 | ||
| Rural | 2.77 | 6.08 | 4.85 | 0.152 | 4.07 | 4.30 | 4.19 | 0.011 | ||
| NP state regulation (%) | <.0001 | .99 | ||||||||
| 1 (least restrictive) | 7.86 | 14.98 | 11.17 | 0.222 | 10.07 | 10.12 | 10.22 | 0.005 | ||
| 2 | 17.16 | 15.65 | 14.55 | 0.074 | 15.58 | 15.45 | 15.50 | 0.004 | ||
| 3 | 28.47 | 30.25 | 29.50 | 0.039 | 29.08 | 29.29 | 29.23 | 0.004 | ||
| 4 | 25.15 | 23.76 | 25.76 | 0.046 | 25.44 | 25.35 | 25.43 | 0.015 | ||
| 5 (most restrictive) | 21.37 | 15.36 | 19.01 | 0.155 | 19.82 | 19.79 | 19.62 | 0.010 | ||
| Hospitalizations in the previous 12 mo (%) | <.0001 | .26 | ||||||||
| 0 | 56.24 | 59.03 | 52.21 | 0.137 | 54.64 | 55.71 | 54.20 | 0.022 | ||
| 1 | 24.84 | 23.62 | 26.07 | 0.056 | 25.27 | 25.01 | 25.46 | 0.010 | ||
| 2 | 10.91 | 10.48 | 11.99 | 0.047 | 11.40 | 11.13 | 11.51 | 0.009 | ||
| 3+ | 8.00 | 6.87 | 9.74 | 0.099 | 8.69 | 8.15 | 8.83 | 0.012 | ||
| Provider visits in the previous 12 mo | 12.89 ± 9.24 | 11.24 ± 8.33 | 14.87 ± 9.86 | <.0001 | 0.379 | .05 | 0.026 | |||
| Comorbidity measures (%) | ||||||||||
| Valve disease | 17.46 | 16.86 | 19.74 | <.0001 | 0.074 | 18.38 | 18.67 | 18.76 | .73 | 0.011 |
| Pulmonary circular disease | 4.58 | 4.44 | 6.25 | <.0001 | 0.080 | 5.37 | 5.11 | 5.48 | .44 | 0.012 |
| Peripheral vascular disease | 19.94 | 16.43 | 19.93 | <.0001 | 0.088 | 19.23 | 18.87 | 19.56 | .39 | 0.013 |
| Hypertension | 85.35 | 82.38 | 85.06 | <.0001 | 0.067 | 85.03 | 84.28 | 84.93 | .16 | 0.011 |
| Paralysis | 1.88 | 1.13 | 1.56 | <.0001 | 0.059 | 1.63 | 1.21 | 1.58 | .20 | 0.015 |
| Neurological disorders | 8.32 | 6.99 | 8.34 | .0002 | 0.049 | 8.09 | 7.53 | 8.11 | .17 | 0.014 |
| Chronic pulmonary disease | 26.80 | 26.98 | 30.04 | <.0001 | 0.072 | 28.40 | 27.32 | 28.62 | .05 | 0.025 |
| Hypothyroidism | 20.74 | 18.16 | 20.87 | <.0001 | 0.067 | 20.45 | 20.30 | 20.54 | .12 | 0.003 |
| Diabetes without chronic complications | 38.18 | 36.69 | 38.93 | .0003 | 0.046 | 38.41 | 38.07 | 38.37 | .19 | 0.004 |
| Diabetes with chronic complications | 13.43 | 12.38 | 15.28 | <.0001 | 0.083 | 14.14 | 14.04 | 14.35 | .25 | 0.005 |
| Renal failure | 16.90 | 16.75 | 21.16 | <.0001 | 0.112 | 18.94 | 19.20 | 19.29 | .26 | 0.006 |
| Liver disease | 1.05 | 0.73 | 1.11 | .008 | 0.038 | 1.06 | 0.78 | 1.06 | .05 | 0.020 |
| Peptic ulcer | 0.10 | - | 0.08 | .34 | 0.017 | 0.07 | 0.03 | 0.08 | .10 | 0.016 |
| Acquired immune deficiency syndrome | 0.03 | - | 0.03 | .28 | 0.019 | 0.03 | 0.01 | 0.04 | .20 | 0.002 |
| Lymphoma | 1.01 | 1.17 | 1.63 | <.0001 | 0.053 | 1.21 | 1.35 | 1.35 | .66 | 0.005 |
| Metastatic cancer | 0.81 | 1.16 | 1.26 | <.0001 | 0.043 | 0.98 | 0.94 | 1.10 | .35 | 0.008 |
| Solid tumor without metastasis | 8.61 | 8.38 | 10.58 | <.0001 | 0.075 | 9.50 | 9.26 | 9.73 | .77 | 0.013 |
| Rheumatoid arthritis | 4.57 | 3.91 | 5.10 | <.0001 | 0.056 | 4.79 | 4.76 | 4.82 | .97 | 0.003 |
| Coagulopathy | 4.91 | 4.49 | 5.32 | .001 | 0.038 | 5.15 | 4.93 | 5.07 | .74 | 0.001 |
| Obesity | 4.75 | 5.82 | 5.99 | <.0001 | 0.054 | 5.39 | 5.25 | 5.56 | .64 | 0.007 |
| Weight loss | 3.69 | 2.97 | 3.47 | .005 | 0.039 | 3.53 | 3.16 | 3.48 | .21 | 0.018 |
| Fluid and electrolyte disorders | 18.88 | 16.95 | 19.83 | <.0001 | 0.071 | 19.22 | 18.59 | 19.14 | .98 | 0.002 |
| Chronic blood loss anemia | 1.94 | 1.51 | 1.88 | .04 | 0.032 | 1.84 | 1.63 | 1.84 | .42 | 0.015 |
| Deficiency anemia | 30.04 | 25.58 | 29.73 | <.0001 | 0.098 | 29.32 | 28.75 | 29.28 | .62 | 0.008 |
| Alcohol abuse | 0.52 | 0.57 | 0.57 | .61 | 0.007 | 0.54 | 0.53 | 0.53 | .99 | 0.002 |
| Drug abuse | 0.24 | 0.26 | 0.33 | .04 | 0.018 | 0.26 | 0.21 | 0.29 | .98 | 0.016 |
| Psychoses | 3.43 | 2.74 | 3.35 | .007 | 0.039 | 3.27 | 2.98 | 3.25 | .34 | 0.014 |
| Depression | 7.34 | 6.99 | 8.36 | <.0001 | 0.051 | 7.73 | 7.81 | 7.90 | .88 | 0.003 |
ASMD, absolute standard difference; CHF, congestive heart failure; max, maximum; NP, nurse practitioner; PCP, primary care physician; PS, .propensity score; SD, standard deviation.
Blank cells indicate a count <10.
The patient characteristics across care models were compared by chi-square test for categorical variables and by analysis of variance for continuous variables. Two sets of P values from these tests are reported in Table 1. The first P value reports that there is statistical significance for the patient characteristics across care models without PS weighting. The second P value indicates that the majority of patient characteristics are balanced after PS weighting was used.
Average treatment effect summarized the pairwise comparisons of the care models with the weight by the inverse probability of receiving the treatment which patients received (IPTW) was used in multilevel models. In the outcome analyses, we used linear mixed models for continuous outcomes, hierarchical generalized linear mixed (HGLM) models with a binominal distribution and logit link for binary outcomes, HGLM models with Poisson distribution and log link function for count outcomes, and HGLM models with a gamma distribution and log link function for cost with random effect of states.
As a sensitivity analysis, we calculated the nonpooling propensity score that a patient would be cared for by NPs, PCPs, or both, using a multinomial logistic regression model that incorporated the patient characteristics listed in Table 1 for each state.30 Then we used these no-pooling PS for IPTW in the analyses of studied outcomes and adjusted for the covariates that were not balanced after PS weight. This approach controlled for the effect of state regulations intrinsically by balancing the state-level characteristics that affect receipt of care from different care models. All analyses were performed using SAS, version 9.4 (SAS Institute, Inc., Cary, NC) and R package twang 3.3.1.
Results
Patient Demographics and Cohort Characteristics
Our study cohort included a total of 92,890 CHF patients in the United States in 2010. Of these, 34,751 received care from PCPs only, 7,950 received care from NPs only, and 50,189 received what was deemed as shared care. We used different sampling schemes to select patients in the 3 models of care, with 100% of Medicare beneficiaries under the NP-only model, 5% of the PCP-only model, and 20% of the shared care model; this equates to approximately 72.9% of all CHF patients in the PCP model [(34,751*20)/(34,751*20 + 7950 + 50,189*5) = 72.9%], 0.8% in the NP model, and 26.3% in the shared model. Table 1 illustrates the characteristics of the CHF patients by type of primary care model. Patients in the PCP group were more likely to be female, minorities, and older. Patients in the NP group were more likely to be younger, nonmetropolitan residents, and Medicaid eligible. In comparison to the PCP and NP models, shared care patients were more likely to be white, less likely to have Medicaid eligibility, and had more prior hospitalizations and outpatient visits. Additionally, patients in the shared care model had more comorbidity than those in either of the other 2 models. Table 1 also presents the balance in baseline patient characteristics and the absolute standardized mean difference of characteristics among the 3 groups. The maximum pairwise absolute standardized mean difference decreased dramatically after propensity weighting (Fig. 2) and with the maximum value of 0.03 across all characteristics. This indicates that the distributions of covariates among the 3 groups were well balanced.31
Fig. 2.
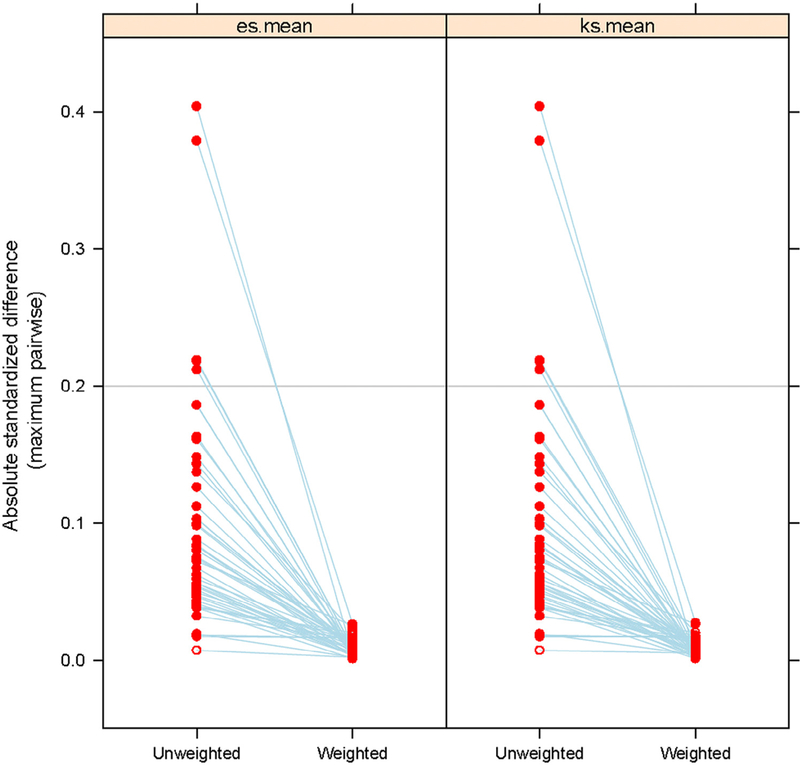
Maximum pairwise absolute standard difference of patient characteristics among PCPs, NPs, and shared care providers before and after propensity weight. es.mean, mean of effect size which measure the balance of 2 means; ks.mean, mean of Kolmogorov-Smirnov statistics, which measure the balance of 2 distributions. Other abbreviations as in Fig. 1.
Processes of Care
Table 2 outlines the processes of CHF care by the 3 models of care. The unadjusted and adjusted results with and without PS weight were calculated for each measure. Patients cared for by NPs had fewer provider visits and slightly lower continuity of care, but were more likely to receive specialist consultations for cardiologists (odds ratio [OR] with PS weight 1.35, 95% confidence interval [CI] 1.32–1.37, P < .0001) than those cared for by PCPs only. They also had a slightly higher likelihood of receiving an echocardiogram (OR 1.03, 95% CI 1.01–1.05, P = .0023). They were more likely to be prescribed ACEI or ARB, beta-blockers, diuretics, and digoxin than those in the PCP cohort.
Table 2.
Difference in Process of Care and Medication Management Among Patients Who Received Care From PCPs, NPs, or Both
| Process of Care | Unadjusted Differences | Unweighted Analysis* | Propensity Score Weighted Analysis | ||||
|---|---|---|---|---|---|---|---|
| PCPs (N = 34,751) | NPs (N = 7950) | Shared Care (N = 50,189) |
NPs vs. PCPs | Shared Care vs. PCPs |
NPs vs. PCPs | Shared Care vs. PCPs |
|
| CHF care, n (%)† | |||||||
| Disease management | 1331 (3.83) | 249 (3.13) | 1581 (3.15) | 0.91 (0.78–1.05) | 0.83 (0.77–0.91)‡ | 0.91 (0.87–0.96)‡ | 0.89 (0.89–0.95)‡ |
| Cardiac rehabilitation | 326 (0.94) | 98 (1.23) | 907 (1.8) | 1.15 (0.91–1.46) | 1.55 (1.36–1.78)‡ | 1.05 (0.97–1.15) | 1.45 (1.34–1.57)‡ |
| Transthoracic or transesophageal echocardiogram |
15,381 (44.26) | 3394 (42.69) | 25,723 (51.25) | 0.99 (0.95–1.05) | 1.30(1.26–1.34)‡ | 1.03 (1.01–1.05)‡ | 1.32(1.30–1.35)‡ |
| Specialist consultation, n (%)† | |||||||
| Cardiologist | 19,499 (56.11) | 4770 (60.00) | 32,952 (65.66) | 1.34 (1.27–1.41)‡ | 1.37 (1.33–1.41)‡ | 1.35 (1.32–1.37)‡ | 1.32(1.30–1.35)‡ |
| Number of provider visits§ | |||||||
| Mean ± SD | 6.91 ± 5.16 | 5.09 ± 4.50 | 9.27 ± 6.14 | –0.29 (–0.30,–0.28)‡ | 0.24 (0.23, 0.24)‡ | –0.30 (–0.30,–0.29)‡ | 0.24 (0.23,0.24)‡ |
| Median (IQR) | 5 (3, 9) | 4 (2, 6) | 8 (5,12) | ||||
| Continuity of care (range 0–1)¶,** | 0.99 | 0.97 | 0.99 | ||||
| Mean ± SD | 0.91 ± 0.18 | 0.89 ± 0.23 | 0.88 ± 0.20 | –0.01 (–0.02,–0.01)‡ | –0.02 (–0.03,–0.02)‡ | –0.02 (–0.02,–0.01)‡ | –0.03 (–0.03,–0.02)‡ |
| Median (IQR) | 1.0(0.14) | 1.0(0.12) | 1.00(0.18) | ||||
| No. providers (mean ± SD) | 1.49 ± 0.85 | 1.36 ± 0.65 | 3.04 ± 1.29 | ||||
| Median (IQR) | 1.0 (1.0) | 1.0 (1.0) | 3.0 (2.0) | ||||
| Medication management | |||||||
| ACE inhibitors or ARBs, n (%)† | 22,031 (63.40) | 5186(65.23) | 33,115 (65.98) | 1.07 (1.02–1.13)‡ | 1.16(1.12–1.19)‡ | 1.09 (1.07–1.11)‡ | 1.15 (1.13–1.18)‡ |
| PDC, mean ± SD†† | 0.75 ± 0.28 | 0.74 ± 0.29 | 0.73 ± 0.29 | ||||
| Median (IQR) | 0.88 (0.40) | 0.88 (0.40) | 0.85 (0.44) | ||||
| Beta-blocker, n (%)† | 23,228 (66.84) | 5421 (68.19) | 36,069 (71.87) | 1.04(0.98, 1.10) | 1.18 (1.15, 1.22)‡ | 1.05 (1.03, 1.07)‡ | 1.18 (1.15, 1.20)‡ |
| PDC, mean ± SD†† | 0.77 ± 0.26 | 0.78 ± 0.26 | 0.76 ± 0.27 | ||||
| Median (IQR) | 0.89 (0.34) | 0.90 (0.32) | 0.88 (0.35) | ||||
| Diuretics, n (%)§ | 24,267 (69.83) | 5828 (73.31) | 38,148 (76.01) | 1.12(1.06–1.19)‡ | 1.23 (1.19–1.27)‡ | 1.10(1.08–1.13)‡ | 1.19 (1.17–1.22)‡ |
| PDC,‡ mean ± SD | 0.69 ± 0.30 | 0.71 ± 0.30 | 0.69 ± 0.29 | ||||
| Median (IQR) | 0.80 (0.47) | 0.82 (0.47) | 0.80 (0.46) | ||||
| Digoxin, n (%)§ | 5734 (16.50) | 1359 (17.09) | 8980 (17.89) | 1.06(0.99–1.13) | 1.06(1.02–1.10)‡ | 1.07 (1.04–1.10)‡ | 1.05 (1.03–1.08)‡ |
| PDC, mean ± SD†† | 0.73 ± 0.30 | 0.74 ± 0.29 | 0.70 ± 0.30 | ||||
| Median (IQR) | 0.88 (0.44) | 0.88 (0.41) | 0.84 (0.47) | ||||
ACE, angiotensin-converting enzyme; ARB, angiotensin II receptor blockers; IQR, interquartile range; MMCI, Modified “Modified” Continuity Index; PDC, proportion of days covered; other abbreviations as in Table 1.
Unweighted analysis were adjusted for age, sex, race, NP regulation, prior hospitalization, Medicaid eligibility, prior year physician visits, comorbidity measures, and urban or rural resident with state as a random effect.
The odds ratio and its 95% confidence interval across 3 care models was estimated by hierarchical generalized linear mixed models with binomial distribution and a logit link.
P < .0001.
The difference and its 95% confidence interval across 3 care models was estimated by hierarchical generalized linear mixed models with Poisson distribution a log link.
Continuity of care among primary care providers was measured by MMCI. For shared care, MMCI was calculated among PCPs.
The PDC measured medication adherence.
The difference and its 95% confidence interval across 3 care models was estimated by linear mixed models.
Patients in the shared care group had more provider visits and more cardiology referrals (OR 1.32, 95% CI 1.30–1.35, P < .0001) than those in the PCP group. They were more likely to have cardiovascular rehabilitation (OR 1.45, 95% CI 1.34–1.57, P < .0001) and to receive an echocardiogram (OR 1.32, 95% CI 1.30–1.35, P < .0001). Also, they were significantly more likely to have a prescription for ACEI/ARB, beta-blocker, diuretics, and digoxin than those in the PCP group. Their measure of continuity of care was slightly lower.
Outcomes
Table 3 shows the outcome measures for patients receiving care under the 3 models. CHF patients in the NP-only care model had a lower rate of ER visits (OR, 0.93, 95% CI 0.91–0.94, P < .0001) and hospitalizations (OR, 0.87, 95% CI 0.85–0.89, P < .0001) than those in the PCP group. The shared care group had more ER visits alizations (OR, 1.34, 95% CI 1.32–1.37, P < .0001) than the PCP-only group. The results among the 3 groups by IPTW using a nonpooling propensity score from each state were similar (NPs vs. PCPs on ER visits and hospitalizations with adjusted OR [aOR] 0.97, 95% CI 0.92–1.02, P = .2093, and aOR 0.91, 95% CI 0.87–0.96, P < .0001, respectively; shared care vs. PCPs on ER visits and hospitalizations with aOR 1.40, 95% CI 1.36–1.44, P < .0001. and aOR 1.33, 95% CI 1.29–1.27, P < .0001, respectively).
Table 3.
Difference in Outcomes Among Patients Received Primary Care From PPCPs Only, NPs Only, or Both (Shared Care)
| Unadjusted Differences | Unweighted Analysis* | Propensity Score Weighted Analysis | |||||
|---|---|---|---|---|---|---|---|
| Outcomes | PCPs (N = 34,751) |
NPs (N = 7950) |
Shared Care (N = 50,189) |
NPs vs. PCPs | Shared Care vs. PCPs |
NPs vs. PCPs | Shared Cared vs. PCPs |
| % with at least 1 ER visit† | 49.29 | 46.53 | 58.80 | 0.92 (0.88–0.97)‡ | 1.45 (1.40–1.49)‡ | 0.93 (0.91–0.94)‡ | 1.41 (1.39–1.44)‡ |
| Number of ER visits, mean (SD)§ | 2.43 (2.20) | 2.39 (2.58) | 2.77 (2.57) | −0.07 (−0.09, −0.04)‡ | 0.26 (0.25–0.27)‡ | −0.06 (–0.07, –0.05)‡ | 0.26 (0.25–0.27)‡ |
| % with at least 1 hospitalization† | 36.99 | 31.72 | 44.36 | 0.85 (0.80–0.90)‡ | 1.36(1.32–1.40)‡ | 0.87 (0.85–0.89)‡ | 1.34 (1.32–1.37)‡ |
| Number of hospitalizations, mean (SD)§ | 0.61 (1.08) | 0.51 (0.97) | 0.81 (1.25) | −0.15 (−0.19, −0.12)‡ | 0.23 (0.21–0.25)‡ | −0.13 (−0.14,–0.12)‡ | 0.22 (0.21–0.23)‡ |
| Total Medicare Spending mean (SD)¶,** | $12,980 ($20,358) | $11,838 ($20,249) | $16,908 ($23,492) | −$780 (−$1096, −$456)‡ | $3302 ($3052–$3555)‡ | −$237 (−$467, –$3)‡ | $3416 ($3125—$3,714)‡ |
ER, emergency room; all other abbreviations as in Table 1.
Unweighted analysis were adjusted for age, sex, race, NP regulation, prior hospitalization, Medicaid eligibility, prior year physician visits, comorbidity measures, and urban or rural resident with state as a random effect.
The odds ratio and its 95% confidence interval across 3 care models was estimated by hierarchical generalized linear mixed models with binomial distribution and a logit link.
P < .0001.
The difference and its 95% confidence interval across 3 care models was estimated by hierarchical generalized linear mixed models with Poisson distribution a log link.
Total cost difference was significant in both PS weighted and PS unweighted models.
Difference and its 95% confidence interval in total Medicare spending among 3 care models was estimated by hierarchical generalized linear mixed models with gamma distribution and a log link.
We also examined whether the differences in ER visits and hospitalizations among the 3 care models were accounted by their differences in processes of care using the HGLM model with binomial distribution and a logit link. In the models adjusted for chronic disease management, cardiac rehabilitation, echocardiogram, Modified “Modified” Continuity Index, provider visits, cardiologist consultation, and medication management, the ORs of ER visits and hospitalizations were somewhat closer to null for NPs compared with PCPs (OR changed from 0.93 to 0.99 [95% CI 0.97–1.01, P = .4842] and from 0.87 to 0.91 [95% CI 0.89–0.93, P < .0001], respectively). The ORs of ER visits and hospitalizations for the comparisons between shared care and PCPs were also reduced (OR changed from 1.41 to 1.24 [95% CI 1.22–1.27, P < .0001] and from 1.34 to 1.16 [95% CI 1.13–1.18, P < .0001], respectively).
Table 3 also shows that the total Medicare spending with PS weight was slightly lower in the NP-only group than in the PCP-only group (–$237, 95% CI –$3 to –$467, P = .0457) and was significantly higher in the shared care group than in PCP-only group ($3416, 95% CI $3125–$3714, P < .0001). The results were similar for the comparisons between patients in the shared care and PCP-only group in the IPTW with nonpooling PS approach ($3328, 95% CI $3062–$3600, P < .0001). However, the difference in the adjusted total Medicare spending between patients in the NP-only and PCP-only group became insignificant in the IPTW analyses with nonpooling PS.
Discussion
We found that CHF patients receiving primary care under the shared care model had a higher burden of physical and psychological comorbidity than CHF patients under PCP-only or NP-only primary care. The shared care model CHF patients also had the highest rate of prior hospitalizations and outpatient visits. This is not surprising, given that the more complicated patients with CHF likely need more clinical resources and frequent encounters with NPs, PCPs, and other clinicians (e.g., dietitians) to better integrate and coordinate their care. Frequent clinic visits by CHF patients may help in reducing the high rate of recurrent hospitalizations reported in CHF patients.32,33
CHF patients under the NP or shared care models are more likely than those under the PCP model to be referred to cardiologists and to get guideline-recommended tests and medications. The frequent cardiology consultations do partially contribute to the higher adherence to ACEI/ARB, beta-blocker, and echocardiography use when the analyses of the data was adjusted for cardiologist consultation (results not shown). Paralleling the frequent use of specialist under the NP model is infrequent primary care visits and lower continuity of care. The low continuity of care is consistent with a prior study that showed that 54% of Medicare patients under the NP model switched to physicians or the shared model for their primary care over a 3-year period.34 The higher use of specialist consultations by NPs is also consistent with prior studies.20,21 Of note, CHF patients under the NP model were younger and had fewer comorbidities than those under the PCP or shared care model. It is therefore not surprising that the rates of ER visits and total Medicare spending were no longer significant between the NP and PCP models after propensity weighting and adjustment for processes of CHF care.
Different models of care and chronic disease management programs have been implemented to reduce recurrent hospitalizations and improve quality of life for CHF patients.35–38 A 2013 systematic review of studies of the impact of case management programs led by a nurse in adults with complex chronic diseases and multimorbidity found that these programs did not reduce mortality but increased patient satisfaction, CHF-related quality of life, and patients’ adherence to self-management behaviors.38 The CHF patients under the shared care in our study still experienced a high rate of ER visits and hospitalizations despite having a high rate of cardiac rehabilitation and cardiology consultation. This likely reflects the complex medical, psychosocial, and functional care needs of the older CHF patients; these cannot be completely controlled for in our analyses. Using observational data analyses to study the shared team care model is very complex. Administrative data lack information about the degree and quality of patient care shared by NPs and PCPs. Future studies are needed to conduct analyses at practice levels.
Limitations of our study include limited generalizability of our findings to younger patients or those with commercial insurance. Lacking in our analysis is an indicator of severity of CHF, such as ejection fraction measures and New York Heart Association classification of symptom severity. Also, because of the more recent health care changes (e.g., the Affordable Care Act), the results from our cross-sectional study focusing on the 2009–2010 period may not be easily extrapolated to the current period. It is also possible that we did not capture all patients who received all their primary care from NPs. Medicare allows physicians to submit E&M charges for a split or shared visit in which both the physician and NP treat the patient.39 In such situations, the physician rather than the NP would normally submit the charge, because NPs have a 15% lower reimbursement rate.40 This possibility will underestimate number of patients under NP and shared care and overestimate those under PCP care, thus reducing the magnitude of our findings when comparing NPs or shared care with PCPs.
Another limitation is the absence of data on social and functional factors (e.g., social isolation, functional disability, lack of transportation) known to affect adherence to CHF care recommendations.6,7,33–35,41 Our use of Medicaid eligibility as a surrogate for social factors is at best an underestimation of their impact. In addition, we did not examine patient mortality across care models in this study. Some patients who are hospitalized may benefit from these hospitalizations by a reduction in mortality. The biggest limitation is that we do not know the extent to which the shared care model is actually shared care. Use of social network analysis to identify team practices should be explored. Also, onsite interviewing of NPs, physicians, and CHF patients under shared care may provide better understanding of the specific roles of NPs versus PCPs in a team care model and the extent and quality of collaboration among the clinicians.
Our findings have implications for health care policy, given the high rates of hospitalization and ER visits in older CHF patients with multiple comorbidities.5–14,30,31 The delivery of CHF care mirrors the severity of comorbidity in these patients, with the relatively healthier patients receiving NP-only primary care and the sicker patients having varying degrees of PCP involvement in physician-only or in a shared care model. The high rates of hospitalization and ER visits by CHF patients under shared care underscore the need to design and implement more effective chronic disease management and integrated care programs that also address the psychosocial and functional factors that impact outcomes and adherence to CHF care recommendations.5–10 As is commonly seen in clinical practice, it is highly unlikely that 1 model of care will best provide for all patients. Flexible, patient-centered approaches to provision of health care that are tailored to the individual needs of the patient are the ultimate goal. In addition to CHF, it is important to consider all concurrent comorbidities for elderly care. Future studies are needed on the impact of the 3 primary care models on patient satisfaction and long-term continuity of primary care, the costeffectiveness of frequent specialist consultations by NPs, overall Medicare spending, and how the effectiveness of models varies by subgroup of patients with different multiple comorbidities.
Supplementary Material
Acknowledgments
Funding: The authors have no financial, personal, or potential conflicts of interest to disclose. This work was supported by grants R01-HS020642 and R24-HS022134 from the Agency for Healthcare Research and Quality and UL1TR000071 from the National Institutes of Health.
Footnotes
Supplementary Data
Supplementary data related to this article can be found at doi:10.1016/j.cardfail.2017.08.459.
References
- 1.Roger VL. Epidemiology of heart failure. Circ Res 2013;113:646–59. [DOI] [PMC free article] [PubMed] [Google Scholar]
- 2.Mozaffarian D, Benjamin EJ, Go AS, Arnett DK, Blaha MJ, Cushman M, et al. Heart disease and stroke statistics—2015 update: a report from the American Heart Association. Circulation 2015;131:e29–322. [DOI] [PubMed] [Google Scholar]
- 3.McMurray JJ. Clinical practice. Systolic heart failure. N Engl J Med 2010;362:228–38. [DOI] [PubMed] [Google Scholar]
- 4.Melander S, Miller S. Heart failure. Nurs Clin North Am 2016;51:13–27. [DOI] [PubMed] [Google Scholar]
- 5.Sochalski J, Jaarsma T, Krumholz HM, Laramee A, McMurray JJ, Naylor MD, et al. What works in chronic care management: the case of heart failure. Health Aff (Millwood) 2009;28:179–89. [DOI] [PubMed] [Google Scholar]
- 6.Jaarsma T Inter-professional team approach to patients with heart failure. Heart 2005;91:832–8. [DOI] [PMC free article] [PubMed] [Google Scholar]
- 7.Kutzleb J, Rigolosi R, Fruhschien A, Reilly M, Shaftic AM, Fruhschien A, et al. Nurse practitioner care model: meeting the health care challenges with a collaborative team. Nurs Econ 2015;33:297–304. [PubMed] [Google Scholar]
- 8.Nyweide DJ, Anthony DL, Bynum JPW, Strawderman RL, Weeks WB, Casalino LP, et al. Continuity of care and the risk of preventable hospitalization in older adults. JAMA Intern Med 2013;173:1879–85. [DOI] [PMC free article] [PubMed] [Google Scholar]
- 9.Hussey PS, Schneider EC, Rudin RS, Fox DS, Lai J, Pollack CE. Continuity and the costs of care for chronic disease. JAMA Intern Med 2014;174:742–8. [DOI] [PMC free article] [PubMed] [Google Scholar]
- 10.Atlas SJ, Grant RW, Ferris TG, Chang Y, Barry MJ. Patient-physician connectedness and quality of primary care. Ann Internal Med 2009;150:325–35. [DOI] [PMC free article] [PubMed] [Google Scholar]
- 11.Wolinsky FD, Bentler SE, Liu L, Geweke JF,Cook EA, Obrizan M, et al. Continuity of care with a primary care physician and mortality in older adults. J Gerontol A Biol Sci Med Sci 2010;65:421–8. [DOI] [PMC free article] [PubMed] [Google Scholar]
- 12.Adler R, Vasiliadis A, Bickell N. The relationship between continuity and patient satisfaction: a systematic review. Family Pract 2010;27:171–8. [DOI] [PubMed] [Google Scholar]
- 13.van Walraven C, Oake N, Jennings A, Forster AJ. The association between continuity of care and outcomes: a systematic and critical review. J Eval Clin Pract 2010;16:947–56. [DOI] [PubMed] [Google Scholar]
- 14.Peikes D, Chen A, Schore J, Brown R. Effects of care coordination on hospitalization, quality of care, and health care expenditures among Medicare beneficiaries: 15 randomized trials. JAMA 2009;301: 603–18. [DOI] [PubMed] [Google Scholar]
- 15.Kuo YF, Loresto F, Rounds LR, Goodwin JS. States with the least restrictive regulations experienced the largest increase in patients seen by nurse practitioners. Health Aff (Millwood) 2013;32:1236–43. [DOI] [PMC free article] [PubMed] [Google Scholar]
- 16.The White House—President Barack Obama. Creating health care jobs by addressing primary care workforce needs. Available at: https://obamawhitehouse.archives.gov/the-press-office/2012/04/11/fact-sheet-creating-health-care-jobs-addressing-primary-care-workforce-n. Accessed September 25, 2017.
- 17.US Department of Health and Human Services, Health Resources and Services Administration, National Center For Health Workforce Analysis. Projecting the supply and demand for primary care practitioners through 2020. Rockville, MD: US Department of Health and Human Services; 2013. Available at: https://bhw.hrsa.gov/health-workforce-analysis/primary-care-2020. Accessed January 5, 2017. [Google Scholar]
- 18.The Affordable Care Act supports patient-centered medical homes in health centers. Available at: http://www.ncsl.org/research/health/the-medical-home-model-of-care.aspx. Accessed March 25, 2016.
- 19.Kuo YF, Chen NW, Baillargeon J, Raji MA, Goodwin JS. Potentially preventable hospitalizations in Medicare patients with diabetes: a comparison of primary care provided by nurse practitioners versus physicians. Med Care 2015;53:776–83. [DOI] [PMC free article] [PubMed] [Google Scholar]
- 20.Kuo YF, Goodwin JS, Chen NW, Lwin KK, Baillargeon J, Raji MA. Diabetes care provided by nurse practitioners versus primary care physicians. J Am Geriatr Soc 2015;63:1980–8. [DOI] [PMC free article] [PubMed] [Google Scholar]
- 21.Agarwal A, Zhang W, Kuo Y, Sharma G. Process and outcome measures among COPD patients with a hospitalization cared for by an advance practice provider or primary care physician. PLoS ONE 2016;11: e0148522. doi: 10.1371/journal.pone.0148522. [DOI] [PMC free article] [PubMed] [Google Scholar]
- 22.Chronic condition categories. Chronic Condition Data Warehouse [on-line]. Available at: http://www.ccwdata.org/chronic-conditions/index.htm. Accessed October 7, 2011.
- 23.Elixhauser A, Steiner C, Harris RD, Coffey RM. Comorbidity measures for use with administrative data. Med Care 1998;36:8–27. [DOI] [PubMed] [Google Scholar]
- 24.Gill JM, Mainous AG 3rd. The role of provider continuity in preventing hospitalizations. Arch Fam Med 1998;7:352–7. [DOI] [PubMed] [Google Scholar]
- 25.Sharma G, Fletcher KE, Zhang D, Kuo YF, Freeman JL, Goodwin JS. Continuity of outpatient and inpatient care for hospitalized older adults. JAMA 2009;3s01:1671–80. [DOI] [PMC free article] [PubMed] [Google Scholar]
- 26.National Quality Forum Endorses Cardiovascular Measures. Available at: https://www.qualityforum.org/News_And_Resources/Press_Releases/2012/NQF_Endorses_Cardiovascular_Measures.aspx. Accessed December 17, 2015.
- 27.Choudhry NK, Shrank WH, Levin RL, Lee JL, Jan SA, Brookhart MA, et al. Measuring concurrent adherence to multiple related medications. Am J Manag Care 2009;15:457–64. [PMC free article] [PubMed] [Google Scholar]
- 28.Griffin BA, Ridgeway G, Morral AR, Burgette LF, Martin C, Almirall D. et al. Toolkit for Weighting and Analysis of Nonequivalent Groups (TWANG) website. Santa Monica, CA: RAND Corporation; 2014. Available at: http://www.rand.org/statistics/twang. Accessed March 25, 2016. [Google Scholar]
- 29.McCaffrey DF, Griffin BA, Almirall D, Slaughter ME, Ramchand R, Burgette LF. A tutorial on propensity score estimation for multiple treatments using generalized boosted models. Stat Med 2013;32:3388–414. [DOI] [PMC free article] [PubMed] [Google Scholar]
- 30.Griswold ME, Localio AR, Mulrow C. Propensity score adjustment with multilevel data: setting your sites on decreasing selection bias. Ann Intern Med 2010;152:293–5. [DOI] [PubMed] [Google Scholar]
- 31.Austin PC. Balance diagnostics for comparing the distribution of baseline covariates between treatment groups in propensity-score matched samples. Stat Med 2009;28:3083–107. [DOI] [PMC free article] [PubMed] [Google Scholar]
- 32.Jencks SF, Williams MV, Coleman EA. Rehospitalizations among patients in the Medicare fee-for-service program. N Engl J Med 2009;360:1418–28. [DOI] [PubMed] [Google Scholar]
- 33.American College of Cardiology Foundation/American HeartAssociation Task Force on Practice Guidelines Writing Committee Members, Yancy CW, Jessup M, Bozkurt B, Butler J, Casey DE Jr, et al. 2013 ACCF/ AHA guideline for the management of heart failure: a report of the American College of Cardiology Foundation/American Heart Association Task Force on practice guidelines. Circulation 2013;128:e240–327. [DOI] [PubMed] [Google Scholar]
- 34.Raji MY, Chen NW, Raji M, Kuo YF. Factors associated with seeking physician care by Medicare beneficiaries who receive all their primary care from nurse practitioners. J Prim Care Community Health 2016;7:249–57. [DOI] [PMC free article] [PubMed] [Google Scholar]
- 35.Azad NA, Mielniczuk L. A call for collaboration: improving cardiogeriatric care. Can J Cardiol 2016;32:1041–4. [DOI] [PubMed] [Google Scholar]
- 36.Boyd C, Leff B, Wolf J, Yu Q, Zhou J, Rand C, et al. Informing clinical practice guideline development and implementation: prevalence of coexisting conditions among adults with CHD. J Am Geriatr Soc 2011;59:797–805. [DOI] [PMC free article] [PubMed] [Google Scholar]
- 37.Forman DE, Rich MW, Alexander KP, Zieman S, Maurer MS, Najjar SS, et al. Cardiac care for older adults: time for a new paradigm. J Am Coll Cardiol 2011;57:1801–10. [DOI] [PMC free article] [PubMed] [Google Scholar]
- 38.Hickam DH, Weiss JW, Guise J-M, Buckley D, Motu’apuaka M, Graham D. et al. Outpatient case management for adults with medical illness and complex care needs Comparative Effectiveness Review No. 99. Rockville, MD: Agency for Healthcare Research and Quality; 2013. Available at: https://effectivehealthcare.ahrq.gov/topics/case-management/research/. Accessed January 3, 2017 (Prepared by the Oregon Evidencebased Practice Center under Contract No. 290–2007-10057-I.) AHRQ PublicationNo.13-EHC031-EF. [PubMed] [Google Scholar]
- 39.Medicare claims processing manual: Chapter 12 Physicians/Nonphysician practitioners. Available at: https://www.cms.gov/Regulations-and-Guidance/Guidance/Manuals/downloads/clm104c12.pdf. Accessed January 3, 2017.
- 40.Kleinpell RM, Frech KD, Diamond EJ. Billing for nurse practitioner provider services: updates on coding regulations. Nurse Pract 2007;32:16–7. [DOI] [PubMed] [Google Scholar]
- 41.Ahmad FS, Barg FK, Bowles KH, Alexander M, Goldberg LR, French B, et al. Comparing perspectives of patients, caregivers, and clinicians on heart failure management. J Card Fail 2016;22: 210–7. [DOI] [PMC free article] [PubMed] [Google Scholar]
Associated Data
This section collects any data citations, data availability statements, or supplementary materials included in this article.