VL-2397, a novel, systemic antifungal agent, has potent in vitro and in vivo fungicidal activity against Aspergillus species. Plasma concentrations from a phase 1 study were used to construct a population pharmacokinetic (PPK) model for VL-2397.
KEYWORDS: VL-2397, aspergillosis, nonlinear kinetics, population pharmacokinetics, saturable binding kinetics
ABSTRACT
VL-2397, a novel, systemic antifungal agent, has potent in vitro and in vivo fungicidal activity against Aspergillus species. Plasma concentrations from a phase 1 study were used to construct a population pharmacokinetic (PPK) model for VL-2397. Healthy subjects aged 18 to 55 years received single doses of VL-2397, ranging from 3 to 1,200 mg, multiple daily doses of 300, 600, or 1,200 mg for 7 days, or 300 mg three times/day for 7 days followed by 600 mg daily for 21 days. Plasma samples were collected throughout the dosing intervals. Sixty-six subjects provided 1,908 concentrations. Drug concentrations over time were increased less than dose proportionally for doses above 30 mg. Dose-normalized concentrations plotted over time did not overlap. A 3-compartment nonlinear saturable binding model fit the data well. Clearance increased with dose, and mean values ranged from 0.4 liters/h at 3 mg to 8.5 liters/h at 1,200 mg. Mean volume in the central compartment ranged from 4.8 to 6.9 liters across doses. In the first 24 h, once-daily dosing results in a rapid decrease in concentrations by hour 16 to approximately 1 mg/liter, regardless of dose, with slow clearance over time. Administration of 300 mg every 8 h achieved concentrations above 1 mg/liter over an entire 24-h period. There was a significant relationship between body surface area and clearance. The data suggest that VL-2397 has nonlinear saturable binding kinetics. Protein binding is the likely primary source of the nonlinearity. The PPK model can now be used to optimize dosing by bridging the kinetics to efficacious pharmacodynamic targets.
INTRODUCTION
Invasive aspergillosis (IA) is a rapidly life-threatening fungal disease (1). There has been a progressive expansion of anti-Aspergillus agents in recent years. Nevertheless, suboptimal therapeutic outcomes are still relatively common and result at least in part from antifungal drug resistance, drug toxicity, drug-drug interactions, and pharmacokinetic (PK) variability (2, 3). Hence, there is an urgent need to develop new antifungal agents with novel mechanisms of action (MOA).
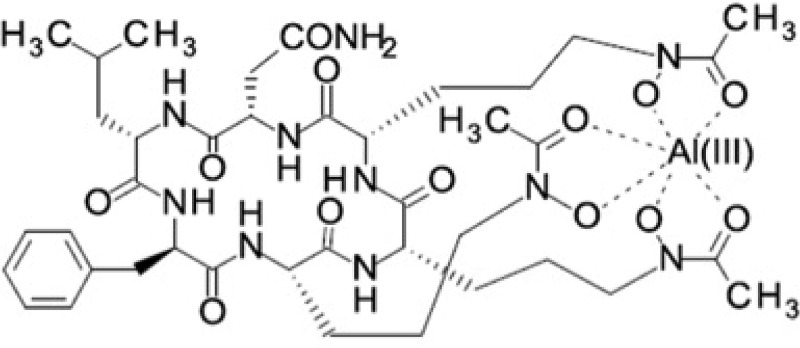
VL-2397 is a natural product isolated from Acremonium persicinum (strain MF-347833) that exhibits potent in vitro and in vivo activity against medically important Aspergillus species (4, 5). VL-2397 is a hexapeptide with a molecular weight of 915.4 Da (5). The complex structure resembles ferrichrome, which is a siderophore that chelates iron via the siderophore transporter Sit1 (Fig. 1). The intracellular target that is ultimately responsible for antifungal activity is not known (5, 6). Mammalian cells do not utilize the Sit1 siderophore transporter (7), which is one potential explanation for differential activity in fungi and animals.
FIG 1.
Chemical structure of VL-2397. Abbreviations: C, carbon; O, oxygen; H, hydrogen; N, nitrogen; Al, aluminum.
VL-2397 is a polar molecule having a hydropathy value of ∼7.6. It is formulated in D5W at 1.2 mg/ml, which is below the maximum solubility concentration of 1.5 mg/ml. Mass balance studies in rats showed that ∼95% of a VL-2397 dose of 8 mg/kg of body weight could be recovered unmetabolized in the urine and feces 168 h after administration. The kidney was the major organ of accumulation, with no significant accumulation observed in the brain.
VL-2397 demonstrates rapid (within the first 2 to 4 h) and potent in vitro fungicidal activity (MIC90 values of ≤2 mg/liter) against Aspergillus fumigatus (including triazole-resistant A. fumigatus), A. terreus, A. flavus, A. nidulans, Candida glabrata, C. kefyr, Cryptococcus neoformans, and Trichosporon asahii. The agent demonstrates limited in vitro activity (MIC90 values of ≤8 mg/liter) against Fusarium solani and does not appear to be active (MIC90 values of >16 mg/liter) against A. niger, Candida spp. (with the exception of C. glabrata and C. keyfr), Mucorales, Scedosporium apiospermum, and Fonsecaea pedrosoi. Live cell imaging suggests that VL-2397 causes arrest of hyphal elongation (6). VL-2397 causes dose-dependent prolongation of survival and reduction in fungal burden in the lung of immunocompromised mice with invasive pulmonary aspergillosis (8).
A first-in-human phase I clinical trial with VL-2397 (VL2397-101) has been completed and is described elsewhere. Here, we describe the population PK (PPK) of VL-2397 in normal healthy subjects. These data and population PK models provide one of the critical steps for defining safe and effective regimens for patients with IA.
RESULTS
Study population.
Sixty-six healthy subjects from 11 cohorts contributed data for analysis. The median age, body mass index (BMI), and body surface area (BSA) were 43 years (range, 21 to 55 years), 26.7 kg/m2 (range, 20.1 to 30 kg/m2), and 1.85 m2 (range, 1.52 to 2.43 m2), respectively. The majority of patients were male (44; 66.7%) and Caucasian (53; 80%). All subjects completed the dosing schedules as planned except for 2 subjects from multiple-ascending-dose (MAD) cohort 10 (1,200 mg), who were discontinued early due to adverse events after 1 and 2 dosages, respectively.
Assessment of plasma concentrations versus time.
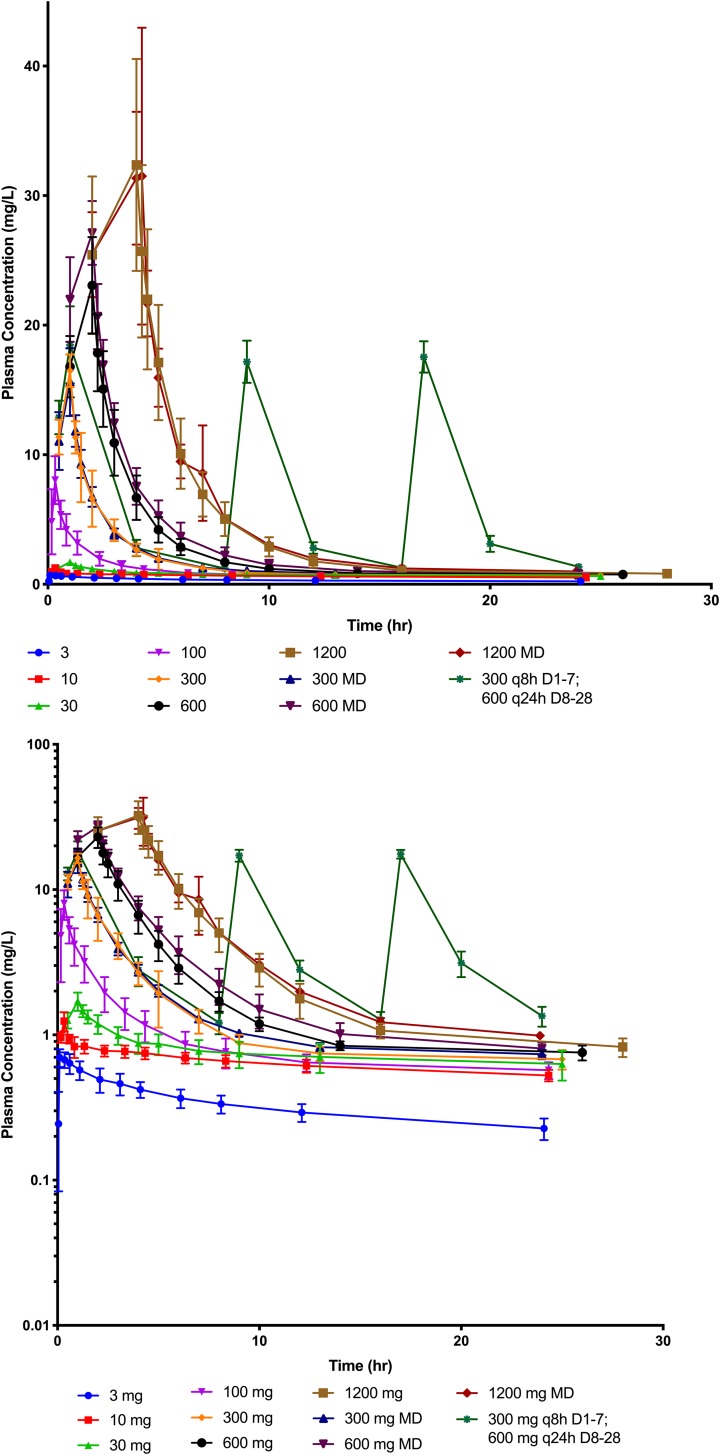
A total of 1,908 plasma concentrations were collected. The drug concentrations over time did not increase proportionally with dose. Figure 2 shows plots of the first 24 h for cohorts 1 to 11 in the first 24 h on both a linear and semilogarithmic scale. Within the first 16 h, the concentrations for the once-daily doses were at or below 1 mg/liter and remained at this level through the rest of the dosing interval. This suggested a rapid and saturable distribution phase. Figure 3 shows the plasma concentration versus time for each patient after normalizing each by the daily dose. There was minimal overlap of these plots, suggesting nonlinearity, especially above dosages of 30 mg per day.
FIG 2.
VL-2397 plasma concentration versus time over the first 24 h after dosing for all cohorts on a linear (upper) and semilogarithmic (lower) scale. Mean values (±standard deviations [SD]) for each time point at each dosage level are represented by the symbols and bars above and below each symbol. Milligram doses are represented in the graph. MD, multiple dose; TID, dosing three times a day; QD, once-daily dosing.
FIG 3.
Dose-normalized plasma concentration versus time by cohort. (Upper) Dose-normalized concentrations over the first 24 h for cohorts 1 to 11. (Middle) Dose-normalized concentrations over time for the single-dose cohorts 1 to 7. (Lower) Dose-normalized concentrations over time for the multiple-dose cohorts (8 to 11). Mean values (±SD) for each time point at each dosage level are represented by the symbols and bars above and below each symbol. (Milligram doses are represented in the graph. MD, multiple dose.)
Population pharmacokinetic modeling.
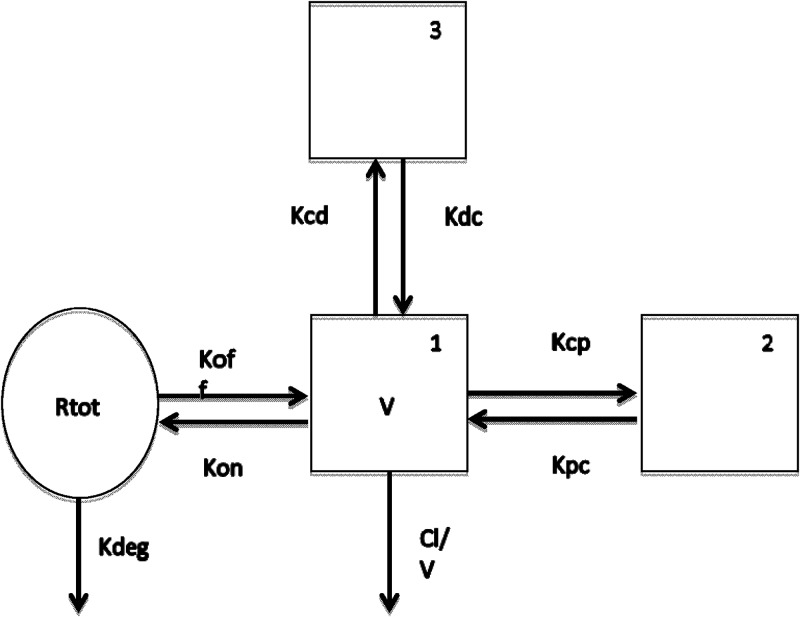
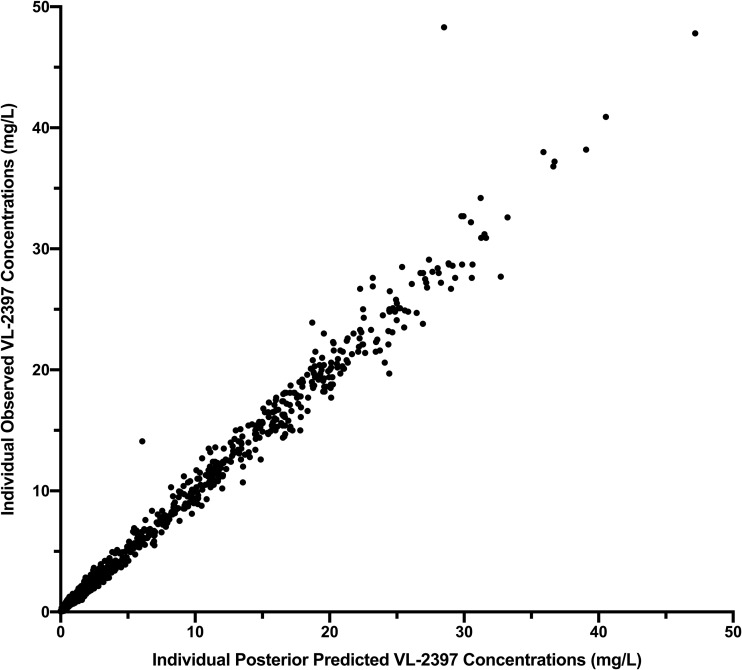
A nonlinear saturable binding model with 3 compartments fit the data well. The structural model is illustrated in Fig. 4. Visual inspection of the observed versus posterior predicted concentrations after the Bayesian step was acceptable. The coefficient of determination (r2) was 0.987 with a slope of 1.01 (95% confidence interval [CI], 1 to 1.01) for the linear regression of the observed versus predicted mean concentrations (Fig. 5). Measures of bias and imprecision were also acceptable (−0.124 and 1.04, respectively). Individual plots for the observed-predicted concentrations over time showed reasonable predictions by the model. The final estimates of the model parameters are summarized in Table 1. The area under the plasma concentration-time curve (AUC) for each dose cohort is summarized in Table 2. As illustrated by the dose-normalized plots, AUC did not increase in a proportional manner. Clearance increased with dose, and mean values ranged from 0.4 liters/h at 3 mg to 8.5 liters/h at 1,200 mg. Mean volume in the central compartment ranged from 4.8 to 6.9 liters across doses.
FIG 4.
Illustration of structural PPK nonlinear saturable binding model. Structural illustration of the population PK model. Boxes represent the plasma compartments (1 is central, 2 and 3 are peripheral). The circle represents the binding compartment. Arrows demonstrate the flow of drug through the compartments and elimination. Abbreviations: CL, clearance; V, volume in the central compartment; Kcp, Kcp, Kpc, Kcf, and Kfc, rate constants for drug moving from the different compartments (c, central; p, peripheral; f, third compartment); Kon and Koff, rate constants of association and dissociation; Rtot, maximum binding; Kdeg, rate constant regulating clearance from the binding compartment.
FIG 5.
Observed versus posterior predicted plasma concentration values for individual subjects. Observed versus posterior predicted concentrations (milligrams/liter) from the final model after the Bayesian step (r2 = 0.987, slope = 1.01 [95% CI, 1.00 to 1.01], intercept = −0.0304 [95% CI, −0.0217 to 0.0825]). The dotted line is the line of unity where observed concentrations equal predicted concentrations.
TABLE 1.
Median posterior parameter estimates for the best modela
| Parameter | Mean | Population SD | Median | Range |
|---|---|---|---|---|
| CL/F (liters/h) | 5.56 | 3.57 | 6.80 | 0.25–9.95 |
| V (liters) | 6.68 | 2.58 | 6.10 | 3.50–14.80 |
| Kcp (h−1) | 2.31 | 1.75 | 2.45 | 0.025–4.98 |
| Kpc (h−1) | 2.86 | 1.83 | 2.68 | 0.04–5.97 |
| Kon (h−1) | 0.57 × 10⁻⁶ | 0.44 × 10⁻⁶ | 0.35 × 10⁻⁶ | 0.008 × 10⁻⁶–1.49 × 10⁻⁶ |
| Koff (h−1) | 21.01 × 10⁻⁶ | 20.25 × 10⁻⁶ | 10.33 × 10⁻⁶ | 0.35 × 10⁻⁶–49.75 × 10⁻⁶ |
| Rtot (mol) | 1.79 × 10⁴ | 1.25 × 10⁴ | 1.46 × 10⁴ | 0.52 × 10⁴–3.98 × 10⁴ |
| Kcf (h−1) | 0.50 | 0.35 | 0.45 | 0.06–1.42 |
| Kfc (h−1) | 0.69 | 0.90 | 0.22 | 0.02–2.99 |
| Kdeg (h−1) | 0.010 | 0.010 | 0.010 | 0.0003–0.050 |
Abbreviations: CL, clearance; F, bioavailability; V, volume in the central compartment; Kcp, Kpc, Kcf, and Kfc, rate constants for drug moving from the different compartments (c, central; p, peripheral; f, third compartment); Kon and Koff, rate constants of association and dissociation; Rtot, maximum binding; Kdeg, rate constant regulating clearance from the binding compartment.
TABLE 2.
AUC values (SD) estimated from the PPK for each dose cohorta
| Cohort and dosing regimen | AUC∞ (mg·h/liter) | AUC0–24 (mg·h/liter) (day 1) | AUC144–168b (mg·h/liter) |
|---|---|---|---|
| Single dose | |||
| 1 (3 mg) | 27.1 (4.2) | ||
| 2 (10 mg) | 70.1 (7.6) | ||
| 3 (30 mg) | 80.8 (24.9) | ||
| 4 (100 mg) | 83.6 (28.8) | ||
| 5 (300 mg) | 104.3 (12.8) | ||
| 6 (600 mg) | 150.6 (17.7) | ||
| 7 (1,200 mg) | 236.0 (46.7) | ||
| Multiple dose | |||
| 8 (300 mg) | 319.9 (26.5) | 133.1 (6.3) | |
| 9 (600 mg) | 711.2 (104.5) | 206.1 (24.9) | |
| 10 (1,200 mg) | 1,352.1 (801.6) | 302.6 (17.7) | |
| 11 (day 1 to 7, 300 mg every 8 h; day 8 to 28, 600 mg every 24 h) | 856.51 (120.0) | 1,237.2 (127.0) |
Values are given as means (SD).
AUC144–168 is only applicable to the multiple-dose cohorts (8, 9, 10, and 11).
Assessment of covariates.
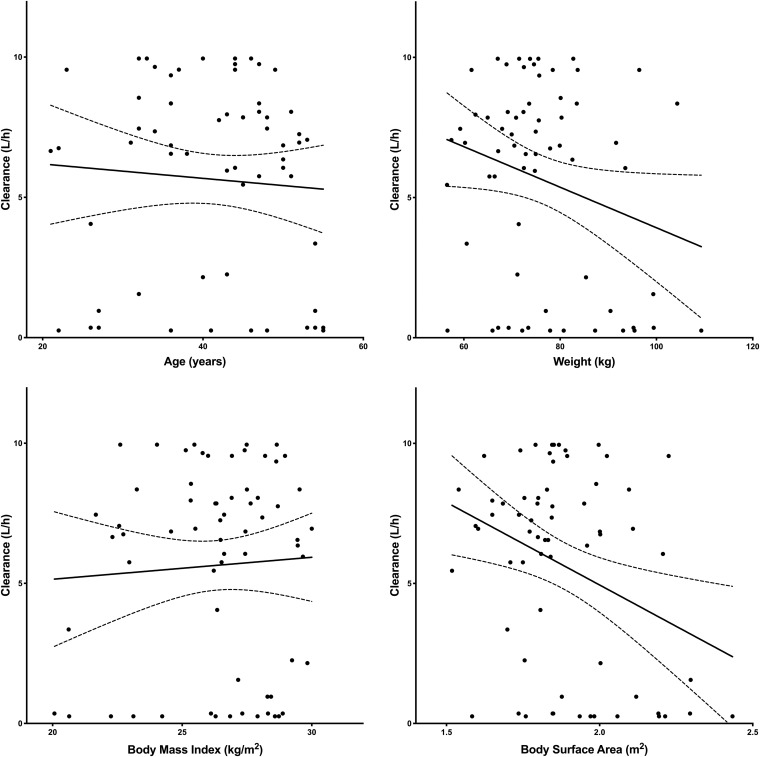
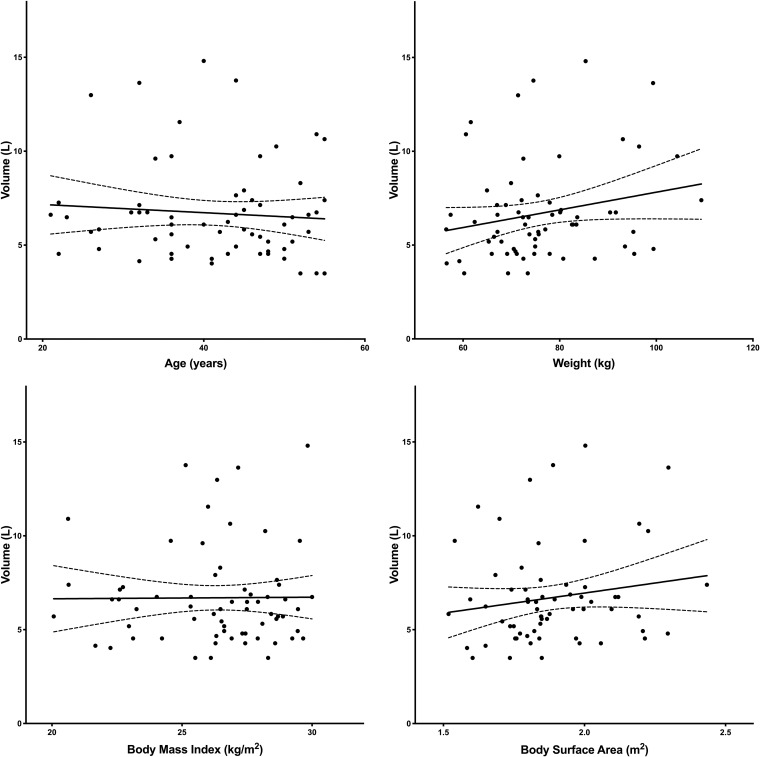
Figures 6 and 7 illustrate the relationship of age, weight, BMI, and BSA to clearance and volume, respectively. The only covariate relationship found to be significant was BSA on clearance. Clearance decreased with increasing BSA (95% confidence interval for the slope was −10.19 to −1.61) (Fig. 6). There was no relationship between sex and race on clearance or volume (P > 0.5).
FIG 6.
Linear regression analysis to describe the relationship of clearance and age (upper left), weight (upper right), BMI (lower left), and BSA (lower right). (Upper left) CL versus age: slope of −0.03 [95% CI, −0.12 to 0.07], r2 = 0.005, P = 0.59. (Upper right) CL versus weight: slope of −0.07 [95% CI, −0.14 to 0.0002], r2 = 0.06, P = 0.05. (Lower left) CL versus BMI: slope of 0.08 [95% CI, −0.28 to 0.43], r2 = 0.003, P = 0.66. (Lower right) CL versus BSA: slope of −5.9 [95%, CI −10.2 to −1.6], r2 = 0.12, P = 0.008.
FIG 7.
Linear regression analysis to describe the relationship of volume and age (upper left), weight (upper right), BMI (lower left), and BSA (lower right). (Upper left) V versus age: slope of −0.02 [95% CI, −0.09 to 0.05], r2 = 0.006, P = 0.53. (Upper right) V versus weight: slope of 0.05 [95% CI, −0.006 to 0.1], r2 = 0.05, P = 0.08. (Lower left) V versus BMI: slope of 0.008 [95% CI, −0.25 to 0.27], r2 = 0.000, P = 0.95. (Lower right) V versus BSA: slope of 2.1 [95% CI, −1.15 to 5.42], r2 = 0.03, P = 0.20.
DISCUSSION
VL-2397 is a systemic antifungal agent that is being developed for the treatment of invasive aspergillosis. This compound is one of the few agents in development with a novel mechanism of action that may have the potential to overcome some of the limitations of currently licensed agents. Noncompartmental analysis of the pharmacokinetic data in this study revealed that VL-2397 exhibited nonlinear pharmacokinetics (P. Mammen, D. Armas, F. Hughes, A. Hopkins, C. Fisher, P. Resch, D. Rusalov, S. Sullivan, L. Smith, unpublished data).
Early in vitro studies using equilibrium dialysis suggested nonlinear protein binding is responsible for the nonlinear pharmacokinetics of VL-2397 (unpublished data). Zinc-alpha-glycoprotein is the primary protein VL-2397 binds to, and the studies showed that the binding decreases as concentrations increase. This insight and the visual inspection of the raw data led to development of a saturable binding compartment and empirically splitting the total drug concentration into free and bound compartments. The saturable binding model that was used was derived from modifications of standard Michaelis-Menten terms and target-mediated drug disposition models (9). While this model did result in a significant improvement in the goodness of fit, it did not adequately describe the terminal phase of elimination where there was considerable overprediction of the observed concentrations. To account for this deficiency, a degradation component was added to the binding compartment to represent proteolytic loss of drug. The addition of this loss component improved model predictions. The binding compartment at this stage is hypothetical and needs to be further confirmed by in vitro binding assays.
In the future, it will be important to better understand the mechanism of the nonlinearity. This will be especially important for utilizing the PPK model for further dose selection in phase 2 and 3 clinical studies. An in-depth understanding of protein binding in the preclinical models of invasive fungal infections will also be important to ensure bridging studies are appropriately designed and interpreted.
In this study, no significant relationship was found between age, weight, and BMI and clearance or volume. However, this was a phase 1 study, and variability in these covariates may have been too small to assess any impact on the PK. Further studies will be required to reassess these conclusions.
In conclusion, in this phase 1 study in healthy volunteers, VL-2397 demonstrated nonlinear saturable binding kinetics. Protein binding is likely the primary source of the nonlinearity. A saturable binding model best described the data. BSA was the only covariate with a significant relationship to clearance. The PPK model can now be used to optimize dosing by bridging the kinetics to efficacious pharmacodynamic targets.
MATERIALS AND METHODS
Study design.
The study design is described in detail elsewhere (unpublished data). An intravenous formulation of VL-2397 was used. The regimens are summarized in Table 3. Healthy adults in single-ascending-dose (SAD) cohorts 1 to 7 received a single dose of VL-2397 ranging from 3 mg to 1,200 mg. Subjects in MAD cohorts 8 to 10 received dosages of 300, 600, and 1,200 mg once daily for 7 days, while cohort 11 received 300 mg every 8 h for 7 days followed by 600 mg every 24 h for the next 21 days. Infusion times varied with each regimen and ranged from 6 to 240 min.
TABLE 3.
Description of dosage regimens in SAD and MAD cohorts with VL-2397
| Cohort | VL-2397 dose (mg) | Volume (mg/ml) | Infusion duration (min) | No. of dosing days |
|---|---|---|---|---|
| 1 | 3 | 0.12 | 6 | 1 |
| 2 | 10 | 0.12 | 20 | 1 |
| 3 | 30 | 0.12 | 60 | 1 |
| 4 | 100 | 1.2 | 20 | 1 |
| 5 | 300 | 1.2 | 60 | 1 |
| 6 | 600 | 1.2 | 120 | 1 |
| 7 | 1,200 | 1.2 | 240 | 1 |
| 8 | 300 | 1.2 | 60 | 7 |
| 9 | 600 | 1.2 | 120 | 7 |
| 10 | 1,200 | 1.2 | 240 | 7 |
| 11 | Day 1 to 7, 300 every 8 h; day 8 to 28, 600 every 24 h | 1.2 | 60 and 120, respectively | 28 |
Pharmacokinetic sampling.
Plasma samples from the subjects in single-dose cohorts 1 to 7 occurred predose (within 60 min prior to the start of the infusion), midway through the infusion, at the end of the infusion, and 15 and 30 min and 1, 2, 3, 4, 6, 8, 12, 24, and 36 to 48 h relative to the start of the infusion. Additional follow-up samples were drawn on days 5 and 11.
Plasma samples from the subjects in MAD cohorts 8 to 10 occurred predose (within 60 min prior to the start of the infusion), midway through the infusion, at the end of the infusion, and 15 and 30 min and 1, 2, 3, 4, 6, 8, 12, and 24 h (prior to day 2 dosing) relative to the start of the infusion on day 1. During the 7-day dosing period, plasma samples were collected predose on days 3, 4, 5, and 6. On day 7, samples were collected predose, midway through the infusion, at the end of the infusion, and 15 and 30 min and 1, 2, 3, 4, 6, 8, 12, 24, 36, and 48 h relative to the end of the infusion. Follow-up plasma samples were also collected on days 11 and 17.
Plasma sampling for MAD cohort 11 occurred on day 1 predose, midway into the infusion, at the end of the infusion, and 3, 7, 8, 11, 15, 16, and 19 h relative to the end of the first infusion. The 7- and 8-h time points were immediately before and after the administration of the second dose on day 1. The 15- and 16-h time points were immediately before and after the administration of the third dose on day 1. Additional samples were drawn prior to the first infusion on days 2 through 6. A 24-h PK profile (predose, at the end of the infusion, and 3, 7, 8, 11, 15, 16, and 19 h relative to the end of the first infusion on day 7) was also collected. After day 7, single samples were drawn prior to the infusion on days 8 to 10, 15, and 22. A 48-h profile (predose, midway into the infusion, at the end of the infusion, and at 15 and 30 min and 1, 2, 3, 4, 6, 8, 12, 24, 36, and 48 h relative to the end of the day 28 infusion) was also collected. Additional plasma samples were drawn on days 32 and 38.
Bioanalytical analysis.
VL-2397 plasma concentrations were determined using high-performance liquid chromatography-tandem mass spectrometry (HPLC-MS/MS). The analysis was performed by MicroConstants (San Diego, CA, USA). VL-2397 was detected in human plasma samples with VL-2397 I.S. (internal standard) and sodium heparin (anticoagulant) precipitated using acetonitrile. Samples were vortexed and centrifuged. The supernatant was transferred to a clean tube and evaporated under nitrogen. The residue was reconstituted, and an aliquot was analyzed by reverse-phase HPLC using a Restek Allure biphenyl column. The mobile phase was nebulized using heated nitrogen in a Z-spray source/interface set to electrospray positive ionization mode. The ionized compounds were detected using MS/MS. The dynamic range of the assay was 0.002 to 1 mg/liter. The lower limit of quantification (LLOQ) was 0.002 mg/liter. The interday precision was below the acceptance criteria (≤15%) and ranged from 4.93 to 7.24%. The interday accuracy was below the acceptance criteria (≤+15%), ranging from −1.83 to 0.50%. The average intraday precision was below ≤15%; however, the range in percent covariation for the LLOQ ranged from 2.6 to 36.5%. The intraday accuracy passed (≤+20%) at a range of −12.0 to 14.0%.
PPK modeling.
The plasma concentrations for each cohort were plotted versus time to evaluate the concentration-time profiles for each regimen. To assess for the presence of nonlinearity, the plasma concentrations for each patient were normalized by the daily dose.
The PPK model was developed using nonparametric estimation using Pmetrics (v1.5.1; University of Southern California, Los Angeles, CA, USA) (10). Inspection of the plasma concentration-time curves suggested multiple phases of distribution and elimination. Therefore, 2-, 3-, and 4-compartment models were evaluated. These multicompartment linear PK models could not account for the observed nonlinear PK.
A saturable binding compartment was used to account for the observed nonlinearity. This compartment accounted for phenomena that may be responsible for the observed nonlinear PK, such as the binding of drug to proteins, drug transporters, or the endothelium. In standard PK models, drug in the central compartment is fully mixed and is a combination of bound and free drug. In the model fitted to the VL-2397 data, total drug was separated into two distinct compartments. The central compartment represents free unbound drug, while a binding compartment represents bound drug. Measured drug concentrations are the sum of the bound and free compartments divided by the volume of the central compartment, i.e., (X1 + X3)/V.
The PK was further complicated by the presence of a prolonged terminal elimination phase, suggesting an elimination process that was not accounted for by clearance from the central compartment. Therefore, a degradation component was added to the binding compartment that represents irreversible loss of drug from that compartment. The mathematical formulae of the saturable binding model are the following:
| (1) |
| (2) |
| (3) |
| (4) |
where Kcp, Kpc, Kcf, and Kfc represent first-order intercompartmental rate constants (c, central; p, peripheral 2; f, peripheral 3 compartments) with units of per hour. Kon and Koff are the constants for the rates of association and dissociation, respectively, with units of per hour. Kon, Koff, and Rtot (maximum binding) values are extreme numbers relative to the other rate constants; therefore, to minimize the stiffness in the model, each constant and Rtot were divided by 106 and multiplied by 104, respectively, to assist program estimation (11). Rtot represents the maximum binding, and units are moles. Kdeg is a constant in the binding compartment (3), which regulates the slow turnover of the binding site and irreversible loss of drug from that compartment.
The PK data were weighted by the inverse of the estimated assay variance. Model acceptance was evaluated by visual inspection of the observed versus predicted concentration values before and after the Bayesian step, the coefficient of determination (r2) from the linear regression of the observed versus predicted values, and estimates for bias (mean weighted error) and imprecision (adjusted mean weighted squared error).
The day 1 (24-h) area under the concentration-time curve (AUC0–24) and day 7 (24-h) AUC144–168 for each subject was calculated using the Bayesian posterior parameter estimates from the final model using the trapezoidal rule embedded within Pmetrics.
Covariate assessment and model building.
Parameter estimates, clearance and volume, were evaluated against age, sex, weight, BMI, BSA, and race to determine if one or more should be considered for inclusion in the structural model. Each continuous covariate (age, weight, BMI, and BSA) was evaluated by plotting the variable to the individual parameter. If the confidence interval around the slope excluded zero, the covariate was considered significant.
ACKNOWLEDGMENTS
The study was conducted by Vical, Inc., San Diego, CA. L.L.K., A.V.D., and P.L.B. are employees of Astellas Pharma Global Development, Inc. S.M.S. and L.R.S. are employees of Vical, Inc. W.H. holds or has recently held research grants with F2G, AiCuris, Astellas Pharma, Spero Therapeutics, Matinas Biosciences, Antabio, Amplyx, Allecra, Bugworks, NAEJA-RGM, AMR Centre, and Pfizer. He holds awards from the Medical Research Council, National Institute of Health Research, FDA, and the European Commission. W.W.H. has received personal fees in his capacity as a consultant for F2G, Amplyx, Ausperix, Spero Therapeutics, and BLC/TAZ. W.W.H. is an Ordinary Council Member for the British Society of Antimicrobial Chemotherapy.
REFERENCES
- 1.Cadena J, Thompson G, Patterson T. 2016. Invasive aspergillosis: current strategies for diagnosis and management. Infect Dis Clin North Am 30:125–142. doi: 10.1016/j.idc.2015.10.015. [DOI] [PubMed] [Google Scholar]
- 2.Nett J, Andes D. 2016. Antifungal agents: spectrum of activity, pharmacology, and clinical indications. Infect Dis Clin North Am 30:51–83. doi: 10.1016/j.idc.2015.10.012. [DOI] [PubMed] [Google Scholar]
- 3.Peyton L, Gallagher S, Hashemzadeh M. 2015. Triazole antifungals: a review. Drugs Today 51:705–718. doi: 10.1358/dot.2015.51.12.2421058. [DOI] [PubMed] [Google Scholar]
- 4.Nakamura I, Kanasaki R, Yoshikawa K, Furukawa S, Fujie A, Hamamoto H, Sekimizu K. 2017. Discovery of a new antifungal agent ASP2397 using a silkworm model of Aspergillus fumigatus infection. J Antibiot (Tokyo) 70:41–44. doi: 10.1038/ja.2016.106. [DOI] [PubMed] [Google Scholar]
- 5.Nakamura I, Yoshimura S, Masaki T, Takase S, Ohsumi K, Hashimoto M, Furukawa S, Fujie A. 2017. ASP2397: a novel antifungal agent produced by Acremonium persicinum MF-347833. J Antibiot (Tokyo) 70:45–51. doi: 10.1038/ja.2016.107. [DOI] [PubMed] [Google Scholar]
- 6.Nakamura I, Ohsumi K, Yoshikawa K, Kanasaki R, Masaki T, Takase S, Hashimoto M, Fujie A, Nakai T, Matsumoto S, Takeda S, Akamatsu S, Uchida S, Maki K. 2015. ASP2397: a novel natural product with potent fungicidal activity against Aspergillus spp. (1) A new mode of action and in vitro activity. Abstr 54th Intersci Conf Antimicrob Chemother, abstr F-1590.
- 7.Hsiang T, Baillie D. 2005. Comparison of the yeast proteome to other fungal genomes to find core fungal genes. J Mol Evol 60:475–483. doi: 10.1007/s00239-004-0218-1. [DOI] [PubMed] [Google Scholar]
- 8.Nakamura I, Nakai T, Matsumoto S, Takeda S, Akamatsu S, Uchida S, Koide Y, Mitori H, Noto T, Maki K. 2015. ASP2397: a novel natural product with potent fungicidal activity against Aspergillus spp. (2)–in vivo activity against A. fumigatus. Abstr 54th Intersci Conf Antimicrob Chemother, abstr F-1591.
- 9.Gibiansky L, Gibiansky E. 2009. Target-mediated drug disposition model: approximations, identifiability of model parameters and applications to the population pharmacokinetic–pharmacodynamic modeling of biologics. Expert Opin Drug Metab Toxicol 5:803–812. doi: 10.1517/17425250902992901. [DOI] [PubMed] [Google Scholar]
- 10.Neely MN, van Guilder MG, Yamada WM, Schumitzky A, Jelliffe RW. 2012. Accurate detection of outliers and subpopulations with Pmetrics, a nonparametric and parametric pharmacometric modeling and simulation package for R. Ther Drug Monit 34:467–476. doi: 10.1097/FTD.0b013e31825c4ba6. [DOI] [PMC free article] [PubMed] [Google Scholar]
- 11.Cox S, Matthews P. 2002. Exponential time differencing for stiff systems. J Comput Physics 176:430–455. doi: 10.1006/jcph.2002.6995. [DOI] [Google Scholar]


