

Abstract
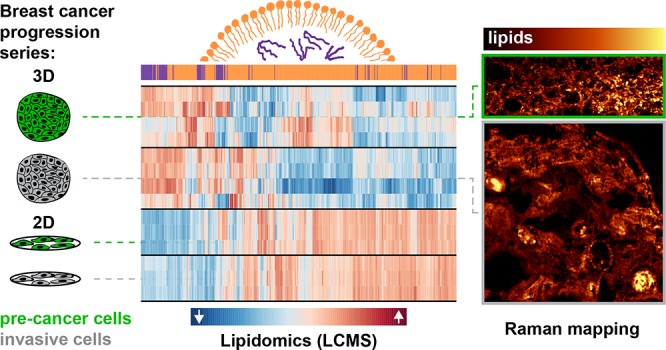
Aberrant lipid accumulation and marked changes in cellular lipid profiles are related to breast cancer metabolism and disease progression. In vitro, these phenomena are primarily studied using cells cultured in monolayers (2D). Here, we employ multicellular spheroids, generated using the MCF10A cell line series of increasing malignancy potential, to better recapitulate the 3D microenvironmental conditions that cells experience in vivo. Breast cancer cell lipid compositions were assessed in 2D and 3D culture models as a function of malignancy using liquid chromatography coupled with mass spectrometry. Further, the spatial distribution of lipids was examined using Raman chemical imaging and lipid staining. We show that with changes in the cellular microenvironment when moving from 2D to 3D cell cultures, total lipid amounts decrease significantly, while the ratio of acylglycerols to membrane lipids increases. This ratio increase could be associated with the formation of large lipid droplets (>10 μm) that are spatially evident throughout the spheroids but absent in 2D cultures. Additionally, we found a significant difference in lipid profiles between the more and less malignant spheroids, including changes that support de novo sphingolipid production and a reduction in ether-linked lipid fractions in the invasive spheroids. These differences in lipid profiles as a function of cell malignancy and microenvironment highlight the importance of coupled spatial and lipidomic studies to better understand the connections between lipid metabolism and cancer.
Short abstract
The profiles and spatial distribution of lipids in breast cancer cells change as a function of culture dimensionality and malignancy potential, yielding insight into cancer-related lipid metabolism.
Introduction
Cancer cell metabolism differs from normal cell metabolism in ways that support the biosynthetic, energy, and redox needs of tumors and enable cell proliferation and survival under stressful conditions such as nutrient limitation.1 In such conditions, lipids can serve as an alternative energy source through lipogenesis2,3 or through fatty acid scavenging.4 Altered lipid metabolism is a hallmark of human cancer and may promote proliferation by providing the energy and the membrane building blocks for rapid growth.5−7 Many cancer cells store excess lipids in intracellular lipid droplets, organelles involved in lipid storage, transport, and signaling that differ in composition, size, and distribution depending on the cells or tissue in which they are found.8,9 Recent advances in imaging and analytical techniques such as Raman microscopy and mass-spectrometry-based lipidomics10−12 provide opportunities for obtaining high resolution spatial maps of lipid distribution within tissues coupled with detailed lipid composition profiles.13,14 Here, we apply these techniques to assess lipid accumulation and spatial distribution and compare the global lipid profiles in human breast cancer cell lines as a function of cell culture dimensionality (2D vs 3D) and malignancy potential.
Currently, in vitro models that employ lipid mapping15 and profiling16 to study the relationships between breast cancer progression and lipid production use 2D cell cultures on substrates such as polystyrene. In contrast, in a solid tumor, regions of cellular viability, in which cells proliferate and interact in all directions, often transition to diffusion-limited inner regions of hypoxia and cell death. With varying nutrient availability, abnormal metabolic demands, and a continuing need for energy to drive cancer cell proliferation, three-dimensional tumor growth is dependent in part on lipid metabolism.17,18 The complex 3D microenvironmental conditions to which cells are exposed in vivo such as cell–cell and cell–extracellular matrix interactions can be better mimicked by 3D cell cultures compared to 2D cultures.19,20 For example, 3D multicellular spheroids have been shown to recapitulate some in vivo cancer behaviors, including cell death21 and tumor progression22 pathways. In other work, we have used 3D multicellular spheroids of human breast cancer cell lines of varying malignancy to study the formation of breast microcalcifications.23 Much like ductal breast cancer, the spheroids develop necrotic cores with spatially distinct viable cell and hypoxic areas. In addition, gene expression changes induced by conditions affecting metabolism are differentially regulated in 2D vs 3D cultures.24 Thus, cells cultured in 3D spheroids provide a biologically more relevant model for exploring lipid distribution in a three-dimensional microenvironment with variable access to nutrients and oxygen as well as exposure to metabolites.
The power of emerging lipid characterization techniques such as Raman microscopy and mass spectrometry-based lipidomics to provide both spatial mapping and molecular identification of lipids has been demonstrated in systems ranging from single-celled algae10,14 to myelin distribution in brain tissue.13 In cancer research, these techniques have shown differences in lipid profiles among human breast cancer subtypes as well as between breast cancer and normal cells15,16,25−30 though, for the latter, these in vitro experiments were carried out in 2D cultures. It remains unclear, however, the extent to which changes in tissue dimensionality that may be mimicked with 3D culture models can affect lipid profiles and spatial distribution. Although spatial differences in lipid accumulation may be key to tumorigenesis,26,31 they are rarely assessed with micrometer-scale resolution due to a shortage of methodologies allowing for this analysis. Furthermore, systems harboring multiple cellular environments such as necrotic and viable cell regions necessitate the use of techniques that venture beyond the bulk. Raman microscopy is one such technique that enables spatially mapping a multitude of chemical signatures (at submicrometer resolution32) in biological materials without staining or significant sample preprocessing.33,34 At high enough concentrations, different types of lipids can be readily detected and distinguished, as well as proteins (generally and, in some cases, specifically), cells, extracellular matrix components, sugars, and other chemical species. The information gained by coupling Raman microscopy with lipidomics has the potential to offer a view of biological lipid profiles encompassing both the physical distribution of lipids and the diversity of lipid species.
The aim of this study is to understand the effect of cell culture dimensionality on lipid metabolism and spatial distribution by using breast cancer cell lines of a tumor progression series of nonmalignant, precancer, and invasive cells. We employed ultrahigh performance liquid chromatography coupled with state-of-the-art mass spectrometry (LCMS) to analyze lipid production in both traditional 2D cell cultures and 3D multicellular spheroids. Histological staining and Raman mapping are used in conjunction with LCMS to detail changes in the spatial distribution of local lipid accumulation as a function of malignancy and dimensionality. These experiments are designed to provide insights into the relationships among lipid profiles, both spatial and compositional, and cell microenvironment and malignancy potential.
Results
We represented tumor progression in our model by using the nonmalignant human breast epithelial cell line MCF10A35 and two additional cell lines that were derived from the parent MCF10A to exhibit higher malignancy potential: the “precancer” MCF10DCIS.com cell line36,37 and the “invasive” MCF10CA1a cell line.38 Each of the three cell lines was cultured using two different methods: as 2D cell monolayers and as multicellular spheroids (3D).
Spatial Distribution of Lipids Depends on the Dimensionality (2D vs 3D) and Malignancy Potential of the Cells
Using hydrophobic Oil-Red-O staining of the cell monolayers and of cryosections from the spheroids, the nonpolar lipid distribution was observed for the different malignancy potentials and culture dimensionalities. In both 2D and 3D cultures, the nonmalignant breast epithelial cells had low lipid content (Figure 1a, d, g, j). In 2D, the majority of the lipid droplets in the precancer and invasive cells had diameters smaller than 2 μm (Figure 1b, c, e, f). When moving to 3D, the overall amount of lipid staining decreased compared to 2D, and the nonmalignant spheroids presented small patches of lipids that were not observed in 2D culture (Figure 1g). In the malignant 3D spheroids, increased staining was observed in the spheroid cores, which contain necrotic and apoptotic cells. In this region, distinguishable lipid bodies had diameters (<1 μm) smaller than those found in 2D (see magnified field of view in Supporting Figure S1). Additionally in 3D, large lipid droplets (with diameters larger than 10 μm), with size and number varying from spheroid to spheroid, were present throughout the sections and were more abundant in the invasive spheroids (Figure 1h, i, k, l).
Figure 1.

Relation between lipid amounts and the malignancy potential of breast cancer cells in 2D and 3D. Oil-Red-O lipid staining of cell lines from the MCF10A-based breast cancer progression series cultured in 2D (a–f) and as multicellular spheroids (g–l). (a, d, g, j) Nonmalignant MCF10A cells; (b, e, h, k) precancer MCF10DCIS.com cells; (c, f, i, l) invasive MCF10CA1a cells. Lipids are stained red, and cell nuclei are stained purple. Arrows: lipid droplet aggregates close to cell nuclei. For a high resolution version of Figure 1 see Supporting Data.
Lipid Profiling of Precancer and Invasive Cells in 2D and 3D Culture
Oil-Red-O staining is a nonspecific stain for any neutral lipid and, as such, does not provide any information about how the lipid species are changing as a function of culture dimensionality and malignancy potential. We hypothesize that the complex interactions present in 3D cultures, as well as the malignancy potential, affect the lipid profiles. To test this hypothesis, we characterized the lipid profiles of the precancer and invasive cells cultured both in 2D and 3D using ultrahigh performance liquid chromatography coupled with electrospray ionization mass spectrometry in positive mode (referred to as LCMS for short). Because the nonmalignant cells presented very small amounts of Oil-Red-O staining, which were hardly detectable compared to the more malignant cells, their lipid profiles were not studied by LCMS.
Lipid Amounts and Profiles Differ Significantly Depending on Dimensionality
From LCMS, a total of 660 unique lipid species were detected (Figure 2 and Supporting Figure S2). The lipid amounts and profiles of both the precancer and invasive cells changed when moving from 2D cultures to 3D multicellular spheroids (Supporting Table S1). Overall, cells cultured in 3D had substantially less total lipid than those in 2D (3–6 × 10⁷ normal peak area/μg protein in 3D and 2–4 × 10⁹ normal peak area/μg protein in 2D) (Supporting Figure S3, Table S1). Hierarchical cluster analysis performed on lipids identified in 2D and 3D cultures of precancer and invasive cells by LCMS shows clear differences between the two groups (Figure 2a, Supporting Figure S2, and Supporting Table S1). Across conditions, membrane lipids (i.e., glycerophospholipids) make up the highest fraction of lipid type, followed by either sphingomyelins in 2D or neutral glycerolipids (i.e., acylglycerols) in 3D (Figures 2b and S2). Broadly, the lipid profiles of 3D cultures show larger variation than those of the 2D cultures both across biological replicates and between malignancies, possibly due to the more complex microenvironmental conditions and signaling cues that the cells are exposed to in 3D culture and consequential changes in tumor cell heterogeneity.
Figure 2.

Lipid profiles in 2D and 3D culture of precancer and invasive cells detected using LCMS. (a) Heatmap showing the clustering of lipid species in 2D and 3D cultures of MCF10DCIS.com (precancer) and MCF10CA1a cells (invasive). Color bar indicates the scaled distance from the row mean of the normalized transformed data. For assessment of the variation within each group, the biological replicates for each condition are shown. For the 2D samples, each group consists of three biological replicates, and for the 3D samples, each group consists of four biological replicates. Lipid classes are color coded as indicated. Coenzyme Q10 is shown in white. To the right, representative example lipid structures of the color-coded lipid classes in part a are shown. (b) Lipid class distribution in precancer and invasive 2D and 3D cultures as detected with LCMS, calculated from areas in LCMS normalized per microgram of protein in the sample and presented as a fraction of total lipids in the sample. Error bars are the standard error of the mean. 34 Cs = summed acyl chain and sphingoid base chain lengths of 34 carbons. See Supporting Figure S2 for a version of this figure with individual lipid identifiers associated with the heat map.
Neutral Glycerolipids Are Significantly Increased in 3D Compared to 2D
On further inspection of the cluster analysis (Figure 2a), there are clear differences in lipid populations between 2D and 3D cultures: the relative amounts of certain lipid classes, saturations, and number of carbons differ (Supporting Table S1). In the 3D cultures as compared to 2D, neutral lipids make up significantly more of the total lipid composition (Figure 2b). Neutral lipids, including triradylglycerols (TGs, majority triacylglycerols with minor contributions from ether linked species), are proportionally higher in 3D than in 2D and higher in the invasive cells than in the precancer cells. In 2D, TGs account for <2% of the total detected lipid population, whereas in 3D they make up on average 13 ± 5% of lipids in precancer and 18 ± 4% in invasive. It is likely that it is these neutral lipids that are evident in the Oil-Red-O staining. Similarly, <2% of total lipids are diacylglycerols (DAGs) and monoacylglycerols (MAGs) in 2D, yet in 3D, they make up 9 ± 4 and 14 ± 3% of lipids detected in precancer and invasive cells, respectively.
Alkyl and Alkenyl Ether Lipid Fractions Are Significantly Increased in 3D
Out of total lipids, cells cultured in 2D contain a higher percentage of both phosphatidylethanolamine (PE) and phosphatidylcholine (PC) relative to the same cells cultured in 3D (Figure 2b). The fraction of ether-linked, as opposed to ester-linked, PCs and PEs, however, differs depending on culture dimensionality and cell malignancy. The largest difference arises in PEs that contain an alk-1-enyl ether linkage (P-PEs, i.e., plasmalogens and plasmenyl). The percentage of PEs that are P-PE is substantially higher in 3D compared to 2D and differs strongly between malignancies (∼30% in 2D independent of malignancy, 52 ± 1.5 and 68 ± 0.95% in 3D invasive and precancer, see Supporting Table S1). The percentage of alkyl ether PEs (O-PEs, i.e., plasmanyl) in 3D is also higher when compared to that in 2D. Alkyl ether linked PCs (O-PCs) make up 5–20% of PCs, and P-PCs make up 5–10% of PCs, depending on the group. Percentages of both types of PC ethers were highest in 2D and 3D precancer and lowest in 3D invasive.
Sphingomyelin and Lysophosphatidylcholine Show Differences between 2D and 3D Based on Number of Carbons
Sphingomyelin (SM) fractions are similar for the 2D precancer and invasive cells and for the 3D invasive spheroids (∼6–8%) with a decrease in the precancer spheroids (∼3%). The fraction of sphingomyelins consisting of <34 carbons is increased in 3D. There is an increase in lysophosphatidylcholine (LPC) amount in 3D, and the makeup of LPCs differs significantly depending on chain length (Supporting Table S1).
Lipid Profiles Differ between Precancer and Invasive in 3D Spheroids
In breast cancer, both lipid quantity and the expression of fatty acid synthase increase with malignancy,39−43 motivating us to further compare lipid profiles between precancer and invasive cell lines. The lipid profile difference between cells of varied malignancy potentials is more profound within 3D samples compared to 2D samples (Figure 2). Given that spheroids more closely model tumor microenvironmental conditions in vivo,19−22 we performed further analysis of the LCMS data for the 3D spheroids as a function of tumor cell malignancy (Figure 3).
Figure 3.

Heat map showing clustering of the 25 lipid species with the most significant changes, selected by t-test, across 3D cultures of MCF10DCIS.com (precancer) and MCF10CA1a (invasive) cells as detected with LCMS. Each group consists of four biological replicates. So(d18:0) = sphinganine. Color bar indicates the scaled distance from the row mean of the normalized transformed data.
The precancer spheroids contain more lipids than the invasive spheroids (Supporting Figure S3, Figure 2b) and differ considerably in their lipid profiles; there is an increase in the percentage of acylglycerols and SMs in the invasive spheroids and an increase in PCs in the precancer spheroids (Figure 2b). A heat map showing the clustered top 25 lipids with the most significant changes across spheroid malignancies is shown in Figure 3. Almost all are membrane lipids. The species increased in the invasive spheroids include polyunsaturated PCs (diacyl), SMs with ≤34 carbons, one DAG species, and sphinganine. In the precancer spheroids, O-PCs and P-PCs are the species most significantly increased. Additional increased species include a P-PE, a PC (monounsaturated), and two very long chain LPCs (>26 carbons). In addition, between the 3D spheroids, more LPCs were detected in invasive, though the fraction of LPCs with chain lengths >26 carbons was larger in precancer spheroids.
Mapping Spatial Distribution of Lipids and Other ECM Components in 3D Spheroids Using Raman Microscopy
While the LCMS cluster analysis of precancer versus invasive spheroids shows that the lipid amount and profiles vary significantly (Figure 3), the Oil-Red-O staining suggests that there is also a change in neutral lipid distribution between these two cell lines (Figure 1). Cross-polarized light microscopy images of unwashed sections of spheroids show that some lipid-containing areas in the spheroids have strong birefringence, suggesting an anisotropic molecular ordering (Figure 4a–d). Raman microscopy was used to map the spatial distribution of chemical species, including lipids, proteins, and glycogen, within the precancer and invasive spheroids (Figure 4e–g). The Raman maps can provide insight into how the biochemical differences revealed by the lipidomics analysis are spatially distributed within the spheroids.
Figure 4.

Characterization of the lipid droplets formed in 3D multicellular spheroids of malignant cell lines. (a, b, e) Precancer spheroid cross sections. (c, d, g) Invasive spheroid cross sections. Asterisks show the necrotic core. (a, c) Oil-Red-O lipid staining showing lipid accumulation in the necrotic core area of the spheroids as well as lipid droplets in the invasive spheroid (arrows). (b, d) Cross-polarized light images of the spheroid cross sections showing birefringence (arrows in part d point at the same areas as in part c). (e, g) Overlaid spatial distribution maps of key basis spectra resultant from NMF multivariate analysis of Raman mapping. (f) Corresponding NMF basis spectra (precancer: black, invasive: gray). The precancer overlay map (e) shows an increase in lipid content toward the spheroid center, while the invasive overlay map confirms the birefringent regions are lipid-rich droplets (cyan). Arrows indicate the same bodies as in parts c and d.
An unsupervised multivariate approach, non-negative matrix factorization (NMF), was employed to reduce each hyperspectral Raman map into a basis set consisting of chemically meaningful, separable spectral signatures (i.e., basis spectra). Each basis spectrum has a corresponding heat map, in which the value of each pixel is the calculated contribution of the given basis spectrum, effectively showing the relative spatial distributions of each basis. This unsupervised method was validated using a supervised peak area-based approach to ensure that basis maps and basis spectra are comparable to results obtained from standard univariate analysis (Supporting Figures S4–S8, Supporting Table S2). Figure 4e and g show overlaid false-colored maps of the most spatially and spectrally clear biological bases (substrate signatures and spatially or spectrally noisy signatures are not shown). For the precancer and invasive spheroids, similar emergent biological bases (Figure 4f) are mapped to reveal spatial distributions of chemical species: lipid-rich (cyan, a lipid-dominated spectral signature characterized by a strong lipid peak at 2850 cm–1, among others), protein–lipid (blue, a combination of protein and lipid signatures in which protein was increased compared to the lipid-rich signature), cellular (yellow, a combination of protein and DNA signatures), and glycogen (red).
Raman Mapping Localizes Multiple Signatures: Lipids, Proteins, Cells, Glycogen, and Cytochrome c
The Raman overlay images provide a sensitive, chemically rich landscape of the precancer (Figure 4e) and invasive (Figure 4g) spheroid sections. Cellular signatures (yellow) are clear amidst a backdrop of the ubiquitous protein–lipid signature (blue). The morphologies and positions of cell signatures in the Raman maps correspond almost exactly to the stained cell nuclei processed afterward on the same samples (Figure 4a and c), although fewer cells are observed in the Raman maps compared to staining, most likely due to focal limitations of Raman microscopy. In the invasive spheroid, a strong signature for the polysaccharide glycogen is evident throughout the section. Additionally, a cytochrome c basis is present and appears associated with many of the lipid bodies (Supporting Figure S4) as well as cells, which could suggest local apoptosis.44 Peaks associated with cytochrome c are present in precancer spectra as well but they did not emerge as independent bases by NMF for the sample shown in Figure 4 (Supporting Figure S7). Raman maps taken of a separate precancer spheroid produced clear glycogen and cytochrome c basis spectra.
Raman Mapping Shows That Lipid Droplets Are Consistent with Unsaturated Acylglycerols
The spatial distribution of the lipid-rich signature differs markedly between the malignancies. In precancer (Figure 4e), there is a gradual increase from periphery to core that is not easily discernible in the Oil-Red-O image from the same section (Figure 4a) though is consistent with results shown in Figure 1. In the invasive spheroid section (Figure 4g), the lipid-rich basis appears amidst cells but is additionally concentrated in large bodies or droplets, consistent with the Oil-Red-O staining and polarized light images (Figure 4c, d). The birefringent areas, which are indicative of molecular order, are colocalized with locally distinct lipid–protein Raman signatures. The lipid-rich basis spectrum represents a mixture of lipids (with protein contributions as well), and the spectral features from both malignancy potentials are consistent with unsaturated acylglycerols in the liquid state (Supporting Table S2).45 There is a notable lack of substantial peaks in the 700–760 cm–1 range, ruling out the otherwise spectrally similar lipids phosphatidylcholine and phosphatidylethanolamine as well as cholesterol or cholesterol esters (in agreement with the LCMS findings) as large contributors to these spectra (Supporting Table S2).
Raman Mapping of a Clinical Sample Shows Spatially Distinct Distribution of Lipids within DCIS
To validate the potential relevance of our in vitro findings with a clinical sample, confocal Raman mapping was performed on a human duct presenting comedo-type ductal carcinoma in situ (DCIS, a precancer) (Figure 5). A hematoxylin and eosin stained cryo-section of the specimen (H&E, Figure 5a) shows the general morphology of the analyzed tissue. The duct is filled with both living cancer cells and a large necrotic region. From Raman, the localization and distribution of multiple chemical species is evident (Figure 5b). Using a partially supervised component analysis approach, collagen, cellular, protein, and lipid signatures are clearly distinguished (Figure 5, and Supporting Figure S9). The ECM-rich tissue surrounding the duct contains abundant collagen consistent with the presence of stromal fibroblasts, while a DNA-rich protein signature (cellular, likely nuclei) is primarily located to the right side of the duct, as in the H&E image. Cellular features become cross-sectionally smaller and disappear completely within the protein-rich necrotic region. Two major noncollagenous protein signatures are present: one that appears more associated with cellular signatures and includes cytochrome c and a second that appears more associated with necrosis. The lipid component lacks any distinguishing peaks associated with membrane lipids and is consistent with a saturated neutral lipid signature that includes cholesterol ester (Supporting Table S2). This neutral lipid signature is more prevalent in the necrotic region of the duct compared to the viable cell areas and is often concentrated within domains with diameters larger than 2 μm (Figure 5b), consistent with features found in precancer and invasive spheroids (Figures 1 and 4).
Figure 5.

Spatial characterization of DCIS (precancer) from human tissue. (a) H&E stained cryo-section showing the duct cross section containing cells (purple), necrosis (dark pink and purple), and surrounding stromal tissue (pink). (b) Confocal Raman mapping and component analysis of a serial section from the same duct in part a, showing the spatial distribution of the tissue components. Lipids, cyan; collagen, green; protein/cytochrome c, magenta; noncollagenous proteins, blue; cells, yellow. A distinct lipid signature consistent with neutral lipids, including cholesterol ester(s), is observed in the necrotic regions and occurs in spatially discrete domains (arrow). (c) The corresponding Raman component spectra for the Raman map in part b.
Discussion
We used a series of MCF10A-based cell lines to study the individual and combined effects of breast cancer malignancy and culture dimensionality on lipid spatial distribution (Raman microscopy) and global lipid profiles (LCMS). The cells were cultured in multicellular spheroids (3D) to mimic breast cancer microenvironmental conditions more closely than cells traditionally cultured on polystyrene substrates. The total amount of lipid decreased significantly when moving from 2D to 3D culture, though larger lipid droplets were observed in 3D regardless of malignancy. In 3D spheroid cultures, in addition to malignancy-dependent changes in lipid profiles, spatial distribution of lipids was both malignancy and microenvironment-dependent. Spheroids cultured using the invasive cell line showed relative increases in neutral lipids (DAGs and TGs), sphingolipids, and sphingoid bases (sphingomyelin, dihydroceramide, sphinganine, and sphingosine), while PCs and ether-linked lipid fractions decreased compared to precancer spheroid cultures. Taken together, these differences suggest that malignancy potential, together with culture dimensionality and thus microenvironmental conditions, can have a significant impact on lipid biogenesis in cancer with potential implications for lipid biophysics, signaling, and metabolism (Figure 6). Below, we discuss the differences in lipid profiles and spatial distribution and their potential biological implications going from the macroscale (cell culture dimensionality) to the microscale (the formation of large lipid droplets, microenvironment-dependent lipid distribution within the spheroids), and finally to the molecular scale (malignancy- and dimensionality-dependent changes in sphingolipids and ether-linked lipid levels).
Figure 6.

A scheme describing the effects of dimensionality (top left) and the cell malignancy potential (bottom left) on lipid species amounts in the MCF10A breast cancer in vitro model. Lipid-rich areas (red) are observed in the necrotic core with decreasing amounts toward the spheroid periphery alongside large lipid droplets at the periphery. The observed increase in the ratio of neutral to membrane lipid species in 3D versus 2D may be related to large lipid droplet formation through TG synthesis and/or lipid droplet coalescence (top right). The observed increase in sphingolipid species in invasive versus precancer spheroids could be due to enhancement of the de novo sphingolipid synthesis pathway (bottom right, adapted from Ogretmen46). Species of lipids increased out of total lipids in 3D invasive spheroids are underlined. CoA = coenzyme A, SPT = serine palmitoyltransferase, KDSR = 3-ketosphinganine reductase, CERS = (dihydro)ceramide synthases, DES = dihydroceramide desaturase, SMS = sphingomyelin synthase, CDase = ceramidases.
Cell Culture Dimensionality Affects Lipid Production and Distribution
When moving from 2D to 3D cultures, total lipids decreased, and lipid spatial distributions differed. Even though it is now relatively well-established that culture dimensionality affects the phenotype of cancer cells at multiple levels, including their transcriptome and proteome,47,48 it remains largely unclear what effect(s) 3D microenvironmental conditions have on the lipidome of cancer cells. Two-dimensional cultures, where cells effectively grow as a monolayer with equal access to nutrients from the media, including carbon sources required for lipid synthesis, contain substantially more lipids compared to 3D, as qualitatively seen by the increased density and intensity of staining in Oil-Red-O (Figure 1) and quantitatively demonstrated by the lipid profiling (Supporting Figure S3). Furthermore, the LCMS lipid profiles in 2D, though different between malignancies, are well-conserved across biological replicates.
In the 3D spheroids, the reduction in lipid amounts may be related to alterations in cell metabolism due to changes in cell–microenvironment interactions (e.g., cell–cell and cell–extracellular matrix interactions) and/or because the supply of carbon sources for biosynthetic pathways is subject to diffusion-limited transport, much like in tumors in vivo. Importantly, both metabolism and nutrient diffusion are interdependent because differences in oxygen and nutrient transport can directly influence the cellular microenvironment and vice versa. Collectively, these changes may affect the cells’ ability to synthesize lipids, which could potentially contribute to the observed reduction in total lipids in 3D. While the increased amount of total lipids found in 2D could be accounted for by the presence of a large number of small lipid droplets (Figure 1, often hundreds of lipid droplets per cell), differences in plasma membrane or organelle membranes could also exist. In addition, spheroid cultures may have lower proliferation rates than in 2D49 and hence may exhibit a decreased demand for energy and/or biosynthetic building blocks contained in stored lipid droplets.
Lipid Composition and Distribution in Multicellular Spheroids May Relate to Energy Storage in Nutrient Deprived Conditions
In the spheroids, multiple cellular niches coexist due to nutrient and oxygen diffusion limits23 (e.g., necrotic, apoptotic, and viable cell areas; high and low nutrient levels). As revealed by Oil-Red-O staining and Raman microscopy, lipid spatial distribution appears to depend on the specific microenvironmental conditions, with lipids mostly localized in the spheroid core and in large birefringent droplets, which are more common in the invasive spheroids (Figures 1 and 4). When the spatial distribution of lipids in the spheroids is compared to a clinical sample, we observe that in both the spheroids and the human tissue sample, neutral lipids are concentrated in spatially distinct domains with diameters >2 μm. In the spheroids, at least two lipid droplet and/or body populations exist: diffuse signatures where lipid bodies or droplets are very small and Raman mapping cannot resolve them (<1 μm), and large (10s of micrometers), birefringent concentrations of lipids that appear in close proximity to cell nuclei and do not necessarily occur within the spheroid core. While these concentrated regions could be accumulations of smaller droplets similar to what is seen for some cells in 2D, their appearance is consistent with larger droplets.
Lipid droplets are known to be composed primarily of neutral lipids such as TGs or cholesterol esters as well as proteins encapsulated by a glycerophospholipid monolayer.50−54 From the lipidomics in this study, the fraction of detected neutral lipids requiring storage in lipid droplets (TGs and DAGs) is significantly higher in 3D and also substantially more variable among 3D biological replicates. Lipid spectra obtained by Raman mapping of the large lipid domains in the 3D spheroid sections lack peaks associated with cholesterol esters. These lipid spectra are consistent with unsaturated TGs and DAGs, and in contrast to the DCIS clinical sample, which contains a signature of saturated cholesterol esters. In spheroids, the absence of cholesterol or cholesterol esters is consistent with the LCMS results. The increase in DAGs and TGs is most likely associated with the formation and coalescence of lipid droplets. The increase could also suggest that cells within spheroids are structurally able to accommodate large volume droplets, unlike 2D cultures that are essentially a cell monolayer. Further, the sporadic presence of larger droplets within the spheroid sections could explain both the pronounced relative increase in neutral lipids from 2D to 3D compared to membrane lipids, as well as the higher variability of TG and DAG amounts between replicates within the same group. The formation of the larger lipid droplets in 3D is also consistent with a decrease in membrane lipids compared to neutral lipids and increased de novo triglyceride synthesis, where the necessary enzymes are localized to the droplet monolayer52 (Figure 6, top right).
In other systems, it was shown that cancer cells can use lipids stored in neighboring adipocytes to fuel their own growth55,56 or use lipid droplets as a reservoir of lipid building blocks for new membrane formation.57 The increase in lipid accumulation and formation of larger lipid droplets in central regions of both the spheroids and the clinical DCIS sample may be related to the development of cellular stress or hypoxia in these areas. Indeed, Raman microscopy of central regions of spheroids also identified glycogen, which increases in cancer cells exposed to hypoxia.58−60 Furthermore, cytochrome c signatures are evident in both spheroids and the clinical sample, suggesting that cells may be undergoing apoptosis, possibly due to environmental stresses.61 Taken together, these observations could be related to cancer cells’ adaptive energy storage in conditions of limited exogenous nutrients and oxygen.62
Sphingolipid de Novo Synthesis Is Upregulated in Invasive Cells
De novo sphingolipid synthesis is related to cellular lipid homeostasis and to the regulation of cell processes associated with disease conditions.63 The sphingolipid profile of the invasive spheroids is markedly different from that of precancer spheroids and is consistent with activation of the de novo sphingolipid synthesis metabolic pathway (Figure 6). Species involved in the one-way de novo biosynthesis of sphingolipids, including sphinganine and dihydroceramides, are increased in invasive spheroids (Figure 6) as well as possible downstream products: sphingosine, ceramides, and sphingomyelins. Interestingly, conversion of ceramide to sphingomyelin entails removal of a PC headgroup to yield DAGs,46 which are also increased in invasive spheroids, though DAGs can be produced via numerous pathways.64 Further evidence of de novo synthesis comes from work that shows the invasive cell line used here, MCF10CA1a, has substantially increased expression levels of the gene C3orf57 compared to the parent cell line.65 C3orf57, currently known as serine palmitoyltransferase small subunit B (SPTSSB), is a protein involved in the first committed step of sphingolipid metabolism.66
The apparent sphingolipid de novo synthesis in invasive spheroids raises the question: is upregulation of sphingolipid biosynthesis connected to invasiveness and/or cell survival pathways? Elevated sphinganine has been reported in endometrial cancer tissue67 and was thought to be associated with de novo sphingolipid synthesis. Many sphingolipid species have been found to influence tumor progression through cell death and survival signaling depending on their ratios in membrane lipid rafts.68 Sphingoid bases such as sphingosine and its derivatives, which are increased in the invasive spheroids, can also impact the cell cycle and apoptosis.69 Finally, ceramides, which are increased in invasive spheroids, are thought to mediate cell death and tumor suppression. Ceramides are known to be elevated in response to cellular stress have been found to play important context-dependent roles in cancer cell death and survival pathways.46
Ether Lipid Fractions Depend on Both Malignancy and Dimensionality
Dysregulation of ether lipids has been implicated in a number of diseases, including cancer,70,71 and inhibition of ether lipid synthesis may have anticancer effects,72 but their exact roles remain elusive. When looking at our results, the differences in ether lipid content as a function of culture dimensionality and malignancy, particularly plasmalogens, are striking. At least two interesting trends are observed: (1) a drastic increase in P-PE fraction in 3D compared to 2D and (2) a less-drastic, but still substantial, difference in P-PE fraction in invasive versus precancer that only emerges in 3D. Physiologically, different tissues have varying but characteristic ether lipid fractions. In humans, the percentage of PEs that are P-PEs, for example, is as high as 84% in white matter brain tissue and as low as 8% in the liver.73 Here, in 2D, both invasive and precancer cell lines maintain a P-PE/PE fraction of ∼30%. However, in 3D, this fraction increases up to 52% for invasive (about the level of heart)73 and 68% for precancer (as high as human neutrophils) (Supporting Table S1). The dimensional disparity is as large as the difference between a liver and a kidney cell. Although they make up a significant portion of cell membranes and clearly impact lipid metabolism, roles of ether PCs and PEs are not fully understood.73,74 Whether the increase in ether PE fractions in 3D is related to cellular stress within the spheroids and/or metabolic or biophysical changes in 3D is unknown.
The differences among ether lipids in general between precancer and invasive spheroids are also considerable. Fourteen of the 25 most significantly different lipid species across malignancies are ether lipids (Figure 3), primarily O- and P-PCs. P-PEs are also substantially decreased in invasive spheroids, and almost all other ether lipid types are also relatively decreased. Our data suggest a malignancy-dependent shift in the ether lipid balance in general through either enhancement of biosynthetic pathways that produce ether lipids or reduction of consumptive pathways. The large change in P-PE fractions between malignancies, which only occurs when cells are cultured as spheroids, suggests a complexity of function that has yet to be explored.
Taken together, our results present many interesting new research directions regarding lipid metabolism and distribution in cancer. Future studies will be aimed at identifying differences in lipid metabolism that could be responsible for the changes in lipid composition and distribution detected in this work. Such studies could include analysis of expression levels and localization of key de novo lipid synthesis proteins, including TG synthesis enzymes, to inform lipid droplet formation mechanisms and enzymes involved in sphingolipid synthesis to determine how regulation of these lipids impact cancer cell stress and survival. Lipids, including sphingolipids, DAGs, and polyunsaturated PCs, take part in many important signaling pathways17 and affect membrane sensing by proteins.75,76 To examine whether differences in the amounts of these lipid species between the precancer and invasive spheroids are indeed related to cancer signaling, further studies are required. Finally, Raman mapping of a clinical sample shows that the spatial distribution of neutral lipids within precancer ducts varies depending on the local tissue components with an increase in necrotic regions, similar to the observations in the spheroid model. Much like in the spheroid model, neutral lipid domains are formed within the duct and appear accumulated in the necrotic region. To further establish the clinical relevance of the 3D spheroid model to human breast tumors, analogous studies, combining Raman microscopy and advanced lipidomic techniques, will be performed using patient samples.77 Through such studies, we will explore the functional impact of the observed differences in lipid profile on tumor progression.
To conclude, by combining the spatial resolution of Raman mapping with the chemical resolution of liquid chromatography mass spectrometry lipidomics, we show that lipid accumulation, profiles, and spatial distribution depend on breast cancer cell culture dimensionality and malignancy potential. Lipidomics revealed that there are significant changes in 3D spheroids versus 2D monolayer culturing dimensions. While the inherent metabolic differences between the cell lines themselves likely play a large part, the marked changes in lipid profiles between 2D and 3D could be attributed to several factors. These factors include the existence of multiple microenvironments in 3D with varying states of lipid accumulation and possibly lipid metabolism, the formation of large lipid droplets to house an increased supply of neutral lipids as an energy source, and alterations in the plasma membrane composition, all of which are interconnected. Lipid profiles between precancer and invasive cells cultured as 3D spheroids were also significantly different. Specifically, these differences suggest enhancement of the de novo sphingolipid metabolic pathway in the invasive spheroids. Additionally, lipid species that are less well understood, including ether PCs and PEs and very long chain LPCs, were decreased in the invasive spheroids compared to precancer spheroids. This work highlights the power of correlative analysis techniques to study tumor microenvironments and reveal qualitative and quantitative differences of breast-cancer-associated lipid profiles in different culture models. As our ability to resolve and identify unique lipid species improves, further combinations of lipidomics and Raman mapping could lead to new insights surrounding the complex network of functional imbalances that supports and enables cancer cell survival, growth, and metastasis.
Acknowledgments
We thank Drs. Clifford A. Hudis, Neil M. Iyengar, and Monica Morrow of the Memorial Sloan Kettering Cancer Center for providing the human sample and Dr. Daniel Sudilovsky of the Department of Pathology and Laboratory Medicine, Cayuga Medical Center at Ithaca for his pathological expertise. We thank Dr. Lynn M. Johnson from Cornell Statistical Consulting Unit for her help with statistical analysis, Prof. Elizabeth Johnson for lipid pathways discussion, Janille Maragh for assistance with Raman setup, and Dr. Minjee Kang and Dr. Neta Varsano for helpful discussions. We thank the Animal Health Diagnostic Center for help with staining, the Cornell College of Veterinary Medicine for the use of Scanscope, the Bonassar lab for the use of cross-polarized microscope, and the Schaffer-Nishimura lab for use of the cryotome. We thank WITec and Tavis Ezell for kindly allowing access to the WITec Suite FIVE software, Project FIVE Plus. Research reported in this publication was supported by the Center on the Physics of Cancer Metabolism through Award 1-U54-CA210184 and by the Human Science Frontiers Program (RGP0016/2017). The content is solely the responsibility of the authors and does not necessarily represent the official views of the National Institutes of Health. This work made use of the Cornell Center for Materials Research Shared Facilities, which are supported through the NSF MRSEC program (DMR-1719875). Additional imaging data were acquired through the Cornell University Biotechnology Resource Center with NIH 1-S10-OD012287 funding. N.V. acknowledges funding from The Israeli Council for Higher Education and Ben-Gurion University. A.E.C. acknowledges funding from the National Institutes of Health through Award F31-CA228448.
Glossary
Lipid Abbreviations: Neutral Lipids
- MAG
monoacylglycerol
- DAG
diacylglycerol
- TG
triradylglcerol (includes triacylglycerol, alkyldiacylglycerol, and alkenyldiacylglycerol)
Glossary
Sphingolipids
- So
sphingosine/sphinganine
- Cer
ceramide (also includes dihydroceramide, hexosylceramide, and dihexosylceramide)
- SM
sphingomyelin
Glossary
Glycerophospholipids
- PE
Phosphatidylethanolamine
- PC
Phosphatidylcholine
- (O−)
alkyl ether
- (P-)
alkenyl ether
- PI
Phosphatidylinositol
- PS
Phosphatidylserine
- PG
Phosphatidylglycerol
- LPC
Lysophosphatidylcholine (also includes alkyl ether LPCs, alkenyl ether LPCs)
Glossary
Prenol Lipids
- CoQ
coenzyme Q10
Supporting Information Available
The Supporting Information is available free of charge on the ACS Publications website at DOI: 10.1021/acscentsci.8b00932.
Author Contributions
¶ N.V. and J.A.M.R.K. contributed equally.
The authors declare no competing financial interest.
Supplementary Material
References
- DeBerardinis R. J.; Chandel N. S. Fundamentals of Cancer Metabolism. Sci. Adv. 2016, 2 (5), e1600200–e1600200. 10.1126/sciadv.1600200. [DOI] [PMC free article] [PubMed] [Google Scholar]
- Furuta E.; Pai S. K.; Zhan R.; Bandyopadhyay S.; Watabe M.; Mo Y.-Y.; Hirota S.; Hosobe S.; Tsukada T.; Miura K.; et al. Fatty Acid Synthase Gene Is Up-Regulated by Hypoxia via Activation of Akt and Sterol Regulatory Element Binding Protein-1. Cancer Res. 2008, 68 (4), 1003–1011. 10.1158/0008-5472.CAN-07-2489. [DOI] [PubMed] [Google Scholar]
- Koizume S.; Miyagi Y. Lipid Droplets : A Key Cellular Organelle Associated with Cancer Cell Survival under Normoxia and Hypoxia. Int. J. Mol. Sci. 2016, 17, 1–23. 10.3390/ijms17091430. [DOI] [PMC free article] [PubMed] [Google Scholar]
- Kamphorst J. J.; Cross J. R.; Fan J.; de Stanchina E.; Mathew R.; White E. P.; Thompson C. B.; Rabinowitz J. D. Hypoxic and Ras-Transformed Cells Support Growth by Scavenging Unsaturated Fatty Acids from Lysophospholipids. Proc. Natl. Acad. Sci. U. S. A. 2013, 110 (22), 8882–8887. 10.1073/pnas.1307237110. [DOI] [PMC free article] [PubMed] [Google Scholar]
- Counihan J. L.; Grossman E. A.; Nomura D. K. Cancer Metabolism: Current Understanding and Therapies. Chem. Rev. 2018, 118 (14), 6893–6923. 10.1021/acs.chemrev.7b00775. [DOI] [PubMed] [Google Scholar]
- Santos C. R.; Schulze A. Lipid Metabolism in Cancer. FEBS J. 2012, 279 (15), 2610–2623. 10.1111/j.1742-4658.2012.08644.x. [DOI] [PubMed] [Google Scholar]
- Schulze A.; Harris A. L. How Cancer Metabolism Is Tuned for Proliferation and Vulnerable to Disruption. Nature 2012, 491 (7424), 364–373. 10.1038/nature11706. [DOI] [PubMed] [Google Scholar]
- Thiam A. R.; Beller M. The Why, When and How of Lipid Droplet Diversity. J. Cell Sci. 2017, 130 (2), 315–324. 10.1242/jcs.192021. [DOI] [PubMed] [Google Scholar]
- Tirinato L.; Pagliari F.; Limongi T.; Marini M.; Falqui A.; Seco J.; Candeloro P.; Liberale C.; Di Fabrizio E. An Overview of Lipid Droplets in Cancer and Cancer Stem Cells. Stem Cells Int. 2017, 2017, 1–17. 10.1155/2017/1656053. [DOI] [PMC free article] [PubMed] [Google Scholar]
- Wu H.; Volponi J. V.; Oliver A. E.; Parikh A. N.; Simmons B. A.; Singh S. In Vivo Lipidomics Using Single-Cell Raman Spectroscopy. Proc. Natl. Acad. Sci. U. S. A. 2011, 108 (9), 3809–3814. 10.1073/pnas.1009043108. [DOI] [PMC free article] [PubMed] [Google Scholar]
- Balog J.; Sasi-Szabó L.; Kinross J.; Lewis M. R.; Muirhead L. J.; Veselkov K.; Mirnezami R.; Dezső B.; Damjanovich L.; Darzi A.; et al. Intraoperative Tissue Identification Using Rapid Evaporative Ionization Mass Spectrometry. Sci. Transl. Med. 2013, 5 (194), 194ra93. 10.1126/scitranslmed.3005623. [DOI] [PubMed] [Google Scholar]
- Wenk M. R. Lipidomics: New Tools and Applications. Cell 2010, 143 (6), 888–895. 10.1016/j.cell.2010.11.033. [DOI] [PubMed] [Google Scholar]
- Bergholt M. S.; Serio A.; McKenzie J. S.; Boyd A.; Soares R. F.; Tillner J.; Chiappini C.; Wu V.; Dannhorn A.; Takats Z.; et al. Correlated Heterospectral Lipidomics for Biomolecular Profiling of Remyelination in Multiple Sclerosis. ACS Cent. Sci. 2018, 4 (1), 39–51. 10.1021/acscentsci.7b00367. [DOI] [PMC free article] [PubMed] [Google Scholar]
- Hosokawa M.; Ando M.; Mukai S.; Osada K.; Yoshino T.; Hamaguchi H.; Tanaka T. In Vivo Live Cell Imaging for the Quantitative Monitoring of Lipids by Using Raman Microspectroscopy. Anal. Chem. 2014, 86 (16), 8224–8230. 10.1021/ac501591d. [DOI] [PubMed] [Google Scholar]
- Abramczyk H.; Surmacki J.; Kopeć M.; Olejnik A. K.; Lubecka-Pietruszewska K.; Fabianowska-Majewska K. The Role of Lipid Droplets and Adipocytes in Cancer. Raman Imaging of Cell Cultures: MCF10A, MCF7, and MDA-MB-231 Compared to Adipocytes in Cancerous Human Breast Tissue. Analyst 2015, 140 (7), 2224–2235. 10.1039/C4AN01875C. [DOI] [PubMed] [Google Scholar]
- Dória M. L.; Cotrim C. Z.; Simões C.; Macedo B.; Domingues P.; Domingues M. R.; Helguero L. A. Lipidomic Analysis of Phospholipids from Human Mammary Epithelial and Breast Cancer Cell Lines. J. Cell. Physiol. 2013, 228 (2), 457–468. 10.1002/jcp.24152. [DOI] [PubMed] [Google Scholar]
- Baumann J.; Sevinsky C.; Conklin D. S. Lipid Biology of Breast Cancer. Biochim. Biophys. Acta, Mol. Cell Biol. Lipids 2013, 1831 (10), 1509–1517. 10.1016/j.bbalip.2013.03.011. [DOI] [PMC free article] [PubMed] [Google Scholar]
- Liu Q.; Luo Q.; Halim A.; Song G. Targeting Lipid Metabolism of Cancer Cells: A Promising Therapeutic Strategy for Cancer. Cancer Lett. 2017, 401, 39–45. 10.1016/j.canlet.2017.05.002. [DOI] [PubMed] [Google Scholar]
- Infanger D. W.; Lynch M. E.; Fischbach C. Engineered Culture Models for Studies of Tumor-Microenvironment Interactions. Annu. Rev. Biomed. Eng. 2013, 15 (1), 29–53. 10.1146/annurev-bioeng-071811-150028. [DOI] [PMC free article] [PubMed] [Google Scholar]
- Fischbach C.; Chen R.; Matsumoto T.; Schmelzle T.; Brugge J. S.; Polverini P. J.; Mooney D. J. Engineering Tumors with 3D Scaffolds. Nat. Methods 2007, 4 (10), 855–860. 10.1038/nmeth1085. [DOI] [PubMed] [Google Scholar]
- Shekhar M. P. V.V.; Tait L.; Pauley R. J.; Wu G. S.; Santner S. J.; Nangia-Makker P.; Shekhar V.; Nassar H.; Visscher D. W.; Heppner G. H.; et al. Comedo-Ductal Carcinoma in Situ: A Paradoxical Role for Programmed Cell Death. Cancer Biol. Ther. 2008, 7 (11), 1774–1782. 10.4161/cbt.7.11.6781. [DOI] [PMC free article] [PubMed] [Google Scholar]
- McElwee J. L.; Mohanan S.; Griffith O. L.; Breuer H. C.; Anguish L. J.; Cherrington B. D.; Palmer A. M.; Howe L. R.; Subramanian V.; Causey C. P.; et al. Identification of PADI2 as a Potential Breast Cancer Biomarker and Therapeutic Target. BMC Cancer 2012. 10.1186/1471-2407-12-500. [DOI] [PMC free article] [PubMed] [Google Scholar]
- Vidavsky N.; Kunitake J. A.; Chiou A. E.; Northrup P. A.; Porri T. J.; Ling L.; Fischbach C.; Estroff L. A. Studying Biomineralization Pathways in a 3D Culture Model of Breast Cancer Microcalcifications. Biomaterials 2018, 179, 71–82. 10.1016/j.biomaterials.2018.06.030. [DOI] [PMC free article] [PubMed] [Google Scholar]
- DelNero P.; Lane M.; Verbridge S. S.; Kwee B.; Kermani P.; Hempstead B.; Stroock A.; Fischbach C. 3D Culture Broadly Regulates Tumor Cell Hypoxia Response and Angiogenesis via Pro-Inflammatory Pathways. Biomaterials 2015, 55, 110–118. 10.1016/j.biomaterials.2015.03.035. [DOI] [PMC free article] [PubMed] [Google Scholar]
- Kang H. S.; Lee S. C.; Park Y. S.; Jeon Y. E.; Lee J. H.; Jung S. Y.; Park I. H.; Jang S. H.; Park H. M.; Yoo C. W.; et al. Protein and Lipid MALDI Profiles Classify Breast Cancers According to the Intrinsic Subtype. BMC Cancer 2011, 11 (1), 465. 10.1186/1471-2407-11-465. [DOI] [PMC free article] [PubMed] [Google Scholar]
- Kawashima M.; Iwamoto N.; Kawaguchi-Sakita N.; Sugimoto M.; Ueno T.; Mikami Y.; Terasawa K.; Sato T. A.; Tanaka K.; Shimizu K.; et al. High-Resolution Imaging Mass Spectrometry Reveals Detailed Spatial Distribution of Phosphatidylinositols in Human Breast Cancer. Cancer Sci. 2013, 104 (10), 1372–1379. 10.1111/cas.12229. [DOI] [PMC free article] [PubMed] [Google Scholar]
- Angerer T. B.; Magnusson Y.; Landberg G.; Fletcher J. S. Lipid Heterogeneity Resulting from Fatty Acid Processing in the Human Breast Cancer Microenvironment Identified by GCIB-ToF-SIMS Imaging. Anal. Chem. 2016, 88 (23), 11946–11954. 10.1021/acs.analchem.6b03884. [DOI] [PubMed] [Google Scholar]
- Cífková E.; Holčapek M.; Lísa M.; Vrána D.; Melichar B.; Študent V. Lipidomic Differentiation between Human Kidney Tumors and Surrounding Normal Tissues Using HILIC-HPLC/ESI-MS and Multivariate Data Analysis. J. Chromatogr. B: Anal. Technol. Biomed. Life Sci. 2015, 1000, 14–21. 10.1016/j.jchromb.2015.07.011. [DOI] [PubMed] [Google Scholar]
- Hilvo M.; Denkert C.; Lehtinen L.; Muller B.; Brockmoller S.; Seppanen-Laakso T.; Budczies J.; Bucher E.; Yetukuri L.; Castillo S.; et al. Novel Theranostic Opportunities Offered by Characterization of Altered Membrane Lipid Metabolism in Breast Cancer Progression. Cancer Res. 2011, 71 (9), 3236–3245. 10.1158/0008-5472.CAN-10-3894. [DOI] [PubMed] [Google Scholar]
- Perrotti F.; Rosa C.; Cicalini I.; Sacchetta P.; Del Boccio P.; Genovesi D.; Pieragostino D. Advances in Lipidomics for Cancer Biomarkers Discovery. Int. J. Mol. Sci. 2016, 17 (12), 1992. 10.3390/ijms17121992. [DOI] [PMC free article] [PubMed] [Google Scholar]
- Chughtai K.; Jiang L.; Greenwood T. R.; Glunde K.; Heeren R. M. A. Mass Spectrometry Images Acylcarnitines, Phosphatidylcholines, and Sphingomyelin in MDA-MB-231 Breast Tumor Models. J. Lipid Res. 2013, 54 (2), 333–344. 10.1194/jlr.M027961. [DOI] [PMC free article] [PubMed] [Google Scholar]
- Confocal Raman Microscopy; Dieing T., Hollricher O., Toporski J., Eds.; Springer Berlin Heidelberg: Berlin, Heidelberg, 2011. [Google Scholar]
- Butler H. J.; Ashton L.; Bird B.; Cinque G.; Curtis K.; Dorney J.; Esmonde-White K.; Fullwood N. J.; Gardner B.; Martin-Hirsch P. L.; et al. Using Raman Spectroscopy to Characterize Biological Materials. Nat. Protoc. 2016, 11 (4), 664–687. 10.1038/nprot.2016.036. [DOI] [PubMed] [Google Scholar]
- Talari A. C. S.; Movasaghi Z.; Rehman S.; Rehman I. U. Raman Spectroscopy of Biological Tissues. Appl. Spectrosc. Rev. 2015, 50 (1), 46–111. 10.1080/05704928.2014.923902. [DOI] [Google Scholar]
- Soule H. D.; Maloney T. M.; Wolman S. R.; Peterson W. D.; Brenz R.; McGrath C. M.; Russo J.; Pauley R. J.; Jones R. F.; Brooks S. C. Isolation and Characterization of a Spontaneously Immortalized Human Breast Epithelial Cell Line, MCF-10. Cancer Res. 1990, 50 (18), 6075–6086. [PubMed] [Google Scholar]
- Miller F. R.; Santner S. J.; Tait L.; Dawson P. J. MCF10DCIS.Com Xenograft Model of Human Comedo Ductal Carcinoma in Situ. J. Natl. Cancer Inst. 2000, 92 (14), 1185–1186. 10.1093/jnci/92.14.1185a. [DOI] [PubMed] [Google Scholar]
- Barnabas N.; Cohen D. Phenotypic and Molecular Characterization of MCF10DCIS and SUM Breast Cancer Cell Lines. Int. J. Breast Cancer 2013, 2013, 872743. 10.1155/2013/872743. [DOI] [PMC free article] [PubMed] [Google Scholar]
- Santner S. J.; Dawson P. J.; Tait L.; Soule H. D.; Eliason J.; Mohamed A. N.; Wolman S. R.; Heppner G. H.; Miller F. R. Malignant MCF10CA1 Cell Lines Derived from Premalignant Human Breast Epithelial MCF10AT Cells. Breast Cancer Res. Treat. 2001, 65 (2), 101–110. 10.1023/A:1006461422273. [DOI] [PubMed] [Google Scholar]
- Alo P. L.; Visca P.; Marci A.; Mangoni A.; Botti C.; Di Tondo U. Expression of Fatty Acid Synthase (FAS) as a Predictor of Recurrence in Stage I Breast Carcinoma Patients. Cancer 1996, 77 (3), 474–482. . [DOI] [PubMed] [Google Scholar]
- Milgraum L. Z.; Witters L. A.; Pasternack G. R.; Kuhajda F. P. Enzymes of the Fatty Acid Synthesis Pathway Are Highly Expressed in in Situ Breast Carcinoma. Clin. Cancer Res. 1997, 3 (11), 2115–2120. [PubMed] [Google Scholar]
- Menendez J. A.; Lupu R. Fatty Acid Synthase and the Lipogenic Phenotype in Cancer Pathogenesis. Nat. Rev. Cancer 2007, 7 (10), 763–777. 10.1038/nrc2222. [DOI] [PubMed] [Google Scholar]
- Ghosh C.; Nandi S.; Bhattacharyya K. Probing Micro-Environment of Lipid Droplets in a Live Breast Cell: MCF7 and MCF10A. Chem. Phys. Lett. 2017, 670, 27–31. 10.1016/j.cplett.2016.12.068. [DOI] [Google Scholar]
- Wilmanski T.; Buhman K.; Donkin S. S.; Burgess J. R.; Teegarden D. 1α,25-Dihydroxyvitamin D Inhibits de Novo Fatty Acid Synthesis and Lipid Accumulation in Metastatic Breast Cancer Cells through down-Regulation of Pyruvate Carboxylase. J. Nutr. Biochem. 2017, 40, 194–200. 10.1016/j.jnutbio.2016.11.006. [DOI] [PMC free article] [PubMed] [Google Scholar]
- Liu X.; Kim C. N.; Yang J.; Jemmerson R.; Wang X. Induction of Apoptotic Program in Cell-Free Extracts: Requirement for DATP and Cytochrome C. Cell 1996, 86 (1), 147–157. 10.1016/S0092-8674(00)80085-9. [DOI] [PubMed] [Google Scholar]
- Rygula A.; Majzner K.; Marzec K. M.; Kaczor A.; Pilarczyk M.; Baranska M. Raman Spectroscopy of Proteins: A Review. J. Raman Spectrosc. 2013, 44 (8), 1061–1076. 10.1002/jrs.4335. [DOI] [Google Scholar]
- Ogretmen B. Sphingolipid Metabolism in Cancer Signalling and Therapy. Nat. Rev. Cancer 2017, 18 (1), 33–50. 10.1038/nrc.2017.96. [DOI] [PMC free article] [PubMed] [Google Scholar]
- Kenny P. A.; Lee G. Y.; Myers C. A.; Neve R. M.; Semeiks J. R.; Spellman P. T.; Lorenz K.; Lee E. H.; Barcellos-Hoff M. H.; Petersen O. W.; et al. The Morphologies of Breast Cancer Cell Lines in Three-Dimensional Assays Correlate with Their Profiles of Gene Expression. Mol. Oncol. 2007, 1 (1), 84–96. 10.1016/j.molonc.2007.02.004. [DOI] [PMC free article] [PubMed] [Google Scholar]
- Nath S.; Devi G. R. Three-Dimensional Culture Systems in Cancer Research: Focus on Tumor Spheroid Model. Pharmacol. Ther. 2016, 163, 94–108. 10.1016/j.pharmthera.2016.03.013. [DOI] [PMC free article] [PubMed] [Google Scholar]
- Edmondson R.; Broglie J. J.; Adcock A. F.; Yang L. Three-Dimensional Cell Culture Systems and Their Applications in Drug Discovery and Cell-Based Biosensors. Assay Drug Dev. Technol. 2014, 12 (4), 207–218. 10.1089/adt.2014.573. [DOI] [PMC free article] [PubMed] [Google Scholar]
- Tauchi-Sato K.; Ozeki S.; Houjou T.; Taguchi R.; Fujimoto T. The Surface of Lipid Droplets Is a Phospholipid Monolayer with a Unique Fatty Acid Composition. J. Biol. Chem. 2002, 277 (46), 44507–44512. 10.1074/jbc.M207712200. [DOI] [PubMed] [Google Scholar]
- Penno A.; Hackenbroich G.; Thiele C. Phospholipids and Lipid Droplets. Biochim. Biophys. Acta, Mol. Cell Biol. Lipids 2013, 1831 (3), 589–594. 10.1016/j.bbalip.2012.12.001. [DOI] [PubMed] [Google Scholar]
- Wilfling F.; Wang H.; Haas J. T.; Krahmer N.; Gould T. J.; Uchida A.; Cheng J.-X.; Graham M.; Christiano R.; Fröhlich F.; et al. Triacylglycerol Synthesis Enzymes Mediate Lipid Droplet Growth by Relocalizing from the ER to Lipid Droplets. Dev. Cell 2013, 24 (4), 384–399. 10.1016/j.devcel.2013.01.013. [DOI] [PMC free article] [PubMed] [Google Scholar]
- Mouritsen O. G.; Bagatolli L. A.. Life-as a Matter of Fat, 2nd ed.; Springer-Verlag: Heidelberg, 2005. [Google Scholar]
- Walther T. C.; Farese R. V. The Life of Lipid Droplets. Biochim. Biophys. Acta, Mol. Cell Biol. Lipids 2009, 1791 (6), 459–466. 10.1016/j.bbalip.2008.10.009. [DOI] [PMC free article] [PubMed] [Google Scholar]
- Nieman K. M.; Kenny H. A.; Penicka C. V.; Ladanyi A.; Buell-Gutbrod R.; Zillhardt M. R.; Romero I. L.; Carey M. S.; Mills G. B.; Hotamisligil G. S.; et al. Adipocytes Promote Ovarian Cancer Metastasis and Provide Energy for Rapid Tumor Growth. Nat. Med. 2011, 17, 1498–1503. 10.1038/nm.2492. [DOI] [PMC free article] [PubMed] [Google Scholar]
- Nieman K. M.; Romero I. L.; Van Houten B.; Lengyel E. Adipose Tissue and Adipocytes Support Tumorigenesis and Metastasis. Biochim. Biophys. Acta, Mol. Cell Biol. Lipids 2013, 1831 (10), 1533–1541. 10.1016/j.bbalip.2013.02.010. [DOI] [PMC free article] [PubMed] [Google Scholar]
- Thiam A. R.; Farese R. V.; Walther T. C. The Biophysics and Cell Biology of Lipid Droplets. Nat. Rev. Mol. Cell Biol. 2013, 14 (12), 775–786. 10.1038/nrm3699. [DOI] [PMC free article] [PubMed] [Google Scholar]
- Pelletier J.; Bellot G.; Gounon P.; Lacas-Gervais S.; Pouysségur J.; Mazure N. M. Glycogen Synthesis Is Induced in Hypoxia by the Hypoxia-Inducible Factor and Promotes Cancer Cell Survival. Front. Oncol. 2012, 2, 18. 10.3389/fonc.2012.00018. [DOI] [PMC free article] [PubMed] [Google Scholar]
- Pescador N.; Villar D.; Cifuentes D.; Garcia-Rocha M.; Ortiz-Barahona A.; Vazquez S.; Ordoñez A.; Cuevas Y.; Saez-Morales D.; Garcia-Bermejo M. L.; et al. Hypoxia Promotes Glycogen Accumulation through Hypoxia Inducible Factor (HIF)-Mediated Induction of Glycogen Synthase 1. PLoS One 2010, 5 (3), e9644 10.1371/journal.pone.0009644. [DOI] [PMC free article] [PubMed] [Google Scholar]
- Favaro E.; Bensaad K.; Chong M. G.; Tennant D. A.; Ferguson D. J. P.; Snell C.; Steers G.; Turley H.; Li J.-L.; Günther U. L.; et al. Glucose Utilization via Glycogen Phosphorylase Sustains Proliferation and Prevents Premature Senescence in Cancer Cells. Cell Metab. 2012, 16 (6), 751–764. 10.1016/j.cmet.2012.10.017. [DOI] [PubMed] [Google Scholar]
- Okada M.; Smith N. I.; Palonpon A. F.; Endo H.; Kawata S.; Sodeoka M.; Fujita K. Label-Free Raman Observation of Cytochrome c Dynamics during Apoptosis. Proc. Natl. Acad. Sci. U. S. A. 2012, 109 (1), 28–32. 10.1073/pnas.1107524108. [DOI] [PMC free article] [PubMed] [Google Scholar]
- Vazquez A.; Kamphorst J. J.; Markert E. K.; Schug Z. T.; Tardito S.; Gottlieb E. Cancer Metabolism at a Glance. J. Cell Sci. 2016, 129 (18), 3367–3373. 10.1242/jcs.181016. [DOI] [PMC free article] [PubMed] [Google Scholar]
- Worgall T. S. Sphingolipids: Major Regulators of Lipid Metabolism. Curr. Opin. Clin. Nutr. Metab. Care 2007, 10 (2), 149–155. 10.1097/MCO.0b013e328028fda3. [DOI] [PubMed] [Google Scholar]
- Eichmann T. O.; Lass A. DAG Tales: The Multiple Faces of Diacylglycerol—stereochemistry, Metabolism, and Signaling. Cell. Mol. Life Sci. 2015, 72 (20), 3931–3952. 10.1007/s00018-015-1982-3. [DOI] [PMC free article] [PubMed] [Google Scholar]
- Kadota M.; Yang H. H.; Gomez B.; Sato M.; Clifford R. J.; Meerzaman D.; Dunn B. K.; Wakefield L. M.; Lee M. P. Delineating Genetic Alterations for Tumor Progression in the MCF10A Series of Breast Cancer Cell Lines. PLoS One 2010, 5 (2), e9201 10.1371/journal.pone.0009201. [DOI] [PMC free article] [PubMed] [Google Scholar]
- Han G.; Gupta S. D.; Gable K.; Niranjanakumari S.; Moitra P.; Eichler F.; Brown R. H.; Harmon J. M.; Dunn T. M. Identification of Small Subunits of Mammalian Serine Palmitoyltransferase That Confer Distinct Acyl-CoA Substrate Specificities. Proc. Natl. Acad. Sci. U. S. A. 2009, 106 (20), 8186–8191. 10.1073/pnas.0811269106. [DOI] [PMC free article] [PubMed] [Google Scholar]
- Knapp P.; Baranowski M.; Knapp M.; Zabielski P.; Błachnio-Zabielska A. U.; Górski J. Altered Sphingolipid Metabolism in Human Endometrial Cancer. Prostaglandins Other Lipid Mediators 2010, 92 (1–4), 62–66. 10.1016/j.prostaglandins.2010.03.002. [DOI] [PubMed] [Google Scholar]
- Patra S. K. Dissecting Lipid Raft Facilitated Cell Signaling Pathways in Cancer. Biochim. Biophys. Acta, Rev. Cancer 2008, 1785 (2), 182–206. 10.1016/j.bbcan.2007.11.002. [DOI] [PubMed] [Google Scholar]
- Hannun Y. A.; Obeid L. M. Principles of Bioactive Lipid Signalling: Lessons from Sphingolipids. Nat. Rev. Mol. Cell Biol. 2008, 9 (2), 139–150. 10.1038/nrm2329. [DOI] [PubMed] [Google Scholar]
- Wallner S.; Schmitz G. Plasmalogens the Neglected Regulatory and Scavenging Lipid Species. Chem. Phys. Lipids 2011, 164 (6), 573–589. 10.1016/j.chemphyslip.2011.06.008. [DOI] [PubMed] [Google Scholar]
- Benjamin D. I.; Cozzo A.; Ji X.; Roberts L. S.; Louie S. M.; Mulvihill M. M.; Luo K.; Nomura D. K. Ether Lipid Generating Enzyme AGPS Alters the Balance of Structural and Signaling Lipids to Fuel Cancer Pathogenicity. Proc. Natl. Acad. Sci. U. S. A. 2013, 110 (37), 14912–14917. 10.1073/pnas.1310894110. [DOI] [PMC free article] [PubMed] [Google Scholar]
- Piano V.; Benjamin D. I.; Valente S.; Nenci S.; Marrocco B.; Mai A.; Aliverti A.; Nomura D. K.; Mattevi A. Discovery of Inhibitors for the Ether Lipid-Generating Enzyme AGPS as Anti-Cancer Agents. ACS Chem. Biol. 2015, 10 (11), 2589–2597. 10.1021/acschembio.5b00466. [DOI] [PMC free article] [PubMed] [Google Scholar]
- Dean J. M.; Lodhi I. J. Structural and Functional Roles of Ether Lipids. Protein Cell 2018, 9 (2), 196–206. 10.1007/s13238-017-0423-5. [DOI] [PMC free article] [PubMed] [Google Scholar]
- Koivuniemi A. The Biophysical Properties of Plasmalogens Originating from Their Unique Molecular Architecture. FEBS Lett. 2017, 591 (18), 2700–2713. 10.1002/1873-3468.12754. [DOI] [PubMed] [Google Scholar]
- Zeno W. F.; Baul U.; Snead W. T.; DeGroot A. C. M.; Wang L.; Lafer E. M.; Thirumalai D.; Stachowiak J. C. Synergy between Intrinsically Disordered Domains and Structured Proteins Amplifies Membrane Curvature Sensing. Nat. Commun. 2018, 9, 4152. 10.1038/s41467-018-06532-3. [DOI] [PMC free article] [PubMed] [Google Scholar]
- Huang C.; Cao Z.; Ma J.; Shen Y.; Bu Y.; Khoshaba R.; Shi G.; Huang D.; Liao D.-F.; Ji H.; et al. AKR1B10 Activates Diacylglycerol (DAG) Second Messenger in Breast Cancer Cells. Mol. Carcinog. 2018, 57 (10), 1300–1310. 10.1002/mc.22844. [DOI] [PMC free article] [PubMed] [Google Scholar]
- Kunitake J. A. M. R.; Choi S.; Nguyen K. X.; Lee M. M.; He F.; Sudilovsky D.; Morris P. G.; Jochelson M. S.; Hudis C. A.; Muller D. A.; et al. Correlative Imaging Reveals Physiochemical Heterogeneity of Microcalcifications in Human Breast Carcinomas. J. Struct. Biol. 2018, 202 (1), 25–34. 10.1016/j.jsb.2017.12.002. [DOI] [PMC free article] [PubMed] [Google Scholar]
Associated Data
This section collects any data citations, data availability statements, or supplementary materials included in this article.