

Abstract
Preventing ice formation during cryopreservation by vitrification has led to the successful storage and banking of numerous cellular and tissue-based biomaterials. In their breakthrough work, Peter Mazur’s group achieved over 90% survival by using a laser warming technique for 100 µm mice oocytes that were cooled in 0.1 µL droplets with 2.3M CPA and extracellularly loaded India Ink (laser absorber). Laser warming can provide rapid and uniform warming rates to “outrun” damaging ice crystal growth. Here we generalize Mazur’s technique for microliter sized droplets using laser nanowarming to rewarm millimeter-scale biomaterials when loaded extracellularly and/or intracellularly with biocompatible 1064 nm resonant gold nanoparticles. We first show that droplets containing low concentration cryoprotectants (such as 2M Propylene Glycol +/− 1M Trehalose) can be rapidly cooled at rates up to 90,000 °C/min by plunging into liquid nitrogen to achieve either a visually transparent (i.e. vitrified) or a cloudy with ice (i.e. non-vitrified) state. Both modeling and experiments were then used to characterize the process for different laser energy (2–6J), pulse length (1–20ms), droplet volume (0.2–1.8µL), cryoprotectant (2–3M) and gold concentration (0.77–4.8 ×10¹⁷ nps/m3) to assess physical and biological success. Physical success was achieved by finding conditions that minimize cloudiness and white spots within the droplets during cooling and warming as signs of damaging ice formation and ice crystallization respectively. Biological success was achieved using human dermal fibroblasts to find conditions that achieve ≥ 90 % cell viability normalized to controls post warming. Thus, physical and biological success can be achieved using this platform cryopreservation approach of cryotop cooling and laser gold nanowarming in mm scale systems.
Keywords: Cryopreservation, Rapid Vitrification, Gold Nanoparticles, Photothermal Heating, Laser Nanowarming
Graphical Abstract
Introduction
Vitrification, the freezing of material to a “glassy” rather than crystalline phase, is an important enabling approach for cryopreservation1–2. Vitrification relies on cooling rapidly below the glass transition temperature without growth of ice (a kinetic process) despite passing through a thermodynamic regime favorable to nucleation and ice growth (i.e. passing through heterogenous, Thet, and homogenous, Thom, nucleation temperatures). Figure 1a shows the phase diagram for a hypothetical cryoprotective agents (CPA) where, once below the glass transition temperature Tg, biomaterials are considered “cryogenically stable” for long-term storage since no additional ice crystallization can occur. To rewarm, one has the same challenge in reverse: as the biomaterial rises above the devitrification temperature (i.e. reversion from glassy to crystalline phase), again passing through the homogeneous and heterogenous nucleation temperatures, one must reach the melt temperature without the occurrence of significant ice crystallization or re-crystallization. Avoiding ice growth in the temperature range between Tg and Tm can be achieved by increasing both CPA concentration (which reduces the difference between Tg and Tm) and/or warming rates (which reduces the time to allow ice crystallization).
Figure 1. Predicting ice formation for low concentration CPA (< 4M).
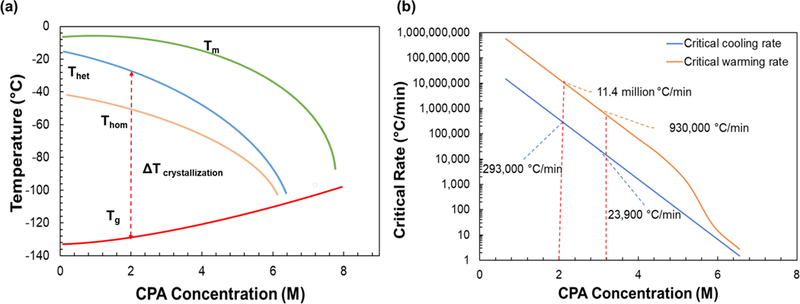
(a) Phase diagram for a theoretical CPA with TM- Melt temperature, THom- Homogenous nucleation temperature, THet- Heterogeneous nucleation temperature, TG- Glass transition temperature and ΔTcrystallization– temperature range during which the probability of ice crystallization is highest (modified from Fahy et al 19841). (b) Critical rates for PG obtained from literature showing experimental results obtained from a DSC for greater than 5M. Note the there is no experimental data available for concentrations less than 5M for PG, so theoretical predictions were made using Boutron’s data and model8–9, 12, 15–16. Using this approach, we predict critical cooling rates (CCR) of 293,000 °C/min and 23,000 °C/min and critical warming rates (CWR) of 11,400,000 °C/min and 930,000 °C/min for 2M PG and 2M and 1M Trehalose, respectively.
In theory, there is an inverse relationship between the cooling and warming rates needed to prevent ice growth and the CPA concentration used for vitrification. In reality, the lowest concentration of CPAs that will cool and warm the sample without ice formation is used to prevent toxicity to biological samples. For example, upwards of 6 to 8 M CPA is used with large centimeter-sized tissues and organs in order to prevent ice crystal growth in the temperature range between Tg and Tm3. For these larger cm-scale systems, boundary cooling and warming (i.e. convective boundary conditions) achieve only 10 – 100 °C/min rates. Nevertheless, a high concentration (~ 8M) CPA vitrification approach was originally found to be effective in mouse embryo cryopreservation.4 Later work found that lower concentrations closer to 2M can also be used if rates of cooling and warming are dramatically increased. This is important as it reduces CPA concentration and therefore toxicity in many specialized cells such as embryos5–6 and oocytes7. The critical rates of cooling and warming (i.e. CCR and CWR) necessary to achieve vitrification and avoid devitrification (i.e. ice crystallization from vitrified glassy phase) in higher concentration (≥ 5M) CPAs have been studied using differential scanning calorimetry (DSC) for propylene glycol (PG)8–9, DMSO10–11, ethylene glycol12, linear poly alcoohols13, and diethylformamide.14 Nevertheless, the CCR and CWR rates have never been directly measured for low concentration CPAs (< 4M) due to the inaccessibility of high rates (> 100s °C/min) during experimentation. Figure 1b plots the CCR and CWR needed to avoid ice formation (≤ 0.2% of mass of CPA solution) for varying concentrations of PG. Rates here were obtained experimentally from ≥ 5M DSC measurements12,15 and theoretically extrapolated for ice crystallization in PG/water (< 5M) using Boutron’s equations8–9, 12, 15–16. Several other theoretical estimates for CCR available in literature for different CPAs (2–3M) range from 10,000 to 500,000 °C/min16–18. Importantly, CWRs often need to exceed CCRs by at least an order of magnitude to avoid ice crystallization because of the presence of small ice nuclei within cryogenically stabilized specimens. In short, achieving CCR and CWR is critical for successful cryopreservation and there continues to be a need for accurate, quantitative measurements of both CCR and CWR for low concentration (< 4 M) CPA solutions.
Today, there are many commercially available devices that approach or achieve the necessary CCR required for vitrifying low concentration CPA solutions (w/ or w/o cells). Some example devices include the cryotop19, Open Pulled Straw20, Quartz Micro Capillary21, and copper grids7. For instance, the cryotop system can achieve rates greater than 69,000 °C/min for 0.1µL systems such as mouse oocytes (Dcell=80 µm)22–23 but is unable to provide the high warming rates by convection alone needed to prevent visible ice crystal formation during warming for volumes greater than 0.1µL. Likewise, zebrafish embryos (V=1µL, Dcell=1mm) can be microinjected with 2M PG glycol and rapidly cooled below cryogenic temperatures with the cryotop, but convective warming consistently leads to failure (0% survival) since it is not fast enough to prevent ice formation within the larger embryo6. In short, even with fast cooling, faster warming remains essential to either prevent or “outrun” ice crystal growth especially in low concentration CPA systems24.
To further emphasize this point, Peter Mazur’s group recently pioneered a new laser warming technique that can “rescue” samples that were cooled with less than optimal CPA or simply cooled at rates below CCR such that some ice may have formed during cooling. More specifically, mice oocytes were successfully rewarmed despite being cooled at or below the CCR25. This was possible through Mazur’s ultra-rapid laser warming technique using India Ink (i.e. carbon black) as a laser absorber. Briefly, India Ink, a broad-band laser absorber, was deployed with CPA (~2.3M) around the oocytes to provide “extracellular” absorption of the laser to achieve warming rates of 107 °C/min. This work demonstrated excellent viability (96%) of mouse oocytes (Dcell = 80 µm) vitrified by rapid cooling with a cryotop and then warmed with a laser23. Comparatively, just 28% of mice oocytes (V = 0.1µL) survived that were rewarmed at a rate of 117,000 °C/min convectively with the cryotop. This shows that despite the ability of the cryotop to provide fast cooling rates for 0.1 µL samples without ice formation with under 3M CPA, it failed to provide an ultra-rapid warming rate needed to stop ice crystallization during rewarming. Importantly, this suggests that rapid warming rates provided by laser warming could drastically reduce the need for higher concentrations of CPA.
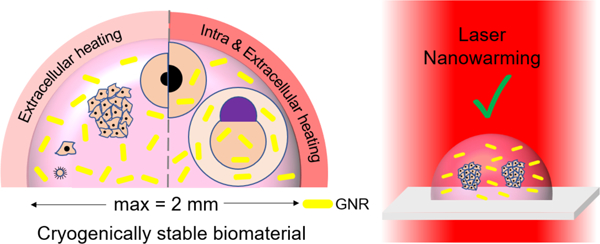
Although Mazur’s extracellular heating approach worked on smaller oocytes, it fails on millimeter-sized cellular systems like fish embryos due the large thermal gradients introduced by heating only in the extracellular space23. To address this issue, our research group developed a combined intracellular and extracellular warming approach using biocompatible and plasmonically designed gold nanorods (GNRs) that absorb specifically and reproducibly at 1064 nm, a wavelength where pulsed laser systems with appropriate energy already exist. This approach was used to successfully rewarm cryopreserved zebrafish embryos, which are 1000x larger than mammalian embryos, using a single 1064nm laser pulse. The biocompatible PEGylated GNRs are microinjected directly into the zebrafish embryos with 2.3M PG, thereby helping to distribute the laser energy throughout the embryo during warming6. The biocompatibility of PEGylated GNR is supported by numerous studies showing that after removal of toxic CTAB, these nanoparticles are safe for use in numerous biomedical applications including intravenous injections26–29. This work also demonstrated high viability of human dermal fibroblasts (Dcell=10 µm) cells cryopreserved in 1µL droplets (100,000 cells/mL) with 2M PG and GNRs present extracellularly and laser warmed at rate of 1.4 × 10⁷ °C/min6. Thus, gold nanoparticle-based laser warming (i.e. laser nanowarming) has the potential to provide a platform for both extra- and intra-cellular heating to successfully cryopreserve a variety of up to mm sized biomaterials in µL sized droplets.
In this study, we provide a detailed analysis of the physical conditions necessary for the successful application of this technology. We experimentally varied CPA and GNR concentrations, droplet volume, laser energy and pulse width to identify the optimal cooling and rewarming conditions. We also used FEM modeling to analyze and predict the physical conditions for success and failure of this laser warming technology. Finally, human dermal fibroblast cells were deployed within the droplets to explore the overlap of physical and biological conditions necessary for successful application of this technique.
Results and Discussion
Relationship between average laser energy and GNR concentration
Figure 2 shows an overview of the laser nanowarming process that can be used to cryopreserve a variety of biomaterials encapsulated in a microliter sized droplet. Specifically, a sample droplet containing various biomaterials, CPAs, and GNRs are loaded onto the cryotop and then plunged into LN2 by the motor for rapid cooling. To initiate laser warming, the sample droplet is brought up by the motor into laser focus. For smaller samples like viruses, cells, and cell aggregates, the GNRs can be present extracellularly. For larger samples like fish embryos, the GNRs must be present both intra and extracellularly to achieve uniform and rapid warming. The key physics of the rewarming process are governed by the heat generation term which is generally referred to as the Specific Absorption Rate:, where N is the GNR concentration (nps/m3, 106 nps/mL), Cabs is the absorption cross section (m2), and I is the laser fluence rate (W/m2).
Figure 2. Overview of laser nanowarming system.
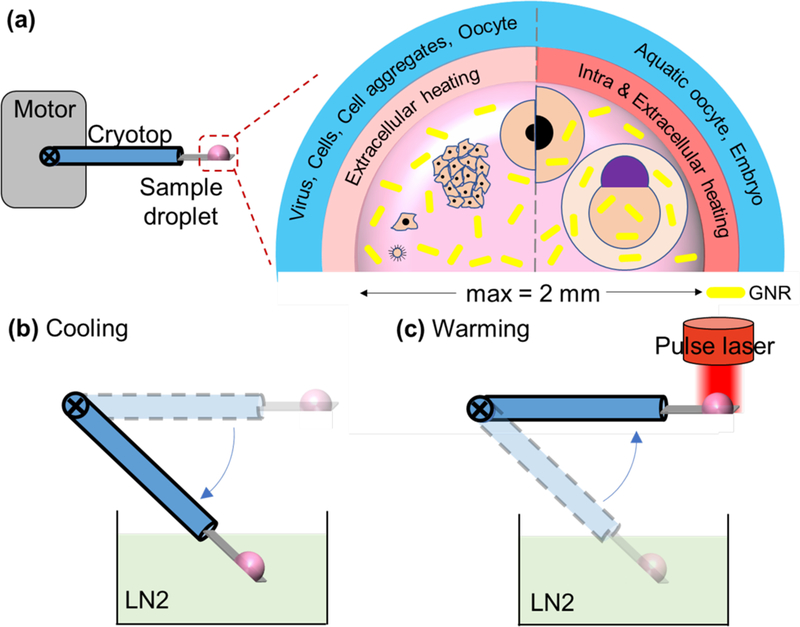
(a) Sample droplet consists of biomaterial(s), CPA, and gold nanorods with a maximum volume of 1.8 µL loaded onto a customized cryotop for rapid cooling and laser warming. Various biomaterials in different sizes including cells, cell aggregates, oocytes, coral larvae, and embryos which can be loaded in the droplet for extracellular and/or intracellular laser nanowarming. (b) A motor automatically and reproducibly immerses the sample droplet into LN2 for rapid cooling at ~ 90,000 °C/min (for 1µL droplet). (c) The motor elevates the cryogenically stabilized droplet into focus for pulsed laser irradiation yielding ultra-rapid rewarming at rates up to 2 × 10⁷ °C/min
We first selected our droplet volume to be 1 µL as it covers the size of most gametes and embryos. Since we were unable to completely vitrify (i.e. freeze clear or transparent) 1 µL droplets of 2M PG alone using the cryotop, we increased the concentration to 3M PG which was successful in 1 µL droplets. However, biomaterials like coral larvae and other germplasm can be particularly sensitive to CPAs higher than 2M30. Therefore to reduce toxicity and increase stability, we substituted 1M Trehalose for the extra 1M PG as this has shown benefit in other vitrified systems31. Figure 3a shows a plot of the average laser energy used to rewarm 1µL droplets of 2M PG and 1M Trehalose. In this case, we were rewarming a droplet containing variable GNR concentrations from 0.77 × 10¹⁷ nps/m3 (0.14mM), 1.3 × 10¹⁷ nps/m3 (0.23mM), 2.6 × 10¹⁷ nps/m3 (0.46mM), 3.8 × 10¹⁷ nps/m3 (0.69mM), and 4.8 × 10¹⁷ nps/m3 (0.87mM).
Figure 3. Correlation between GNR concentration and laser energy needed to avoid crystallization during warming.
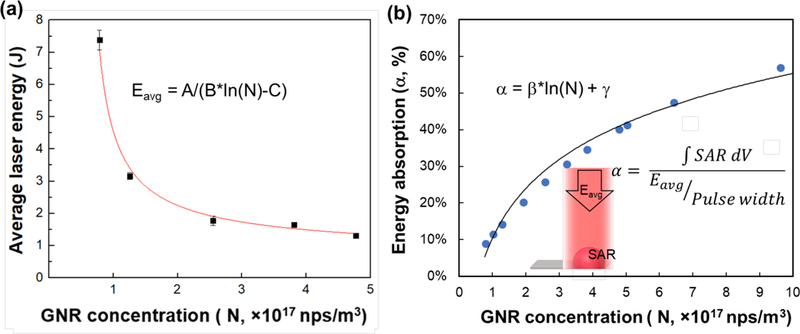
(a) Laser energy averaged upon different laser settings that melt the droplet without crystallization decreases with increasing GNR concentration, indicating higher energy absorption percentage for higher GNR concentration as shown in (b). The fitted empirical function can be used to estimate laser energy required for other GNR concentrations. The fitting function is Eavg=1.5/(0.49ln(N)-18), with R2 =0.96. (b) Energy absorption percentage α, defined as the percentage of single laser pulse energy that is absorbed by the GNR-loaded droplet with 1 µL volume, increases with increasing GNR concentration. The fitting function is α=0.19ln(N)+0.1, with R2 =0.99.
The average laser energy represents the mean value of energy per pulse for different laser settings that resulted in rewarming of the droplet without any ice crystallization (i.e. going from clear to cloudy). For instance, a droplet with GNR concentration of 1.3 × 10¹⁷ nps/m3 was successfully rewarmed at 3.2 J. This energy can be provided by multiple different voltage and pulse widths such as 300V and 1ms, 250V and 1.6ms, 180V and 5.3ms, and many others. (See Figure S3 in Supporting Information for laser energy calibration curves for a i990 Weld laser). All these laser conditions resulted in rewarming the droplet above the Tm without any visible crystallization. The warming rate could be adjusted by simply changing the laser pulse width at a given GNR concentration and laser energy. Interestingly, as GNR concentration increases, the average laser energy needed for warming is expected to decrease since there are more nanoparticles in the droplet to absorb the laser energy. The fitting function reveals a strong correlation (R2 = 0.96) between average laser energy (Eavg, J) and GNR concentration (N, nps/m3) as . In addition, we used modeling to find the ratio between the energy from a single laser pulse (Eavg) and the heat generated inside the droplet, which can be written as . Figure 3b plots the percent of the laser energy absorbed by a 1µL droplet (α) for varying GNR concentrations. As expected, a strong correlation (R2=0.98) was also found as α = 0.19ln(N) + 0.1, which can be used to estimate the amount of energy that will be absorbed by the droplet for different GNR concentrations. For instance, a droplet with a GNR concentration of 0.77 × 10¹⁷ nps/m3, 1.3 × 10¹⁷ nps/m3, 2.6 × 10¹⁷ nps/m3, 3.8 × 10¹⁷ nps/m3, and 4.8 × 10¹⁷ nps/m3 will yield α of 8%, 14%, 26%, 35%, and 40%, respectively. This translates into 0.59J, 0.44J, 0.46J, 0.58J and 0.53J, respectively, as the energy absorbed by the respective GNR concentrations if the total energy per pulse is 3.2 J. This non-linear correlation between GNR concentration and droplet energy absorption efficiency (α) is attributed to the exponential attenuation of laser intensity within the droplet following Beer’s law.
Relationship between average laser energy and CPA concentration
As laser warming has shown the ability to successfully rewarm biomaterials cryopreserved with suboptimal conditions (i.e. some ice formation)6, 23, we studied the average laser energy needed to successfully rewarm (i.e. melt droplets) under variable cooling conditions that can in some cases yield ice formation. For this study, we selected a 1 µL droplet with two different GNR concentrations: N=1.3 × 10¹⁷ nps/m3 and 2.6 × 10¹⁷ nps/m3, both with variable CPA. More specifically, Figure 4a shows images of droplets of deionized (DI) water with 1M PG, 2M PG, 2M PG and 0.2M Trehalose, 2M PG and 0.5M Trehalose, 2M PG and 1M Trehalose and 5M PG, right before laser warming is initiated. The DI water, 1M PG, 2M PG and 2M PG and 0.2M Trehalose are all crystallized while the droplet of 2M PG and 0.5M Trehalose is partially crystallized, and droplets of 2M PG and 1M Trehalose and 5M PG are completely transparent. The average laser energy to rewarm these droplets can be seen in Figure 4b. This data set demonstrates the same trend presented in Figure 3a: namely, the droplets with higher GNR concentration of 2.6 × 10¹⁷ nps/m3 require less average laser energy to rewarm for all groups compared to those with lower GNR concentration of 1.3 × 10¹⁷ nps/m3. However, for the same GNR concentration, the average laser energy decreases with increasing CPA concentration. In addition, for either GNR concentration, there is no significant difference between the Eavg for 2M PG, 2M PG and 0.2M Trehalose, 2M PG and 0.5M Trehalose, 2M PG and 1M Trehalose groups when compared to each other (ANOVA, P>0.01). Nonetheless, there is significant difference between Eavg for these groups when compared to DI water, 1M PG and 5M PG (ANOVA, P<0.01). Figure 4c shows the energy absorbed (Eabs), which is the product of α and Eavg for the same groups in Figure 4b. The data suggests that there is no significant difference between the Eabs for the same CPA concentration across the two GNR concentrations (ANOVA, P>0.01) but there is a significant difference when compared across the different CPA concentrations (ANOVA, P<0.01).
Figure 4. Average laser energy to avoid ice crystallization for 1µL droplets with different CPA and GNR combinations during laser nanowarming.
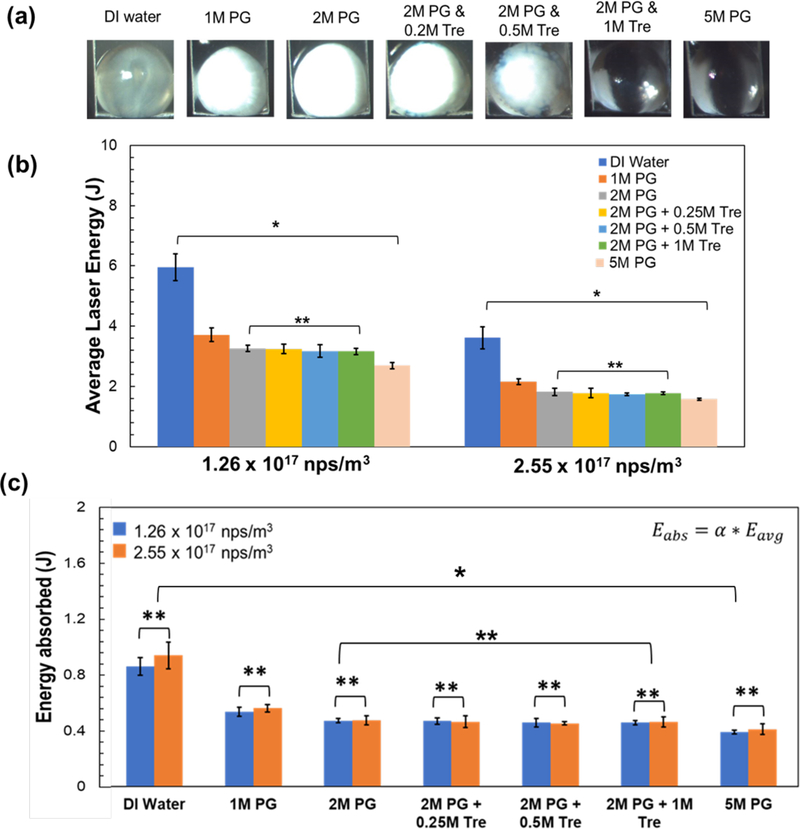
(a) Images of 1µL rapidly cooled droplets of DI water, 1M PG, 2M PG, 2M PG + 0.25M Trehalose, 2M PG + 0.5M Trehalose, 2M PG + 1M Trehalose, and 5M PG immediately before laser warming. Cloudy and translucent droplets show ice formation, whereas clear and transparent droplets demonstrate successful vitrification. (b) Plot shows the average laser energy for successful rewarming (no ice crystallization or cloudy spots) of 1µL droplets containing the same solutions shown in (a) with two different GNR concentrations (1.26 × 10¹⁷ nps/m3 and 2.55 × 10¹⁷ nps/m3). The average laser energy has been measured previously measured using a laser power meter (See Fig. S3 in Supporting Information). (c) Plot shows the amount of energy absorbed by the droplets under the same conditions as (a). The energy absorbed is calculated by using the energy absorption factor α (Figure 3), which is 14.4% and 25.9 % for 1.26 × 10¹⁷ nps/m3 and 2.55 × 10¹⁷ nps/m3 GNR concentrations, respectively. The error bars represent the standard error of the mean of laser energy that resulted in successful rewarming for both (a) and (b). Notation “* “means that there is significant difference between the groups (ANOVA, P < 0.01), whereas notation “**” means that there is not a significant difference between the data groups (ANOVA, P>0.01)
To further explore these results, a simplified energy balance was applied. The energy absorbed Eabs = Esensible + Elatent where Esensible is the energy needed to raise the temperature of the droplet from liquid nitrogen (−196 °C) to room temperature and Elatent is the energy required for phase change from ice to water. For a vitrified droplet such as 5M PG or 2M PG and 1M Trehalose, Elatent will be negligible, which makes Eabs = Esensible. However, for a crystallized sample, Eabs will be a sum of Esensible and Elatent, where the latter increases as a function of ice formation. For example, the Eabs for a 1 µL droplet of 5M PG was found to be 0.39 J. Comparing this with Esensible for a 1 µL droplet with properties of a vitrified material with density, ρ = 990 kg/m3, specific heat, C = 2000 J/Kg K, temperature difference ΔT = 220 K, Esensible =ρCVΔT= 0.40 J. Taking this into account, Eabs for the same CPA concentration should be the same across the two GNR concentrations as similar ice formation occurs in droplets with the same CPA concentration when cooled at the same rate. This explains the decreasing trend for Eabs for DI water, 1M and other PG groups as ice formation decreases across these groups. This is most dramatically illustrated when comparing Eabs for DI water of ~ 1 J (highest ice formation) which is considerably higher than 5M PG droplets (effectively no ice) at ~ 0.4 J.
Relationship between average laser energy and droplet volume
We then investigated the impact of increasing volume on the average laser energy needed to successfully rewarm transparent droplets of 2M PG and 1M Trehalose. Figure 5a shows the Eavg needed to rewarm droplets varying in volume from 0.25µL to 2µL with a fixed GNR concentration of 1.3 × 10¹⁷ nps/m3. The data suggests that there is a strong linear (R2 = 0.96) relationship between Eavg (J) and droplet volume V (µL), which can be written as Eavg = 1.5 * V. The energy absorption factor α can be found for each volume by using equation , and this is also shown in Figure 5a for respective volumes. The increasing trend in Eabs is expected as the energy needed to rewarm the droplets should increase with increase in volume. The value of α also increases with volume since there are more nanoparticles within the droplet to absorb the laser; however, the increase is not large enough to offset the energy requirement to rewarm the additional volume. Figure 5b shows the Eabs for droplets under the same conditions as Figure 5a, indicating a strong linear relationship (R2 = 0.99) between Eabs and droplet volume (V, µL) of Eabs = 0.5 * V. This is not unexpected based on the energy balance approach shown previously which suggests the energy needed should scale directly with volume.
Figure 5. Average laser energy needed to avoid ice crystallization for varying droplet volumes.
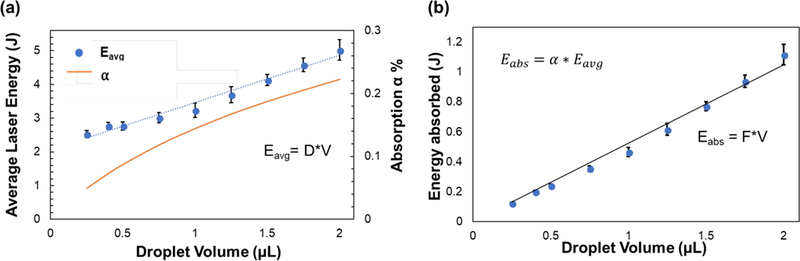
(a) Plot shows the average laser energy that led to successful rewarming (without ice formation) of varying droplet volumes with 2M PG + 1M Trehalose with a GNR concentration of 1.26 × 10¹⁷ nps/m3. The data suggests that there is a strong linear (R2= 0.96) relationship between average laser energy and droplet volume, where D = 1.5 J/µL. (b) Plot shows the amount of energy absorbed by the droplets under the same conditions as (a). The energy absorbed is calculated by using the energy absorption factor α (Figure 3b), which is 14.4%. The data suggests that there is a strong linear relationship (R2 = 0.99) between energy absorbed and droplet volume, where F= 0.5 J/µL. Energy balance for the droplet will show that energy absorbed equals the sensible energy (ρVCΔT) and latent energy (xice ρVHfusion). The error bars represent the standard error of the mean of laser energy that resulted in successful rewarming for both (a) and (b).
Modeling and experiments of droplet cooling
A finite element (FEM) heat transfer model was developed in COMSOL to analyze the possible cooling and warming scenarios for the CPA and GNR-laden microliter sized droplets. Figure 6a shows an image of 1µL droplet of 2M PG on a cryotop. The contact angle was measured as 83° ± 4° and was used to build the geometry of the droplet (Figure 6b) in COMSOL with a width of 1.65mm and height of 0.73mm. With assumed convective boiling conditions in liquid nitrogen (h = 9,000 W/m2 K, nucleate boiling32–33), the model yielded a cooling rate of 93,000 °C/min at the center of the droplet (Figure 6c). The modeling results indicate that the droplet would equilibrate with liquid nitrogen (−196°C) within 0.4s. This cooling rate from the modeling far exceeds the 23,900 °C/min required for vitrification of 3M PG15, but is far slower than 290,000 °C/min needed for 2M PG15 (See Figure 1), as experimentally validated (Figure 6d–e). We also used an Open Pulled Straw, which has a known cooling rate of 20,000 °C/min20, to experimentally test if either 2M, 2M PG and 1M Trehalose and 3M PG solutions (V=2µL) would vitrify when plunged in liquid nitrogen. As expected, the 2M solution did not vitrify, but interestingly, neither did the 3M PG solution. Only 2M PG and 1M Trehalose vitrified completely at 2 µL volumes. This further supported the argument that the CCR for 3M PG is over 20,000 °C/min. Since there are no good estimates for CCR for 2M PG and 1M Trehalose, we estimated 20,000 °C/min as the minimum rate needed for vitrification.
Figure 6. FEM Modeling of cooling with Cryotop.
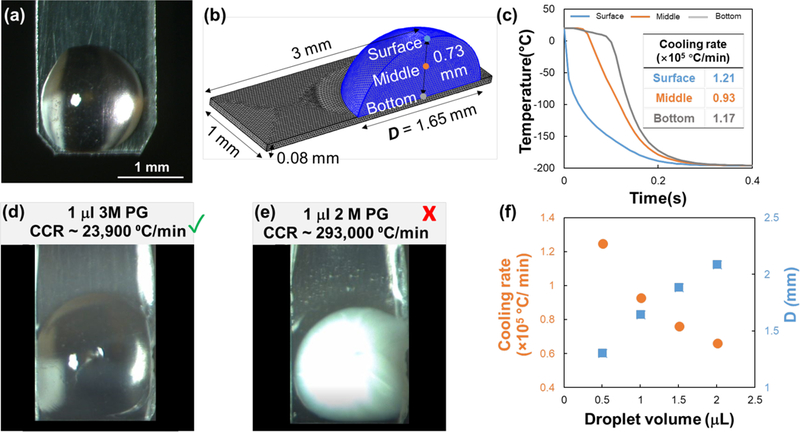
(a) Picture of 1 µL droplet on cryotop, with the measured contact angle being 83° ± 4°. (b) Geometry of the droplet and cryotop for COMSOL modeling. Three locations including “top”, “middle” and “bottom” in the droplet are selected to represent the spatial temperature distribution. (c) Cooling temperature profile and variable rates within a 1 µL droplet. The cooling rates are calculated between 0 and −140 °C, with the convective heat transfer coefficient set to 9,000 W/m2K. (d) Successful vitrification of 1 µl of 3M PG using cryotop, with the modelled cooling rate of the droplet exceeding the CCR of 3M PG. (e) Vitrification failure of 1 µL 2 M PG using cryotop, with the modelled cooling rate of the droplet below the CCR of 2 M PG. (f) Cooling rate at the middle of the droplet decreases with increasing droplet volume. Given that the maximum laser beam diameter is 2 mm, the maximum droplet volume is 1.8 µL such that the droplet diameter (Ddrop) is smaller than the width of the cryotop (i.e. 2 mm).
Figure 6f shows the cooling rates obtained via modeling for varying droplet volumes. The data shows that even the smallest volume of 0.5 µL couldn’t satisfy the cooling rates of 290,000 °C/min needed for 2M PG15 to vitrify. While both experimental and computational data suggests that droplets of 2M PG and 1M Trehalose and 3M PG with volume up to 2 µL can be vitrified with the cryotop, a 2 µL droplet forms a diameter larger than 2mm (spot size of the laser), so the maximum droplet volume that can be used for laser nanowarming should be 1.8 µL (Figure 6f). This is not a hard limit for the droplet volume, since there may be approaches to expand the beam size using either special lenses, filters, and/or obtaining a pulsed laser with larger beam size. Therefore, laser nanowarming of volumes > 1.8 µL may be possible in the future as long as the cells within the droplet have experienced survivable ice formation during cooling and the laser warming is sufficiently fast and uniform.
Modeling of laser warming of droplets
Next, we modeled the laser warming of 1µL droplets of 2M PG and 1M Trehalose with a GNR concentration of 1.3 × 10¹⁷ nps/m3 under different laser energy conditions. Figure 7a plots the temperature change at the surface, middle and bottom of the droplet over time using the same average laser energy conditions found in Figure 3a (250V and 1.6ms) that resulted in rewarming without ice formation. The image of the droplet inside the plot is representative of the droplet appearance after the laser pulse is fired. Figures 7b–c are two extreme cases showing temperature change within the droplet when the laser energy is lower (i.e. underheating (250V and 1ms)) and when the laser is higher than Eavg (i.e. overheating (250V and 2.5ms)). Figures 7d–f also show the temperature within the droplet for representative cases of successful warming under the same average laser energy conditions but for different pulse widths (1 ms, 5.3 ms and 14.5 ms). Control of the pulse width (range is 0.5ms to 30ms) along with appropriate power and GNR concentration selection allows rates from 400,000 °C/min to 27,000,000 °C/min to be explored. In addition, as GNR concentration increases, the temperature gradient within the droplet (i.e., between the top and bottom of the droplet) increases dramatically due to laser attenuation within the droplet (Figure S1).
Figure 7. FEM Modeling of laser nanowarming of 1 µL droplet with cryotop.
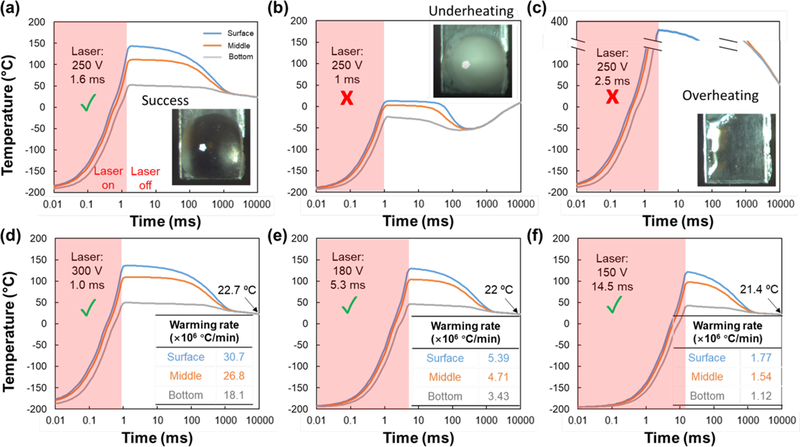
The CPA and GNR concentration is 2M PG + 1M Trehalose CPA and 1.26 ×10¹⁷ nps/m3, respectively. (a-c) Pulse laser settings, pictures, and spatial temperature profiles (model) for rewarming success, underheating, and overheating cases, respectively. (d-f) Different laser settings (i.e. voltage and pulse width) and spatial temperature profiles (model) using the same single total pulse energy (3.1 J). All plots share the same legend as (a).
Laser warming of droplets with Human Dermal Fibroblast cells
Figure 8a plots the viability of HDF cells post laser warming as a function of laser energy when warmed in 1µL droplets with 2M PG and two different concentrations of Trehalose (0.5M and 1M) and GNR (0.77 × 10¹⁷ np/m3 and 1.76 × 10¹⁷ np/m3). The highest average viability for 2M PG and 1M Trehalose group for GNR concentrations of 0.77 × 10¹⁷ np/m3 and 1.76 × 10¹⁷ np/m3 was 97% and 91% which occurred at laser energy of 5.4J and 1.9J, respectively. Just as expected, droplets with lower GNR concentration required higher amounts of energy per pulse for successful rewarming. This is also consistent with relationship shown in Fig. 3a, according to which Eavg needed to rewarm 1µL droplets of 2M PG and 1M Trehalose with two GNR concentrations would be 4.4J and 2.0J. Similarly, for the 2M PG and 0.5M Trehalose group for GNR concentrations of 0.77 × 10¹⁷ np/m3 and 1.76 × 10¹⁷ np/m3 the highest average cell viability was 85% and 83%, warmed at a laser energy of 3.0J and 6.2J, respectively. For both CPA concentrations, the lower GNR concentration led to higher average viability rate. This can be attributed to the larger thermal gradients that are created with higher GNR concentrations (See Fig. S1 in Supporting Information). Figure 8b plots the viability of HDF cells post laser warming as a function of warming rate when warmed in 1µL droplets of 2M PG and with three different concentrations of Trehalose (0M, 0.5M, and 1M) and a GNR concentration of 1.76 × 10¹⁷ np/m3. Based on our previous experiments, we were able to find the optimal laser energy needed to rewarm a certain size droplet containing a specific CPA and GNR concentration. By keeping the laser energy, the same, we were able to manipulate the warming rates (WRs) by increasing or decreasing the pulse width for these droplets. We estimated these rates by using this rough estimation: WR = 200°C/(Pulse Width). Inside the plot, there are images of rapidly cooled droplets just prior to laser warming, showing a 2M PG droplet completely crystalized, a 2M PG and 0.5M Trehalose droplet partially crystalized, and a 2M PG and 1M Trehalose with no crystallization. There is clear trend demonstrating the highest cell viability at the highest warming rate for each group. For the fully crystalized 2M PG group, the highest viability rate of 26% was seen at 12,000,000 °C/min, which was much lower compared to the other groups. Despite crystallization occurring within droplets of 2M PG and 0.5M Trehalose, the cell viability of 86% at 12,000,000 °C/min was like the cell viability of 91% for 2M PG and 1M Trehalose group. However, as the warming rate fell below 4,000,000 °C/min, there is sharp decline in cell viability across all PG groups. For warming rates between 1 and 4,000,000 °C/min cell viability was between 30% to 70%, and for rates lower than 1,000,000 °C/min cell viability fell below than 30%. Considering the cell viabilities, the threshold warming rates for 2M PG, 2M PG and 0.5M Trehalose and 2M PG and 1M Trehalose might be approximately 12,000,000, 4,000,000 and 1,700,000 °C/min, respectively. However, a more careful calorimetric analysis might be needed to state this more accurately.
Figure 8. Laser warming of 1 µL droplets with Human Dermal Fibroblast cells.
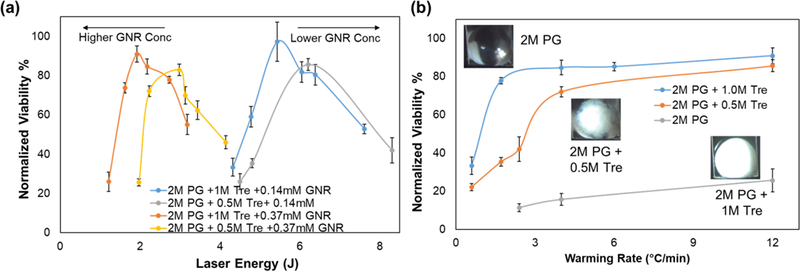
HDF cells in suspension were mixed with 2M PG and varying concentrations of Trehalose (0M, 0.5M and 1M) and GNR (0.14mM or 0.77 × 10¹⁷ np/m3 and 0.37mM or 1.76 × 10¹⁷ np/m3) for 3 min. 1 µL droplets of this cell solution with concentration of 10,000 cells/mL were cooled with the cryotop and then laser warmed under different laser conditions. The viability of the HDF cells was measured by using Trypan Blue assay post laser warming. The viability of HDF for the control group (mixed with PG and Trehalose but not laser warmed) was 85% and results here have been normalized to it. (a) The plot shows the relationship between laser energy and post laser warming viability rate of HDF cells for two different CPA and GNR concentrations. (b) The plot shows the relationship between warming rate and post laser warming viability rate of HDF cells for three different CPA conditions with the same GNR concentration of 0.37mM (1.76 × 10¹⁷ np/m3). At least 3 trials (100,000 cells/mL) were carried out for each condition, and the error bars here represents the standard error of mean viability rate.
The key finding from this experiment was that despite sub-optimal cooling which led to ice formation in 2M PG and 2M PG and 0.5M Trehalose droplets, cell viability was retained when a significantly high laser warming rate (> 10,000,000 °C/min) was used. This is an important finding since the conventional thinking in field of cryobiology has always been to avoid ice formation using faster cooling and/or high concentration CPAs. However, as the biomaterials become larger, faster cooling becomes harder to achieve and increasing CPA concentration may not be ideal due to toxicity concerns. Simply put, laser nanowarming can be a powerful new tool to help rescue biomaterials like zebrafish embryos (i.e. too big) and coral larvae (i.e. CPA sensitive) that cannot be cooled optimally without any ice formation. By providing ultra-rapid warming rates, laser nanowarming prevents any further damage by ice crystallization during rewarming.
Biomaterial size for extracellular vs intracellular warming
Using the FEM model, we were able to analyze the size constraints for biological specimens that can be rewarmed with the extracellular laser warming approach. Figure 9 plots the warming rates achieved inside biological samples (i.e. oocytes, embryos, islets) of varying diameters, Dcell, placed at the bottom of a 1µL droplet, with extracellular GNR concentration of 1.3 × 10¹⁷ nps/m3 and being irradiated with average laser energy conditions of 250V and 1.6ms (Eavg = 3.2J). To prevent crystallization, the warming at the center of the specimen must surpass CWR of 11,400,000 °C/min, 930,000 °C/min and 200,000 °C/min when using 2M PG, 3M PG and 2M PG and 1M Trehalose, respectively (Figure 1b). Using these rates as a threshold, droplets with 2M PG and 3M PG can’t prevent crystallization via extracellular warming for Dcell larger than 20 µm and 100 µm, respectively. Similarly, Dcell increases to 180 µm for a droplet with 2M PG and 1M Trehalose. The CWR are needed to avoid crystallization within droplets; however, each biomaterial may remain viable even when rewarmed at rates slightly lower than these. For example, Mazur’s laser warming work on 0.1 µL droplets still demonstrated high survival for 76% of mouse oocytes when rewarmed at 3,000,000 °C/min, compared to 93% survival rate for mice oocytes rewarmed at a rate of 10,000,000 °C/min using the same 2.3M CPA (a combination of ethylene glycol, Ficoll, etc)23. Additionally, the extracellular heating approach can work for larger specimens if the CPA concentration of the droplet is increased; however, this increases the risk of losing samples like embryos and oocytes due to toxicity. In contrast, the intra- and extra-cellular heating approach, i.e., GNRs present inside and outside the biomaterials, can produce ultrahigh warming rates (20,000,000 °C/min) regardless of the biomaterial size, provided that the GNRs are distributed uniformly throughout the droplet and biomaterials. In this case, low CPA concentration such as 2M PG can be used without crystallization during the rewarming process (Figure 9).
Figure 9. Modeling of warming rate for different sized biomaterial within a 1 µL droplet by extracellular laser warming.
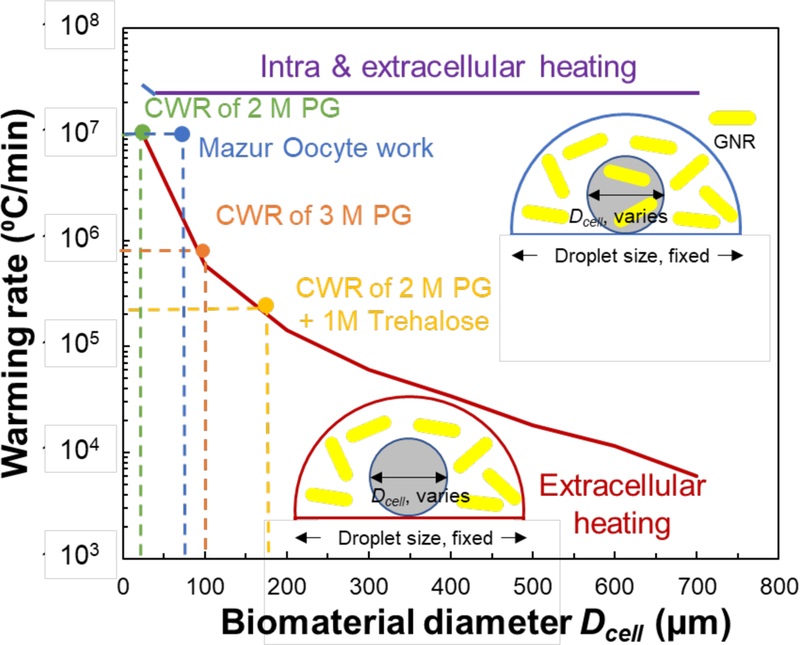
The GNR concentration is 1.26 × 10¹⁷ nps/m3 and laser settings are 250V and 1.6 ms pulse width. The warming rate reported here is from predictions at the center of the biomaterial. The CWRs for 2M PG and 3M PG are approximately 11,400,000 °C/min and 930,000° C/min, respectively. Mazur’s oocyte work with India Ink used a warming rate of 107 C/min is also shown23. Using an open pulled straw, we were able to find that the minimum cooling rate (CCR) to vitrify 2M PG and 1M Trehalose was 20,000 °C/min. Since there are no robust measurements in the literature, the CWR of 2M PG and 1M Trehalose can only be approximated as 200,000 °C/min (i.e. 10x CCR). The modeling results show that the maximum size of the biomaterial that can be rewarmed extracellularly is 180µm. While not ideal, increasing the concentration of CPA may help reduce the CWR needed and thus increase the threshold size of the biomaterial that can be rewarmed via extracellular laser warming. Comparatively, intra cellular laser warming can easily rewarm biomaterials up to 800µm; however, uniform GNR loading throughout the biomaterial can present its own challenges6.
Conclusion
Table 1 summarizes the physical conditions necessary for laser nanowarming including the concentration of nanoparticles and CPA, droplet volumes and laser energy conditions. We were able to show the ability of the cryotop to vitrify to up to 1.8µL droplets for 2M PG and 1M Trehalose, which is our ideal laser nanowarming CPA. Numerical modeling shows that the CCR and CWR of 20,000 °C/min and 200,000 °C/min can be achieved for our ideal (2M PG and 1M trehalose) droplet. In addition to using the visual analysis of droplets, by achieving over 90% viability for HDF cells post warming, we were able to test the ability of laser nanowarming quantitively by successfully rewarming droplets that were either vitrified or contained some ice. As visual analysis of ice crystallization within droplets is intrinsically qualitative, we have added a biological read-out based on % viability of HDF cells post warming to assess overall success. We hope in future studies, to add further metrics of ice formation within droplets using X-ray diffraction34, high speed video and/or other techniques. In addition, we hope to follow the same protocol we used to optimize the survival of HDF cells under different GNR loading and laser warming conditions for other systems like zebrafish embryos and pancreatic islets. Further, the model provides a size limit of 180 µm for biomaterials that can be rewarmed by extracellular means only. Compared to intracellular warming, extracellular warming reduces the need for complex loading procedures like microinjections of GNR used in our previous work with zebrafish embryos6. However, it limits the size of specimens that can be rewarmed without crystallization. In addition, extracellular warming creates thermal gradients across the droplet and encapsulated biomaterials which can be damaging, especially for larger samples and faster warming rates. When we compare devices such as the cryotop,19 Open Pulled Straw,20 Cryoloop35, Quartz Micro Capillary,21 and copper grids7 with recent laser warming approaches, we find that our laser nanowarming approach can provide the highest warming rates and largest volumes with CPA < 3M (Table 2). This technology has the potential to provide a platform to cryopreserve a wide variety of biomaterials ranging from microns to millimeters in size, thereby providing a new biomedical tool for cryopreservation, assisted reproduction, aquaculture, and biodiversity.
Table 1.
Physical conditions required for successful laser rewarming of gold nanorod impregnated droplets cooled with cryotop.
| Cryotop Cooling | ||
|---|---|---|
| Droplet volume (µL) | 0.1 ~ 1.8 | |
| Cooling rate (°C/min) | 66,000 ~ 210,000 | |
| PG concentration (M) | ≥ 2.0 | |
| Sugar additive (M) | 0.1 ~ 1.0 | |
| Laser warming | ||
| Extracellular heating | Intra & extracellular heating | |
| Laser pulse energy (J) | 2.0 ~ 6.0 | |
| GNR concentration (× 1017nps/m3) | 0.77 ~ 4.8 | |
| Pulse width (ms) | 0.5 ~ 30 | |
| Biomaterial diameter (µm)* | ≤ 180 | ≤ 2,000 |
| Warming rate (°C/min) | 70,000 ~ 20,000,000* | 400,000 ~ 20,000,000** |
The GNR concentration 1.26 × 10¹⁷ nps/m3 and laser settings 250V, 1.6 ms pulse width are used to obtain the warming rate and maximum specimen diameter with CCR set to 20,000 °C/min (see Table 2).
The warming rates are obtained by varying pulse width from 1 ms to 30 ms. A successfully rewarmed droplet remains clear and transparent (i.e. no ice crystallization occurs) whereas a failed droplet becomes cloudy (i.e. ice crystallization occurs)
Table 2.
Comparing the representative cooling and warming capabilities of existing cryopreservation approaches.
| Device | Sample Volume | System | Vitrification Solution | Cooling Rate °C/min | Warming Rate °C/min °C/min | Ref | |
|---|---|---|---|---|---|---|---|
| Traditional Straw | 250 µL | Bovine oocytes | 4M PG | 2,500 |  |
2,700 | 21 |
| Copper Grids | 0.5 µL | Bovine oocytes | 5.5 M EG & 1M sucrose | 3,000 | 3,500 | 7 | |
| Cryo-loop | 0.5 µL | Bovine oocytes, human oocytes | 0.65M sucrose, 2.8M DMSO &3.3M EG | 10,000 | 20,000 | 31 | |
| Open Pulled Straw | 2 µL | Bovine embryos | 3M PG | 22,500 | 35,000 | 20 | |
| Cryotop | 0.1 µL | Mouse oocytes | 7M EAFS** | 69,000 | 117,000 | 23 | |
| Quartz Micro-Capillary | 0.1 µL | Mouse oocytes | 2M PG & 0.5M Trehalose | 250,000* | 120,000* | 21 | |
| Cryotop + Laser Warming (India Ink) | 0.1 µL | Mouse oocytes | 2.3M EAFS** | 69000 | 10 million* | 23 | |
| Cryotop + Laser Warming (GNR) | 1 µL | Zebrafish embryos | 2.3M PG | 90,000* | 13 million* | 6 |
Cooling and warming rates presented were calculated by using FEM modeling.
EAFS vitrification solution is a mixture of ethylene glycol, acetamide, Ficoll, and sucrose. The preparation has been described in ref 23. Also note PG is Propylene glycol and EG is Ethylene Glycol.
Materials & Methods
Rapid cooling and laser warming of droplets
Rapid cooling and laser warming were performed as described by Khosla et al.6, with small modifications as shown in Figure 2. Instead of a zebrafish embryo, microliter-sized droplets with varying CPA and GNR concentrations were pipetted onto the 3.0 × 2.0 × 0.08 mm blade of a modified cryotop (Fig. 6a). A specially designed automated system was used to rapidly cool the droplets by plunging them into liquid nitrogen for at least 10 seconds to allow for equilibration to liquid nitrogen temperature (Fig. S4). For rewarming, a 1064nm Nd: YAG laser (iWeld 980 Series, 120 joule, LaserStar Technologies, FL, USA) was used to provide a high energy singular millisecond pulse. This laser is equipped with a stereomicroscope with an eyepiece crosshair reticule to allow for visualization and alignment of the specimen within the laser chamber, along with a phototube to record high speed video. Once the jig raises the cryotop into the laser’s focus, the laser is automatically fired. The energy provided by a single pulse can be varied by changing the input voltage and pulse time. A laser calibration table was generated using a laser power meter (Nova II, Ophir, Jerusalem, Israel) to determine the amount of energy in joules produced by the laser at a given voltage and pulse time (See Figure S3).
This entire process of cooling and laser warming droplets is captured by the camera. There are two distinct time points in the video which are used to observe ice formation during this process. The first is “prewarming” wherein the droplet is quickly raised into the laser’s focus from the liquid nitrogen; this transition takes less than 0.3s. For our purposes, a vitrified droplet appears transparent without any white spots, whereas ice formation in the droplet appears white or cloudy (either partially or completely). For example, a vitrified 1µL droplet of 2M PG and 1M Trehalose can be seen in Fig. 6d, and a crystalized 1µL droplet of 2M PG can be seen in Fig. 6e.
The second observation point is “post-warming,” wherein the droplet is seen immediately after the laser is fired. It should be noted that the video recording during the millisecond(s) of laser warming is blocked by a protective filter due to possible damage to the camera. Our physical definition of success is that the droplet remains clear, i.e. without the appearance of ice post laser warming. A first warming failure mode we term crystallization exists when the droplet shows ice (white spots) due to underheating because the laser energy was too low to completely rewarm the droplet to its melting temperature. A second failure mode exists if the droplet disappears or get damaged if the laser energy exceeds the rewarming threshold. Examples of all three cases can be seen in Figures 7a–c. For each laser warming case, the voltage and pulse width were varied until there was no ice formation within the droplet during rewarming (n=5). For example, a laser pulse with voltage of 250V and pulse width of 1.6ms successfully rewarmed a vitrified 1µL droplet with 2M PG, 1M Trehalose and 1.26×10¹⁷ nps/m3 GNR. This technique was used to obtain the laser energy conditions for physical success at different GNR concentrations, CPA concentrations, and droplet volumes.
Laser warming of droplets with Human Dermal Fibroblasts
Standard techniques can be used to cryopreserve these HDF cells, but for our technique to be valid and translatable, we use HDF cells as a model to test experimental conditions needed for biological success of laser nanowarming. The cells were cultured by standard methods in our lab36 and suspended in culture medium. To prepare test samples, the HDF cells were mixed with 2M PG and varying concentrations of Trehalose (0M, 0.5M and 1M) and GNR (N = 0.77 × 10¹⁷ np/m3 and 1.76 × 10¹⁷ np/m3) for at least 3min. Using the same protocol described earlier, 1 µL droplets with a cell concentration of 100,000 cells/mL were frozen with the cryotop and then laser warmed at various laser energy and pulse width conditions. After each warming trial, the laser warmed droplets mixed with 1M PG solution. After performing at least 10 trials for each different CPA, GNR, and laser warming condition, the cells were washed with PBS to remove PG. It should be noted that cell solutions were kept on ice before and after laser warming until cell viability was evaluated. To measure viability post laser warming, the cells were first concentrated by centrifugation and the majority of supernatant was removed. After which the cell solutions were mixed with Trypan Blue (Sigma Aldrich T8154) in a 1:1 ratio and placed inside the Cell Counter (Countless, Thermo Fisher Scientific) to evaluate cell viability, following a similar to the protocol established in literature37.
Model to study rapid cooling and laser warming
The MCA-3 (Kyowa Interface Science, Japan) was used to measure the contact angle of 1 µL droplets when pipetted onto the blade of a cryotop (polypropylene). It was found to be 83° ± 4° and was used to model the dimensions of a 1 µl droplet on cryotop. The geometries of the droplet and cryotop were then used to construct a geometric model of the droplet in COMSOL as shown in Figure 5b. Considering symmetry, only half of the droplet was used in the model, with the height of the droplet 0.73 mm, the diameter of the contact area between the droplet and cryotop 1.65 mm, and the dimensions of the cryotop 3mm x 1mm x 0.08mm. Constant properties of the cryotop were used in the model with density 1040 kg/m3, thermal conductivity 0.033 W/mK and specific heat 1300 J/kgK. Due to the lack of specific measurement of 2M PG and trehalose, the droplet was assigned temperature-dependent thermal properties of 2M Glycerol in Phosphate-buffered saline from published measurements6, 38.
The governing equation used to solve the cooling temperature profile is
where T is the temperature (K), ρ is the density (kg/m3), c is the specific heat (J/kg/K), and k is the thermal conductivity (W/m2K). The initial temperature was 293 K, and ambient temperature was set to 77 K. We then assumed the boundary condition to the entire surface of the droplet and cryotop was governed by convection with a heat transfer coefficient of 9,000 W/m2K. This value is consistent, but on the high end of recorded values (1,000 – 10,000 W/m2K)33 in literature as we are plunging the sample32. Three locations within the droplet – including “surface”, “middle”, and “bottom” – are selected to represent the spatial temperature distribution as shown in Figure 5b. The temperature range to calculate the cooling rate is −140 °C ~ 0 °C.
The governing equation used to solve the warming temperature profile is
where I0 (x, y) is the Gaussian distribution of the laser intensity (W/m2), Cabs and Cext are the absorption and extinction cross section area of GNR, z is distance travelled vertically by the laser, and N is the number density of GNR (nps/m3). The heat source term “SAR” is only applied in the droplet volume with selected pulse width, since the cryotop is transparent to 1064 nm laser39. In addition, convective heat transfer with surroundings (293 K) is applied at the surface with the heat transfer coefficient 100 W/m2K. To model the warming rate for different-sized specimens with extracellular warming, the droplet size is fixed to be 1 µL and the biomaterial is assumed to be a sphere placed on the surface of the cryotop as shown in Figure 6. The heat source term “SAR” is only applied outside the specimen, and the warming rate at the center of the specimen is reported. The temperature range to calculate the cooling rate is −140 °C ~ 0 °C, since the possibility of crystallization is highest in this range.
Supplementary Material
Acknowledgments
We thank Dr. Bing Luo and the Characterization Facility Center at the University of Minnesota for use of the contact angle meter. We also thank Dr. Steve Oldenburg and Dr. Aaron Saunders from nanoComposix, Inc. for providing the gold nanoparticles used in this study.
Funding Sources
This work was supported by NIH R41 OD024430–01, Kuhrmeyer Chair, Institute for Engineering in Medicine at University of Minnesota to JB. This work was also supported by the Anela Kolohe Foundation, the Cedarhill Foundation, the Skippy Frank Translational Medicine Fund, the Roddenberry Foundation, the Paul M. Angell Family Foundation, the Hawaii Institute of Marine Biology, and the Smithsonian Institution to MH.
Footnotes
Supporting Information
In the supporting information section, readers will find more information on the characterization of laser and GNR. We also have cases for temperature change inside the droplet for more GNR concentrations along with the image of the cryojig, details of which can be provided on request.
References
- 1.Fahy GM; MacFarlane DR; Angell CA; Meryman HT Vitrification as an Approach to Cryopreservation. Cryobiology 1984, 21, 407–426. [DOI] [PubMed] [Google Scholar]
- 2.Lewis JK; Bischof JC; Braslavsky I; Brockbank KGM; Fahy GM; Fuller BJ; Rabin Y; Tocchio A; Woods EJ; Wowk BG; Acker JP; Giwa S The Grand Challenges of Organ Banking: Proceedings from the First Global Summit on Complex Tissue Cryopreservation. Cryobiology 2016, 72, 169–182. [DOI] [PubMed] [Google Scholar]
- 3.Fahy G; MacFarlane D; Angell C; Meryman H Vitrification as an Approach to Cryopreservation. Cryobiology 1984, 21, 407–426. [DOI] [PubMed] [Google Scholar]
- 4.Rall W; Fahy G Ice-Free Cryopreservation of Mouse Embryos at− 196 C by Vitrification 1985. [DOI] [PubMed]
- 5.Hagedorn M; Kleinhans F; Artemov D; Pilatus U Characterization of a Major Permeability Barrier in the Zebrafish Embryo. Biology of reproduction 1998, 59, 1240–1250. [DOI] [PubMed] [Google Scholar]
- 6.Khosla K; Wang Y; Hagedorn M; Qin Z; Bischof J Gold Nanorod Induced Warming of Embryos from the Cryogenic State Enhances Viability. ACS nano 2017, 11, 7869–7878. [DOI] [PubMed] [Google Scholar]
- 7.Martino A; Songsasen N; Leibo S Development into Blastocysts of Bovine Oocytes Cryopreserved by Ultra-Rapid Cooling. Biology of Reproduction 1996, 54, 1059–1069. [DOI] [PubMed] [Google Scholar]
- 8.Boutron P; Kaufmann A Stability of the Amorphous State in the System Water—1, 2-Propanediol. Cryobiology 1979, 16, 557–568. [DOI] [PubMed] [Google Scholar]
- 9.Boutron P; Delage D; Roustit B; Körber C Ternary Systems with 1, 2-Propanediol— a New Gain in the Stability of the Amorphous State in the System Water-1, 2-Propanediol-1-Propanol. Cryobiology 1982, 19, 550–564. [DOI] [PubMed] [Google Scholar]
- 10.Baudot A; Alger L; Boutron P Glass-Forming Tendency in the System Water–Dimethyl Sulfoxide. Cryobiology 2000, 40, 151–158. [DOI] [PubMed] [Google Scholar]
- 11.Boutron P; Kaufmann A Stability of the Amorphous State in the System Water-Glycerol-Dimethylsulfoxide. Cryobiology 1978, 15, 93–108. [DOI] [PubMed] [Google Scholar]
- 12.Boutron P More Accurate Determination of the Quantity of Ice Crystallized at Low Cooling Rates in the Glycerol and 1,2-Propanediol Aqueous Solutions: Comparison with Equilibrium. Cryobiology 1984, 21, 183–191. [DOI] [PubMed] [Google Scholar]
- 13.Boutron P; Mehl P; Kaufmann A; Angibaud P Glass-Forming Tendency and Stability of the Amorphous State in the Aqueous Solutions of Linear Polyalcohols with Four Carbons. Cryobiology 1986, 23, 453–469. [DOI] [PubMed] [Google Scholar]
- 14.Baudot A; Boutron P Glass-Forming Tendency and Stability of Aqueous Solutions of Diethylformamide and Dimethylformamide. Cryobiology 1998, 37, 187–199. [DOI] [PubMed] [Google Scholar]
- 15.Tucker M; Liebermann J Vitrification in Assisted Reproduction: A User’s Manual and Trouble-Shooting Guide CRC Press: 2007. [Google Scholar]
- 16.Boutron P; Mehl P Theoretical Prediction of Devitrification Tendency: Determination of Critical Warming Rates without Using Finite Expansions. Cryobiology 1990, 27, 359–377. [DOI] [PubMed] [Google Scholar]
- 17.Hopkins JB; Badeau R; Warkentin M; Thorne RE Effect of Common Cryoprotectants on Critical Warming Rates and Ice Formation in Aqueous Solutions. Cryobiology 2012, 65, 169–178. [DOI] [PMC free article] [PubMed] [Google Scholar]
- 18.Sutton RL Critical Cooling Rates to Avoid Ice Crystallization in Solutions of Cryoprotective Agents. Journal of the Chemical Society, Faraday Transactions 1991, 87, 101. [Google Scholar]
- 19.Kuwayama M; Vajta G; Kato O; Leibo SP Highly Efficient Vitrification Method for Cryopreservation of Human Oocytes. Reproductive BioMedicine Online 2005, 11, 300–308. [DOI] [PubMed] [Google Scholar]
- 20.Vajta G; Holm P; Kuwayama M; Booth PJ; Jacobsen H; Greve T; Callesen H Open Pulled Straw (Ops) Vitrification: A New Way to Reduce Cryoinjuries of Bovine Ova and Embryos. Molecular reproduction and development 1998, 51, 53–58. [DOI] [PubMed] [Google Scholar]
- 21.He X; Park EY; Fowler A; Yarmush ML; Toner M Vitrification by Ultra-Fast Cooling at a Low Concentration of Cryoprotectants in a Quartz Micro-Capillary: A Study Using Murine Embryonic Stem Cells. Cryobiology 2008, 56, 223–232. [DOI] [PMC free article] [PubMed] [Google Scholar]
- 22.Mazur P; Seki S Survival of Mouse Oocytes after Being Cooled in a Vitrification Solution to− 196 C at 95 to 70,000 C/Min and Warmed at 610 to 118,000 C/Min: A New Paradigm for Cryopreservation by Vitrification. Cryobiology 2011, 62, 1–7. [DOI] [PMC free article] [PubMed] [Google Scholar]
- 23.Jin B; Kleinhans F; Mazur P Survivals of Mouse Oocytes Approach 100% after Vitrification in 3-Fold Diluted Media and Ultra-Rapid Warming by an Ir Laser Pulse. Cryobiology 2014, 68, 419–430. [DOI] [PMC free article] [PubMed] [Google Scholar]
- 24.Peyridieu J; Baudot A; Boutron P; Mazuer J; Odin J; Ray A; Chapelier E; Payen E; Descotes J Critical Cooling and Warming Rates to Avoid Ice Crystallization in Small Pieces of Mammalian Organs Permeated with Cryoprotective Agents. Cryobiology 1996, 33, 436–446. [DOI] [PubMed] [Google Scholar]
- 25.Seki S; Mazur P The Dominance of Warming Rate over Cooling Rate in the Survival of Mouse Oocytes Subjected to a Vitrification Procedure. Cryobiology 2009, 59, 75–82. [DOI] [PMC free article] [PubMed] [Google Scholar]
- 26.Dreaden EC; Alkilany AM; Huang X; Murphy CJ; El-Sayed MA The Golden Age: Gold Nanoparticles for Biomedicine. Chemical Society Reviews 2012, 41, 2740–2779. [DOI] [PMC free article] [PubMed] [Google Scholar]
- 27.Shukla R; Bansal V; Chaudhary M; Basu A; Bhonde RR; Sastry M Biocompatibility of Gold Nanoparticles and Their Endocytotic Fate inside the Cellular Compartment: A Microscopic Overview. Langmuir 2005, 21, 10644–10654. [DOI] [PubMed] [Google Scholar]
- 28.Lipka J; Semmler-Behnke M; Sperling RA; Wenk A; Takenaka S; Schleh C; Kissel T; Parak WJ; Kreyling WG Biodistribution of Peg-Modified Gold Nanoparticles Following Intratracheal Instillation and Intravenous Injection. Biomaterials 2010, 31, 6574–6581. [DOI] [PubMed] [Google Scholar]
- 29.De Jong WH; Hagens WI; Krystek P; Burger MC; Sips AJ; Geertsma RE Particle Size-Dependent Organ Distribution of Gold Nanoparticles after Intravenous Administration. Biomaterials 2008, 29, 1912–1919. [DOI] [PubMed] [Google Scholar]
- 30.Daly J; Zuchowicz N; Lendo CIN; Khosla K; Lager C; Henley EM; Bischof JC; Kleinhans FW; Lin C; Peters E; Hagedorn M Successful Cryopreservation of Coral Larvae Using Vitrification and Laser Warming 2018. [DOI] [PMC free article] [PubMed]
- 31.Phatak S; Natesan H; Choi J; Brockbank KG; Bischof JC Measurement of Specific Heat and Crystallization in Vs55, Dp6, and M22 Cryoprotectant Systems with and without Sucrose. Biopreservation and Biobanking [DOI] [PubMed]
- 32.Flynn T; Draper J; Roos J The Nucleate and Film Boiling Curve of Liquid Nitrogen at One Atmosphere. In Advances in Cryogenic Engineering, Springer: 1962, pp 539–545. [Google Scholar]
- 33.Jiao A; Han X; Critser JK; Ma H Numerical Investigations of Transient Heat Transfer Characteristics and Vitrification Tendencies in Ultra-Fast Cell Cooling Processes. Cryobiology 2006, 52, 386–392. [DOI] [PubMed] [Google Scholar]
- 34.Anzar M; Grochulski P; Bonnet B Synchrotron X-Ray Diffraction to Detect Glass or Ice Formation in the Vitrified Bovine Cumulus-Oocyte Complexes and Morulae. PloS one 2014, 9, e114801. [DOI] [PMC free article] [PubMed] [Google Scholar]
- 35.Lane M; Bavister BD; Lyons EA; Forest KT Containerless Vitrification of Mammalian Oocytes and Embryos. Nature biotechnology 1999, 17, 1234. [DOI] [PubMed] [Google Scholar]
- 36.Shah NB; Dong J; Bischof JC Cellular Uptake and Nanoscale Localization of Gold Nanoparticles in Cancer Using Label-Free Confocal Raman Microscopy. Molecular pharmaceutics 2010, 8, 176–184. [DOI] [PubMed] [Google Scholar]
- 37.Louis KS; Siegel AC Cell Viability Analysis Using Trypan Blue: Manual and Automated Methods. In Mammalian Cell Viability, Springer: 2011, pp 7–12. [DOI] [PubMed] [Google Scholar]
- 38.Choi J; Bischof JC Review of Biomaterial Thermal Property Measurements in the Cryogenic Regime and Their Use for Prediction of Equilibrium and Non-Equilibrium Freezing Applications in Cryobiology. Cryobiology 2010, 60, 52–70. [DOI] [PMC free article] [PubMed] [Google Scholar]
- 39.Kleinhans F; Mazur P Physical Parameters, Modeling, and Methodological Details in Using Ir Laser Pulses to Warm Frozen or Vitrified Cells Ultra-Rapidly. Cryobiology 2015, 70, 195–203. [DOI] [PMC free article] [PubMed] [Google Scholar]
Associated Data
This section collects any data citations, data availability statements, or supplementary materials included in this article.