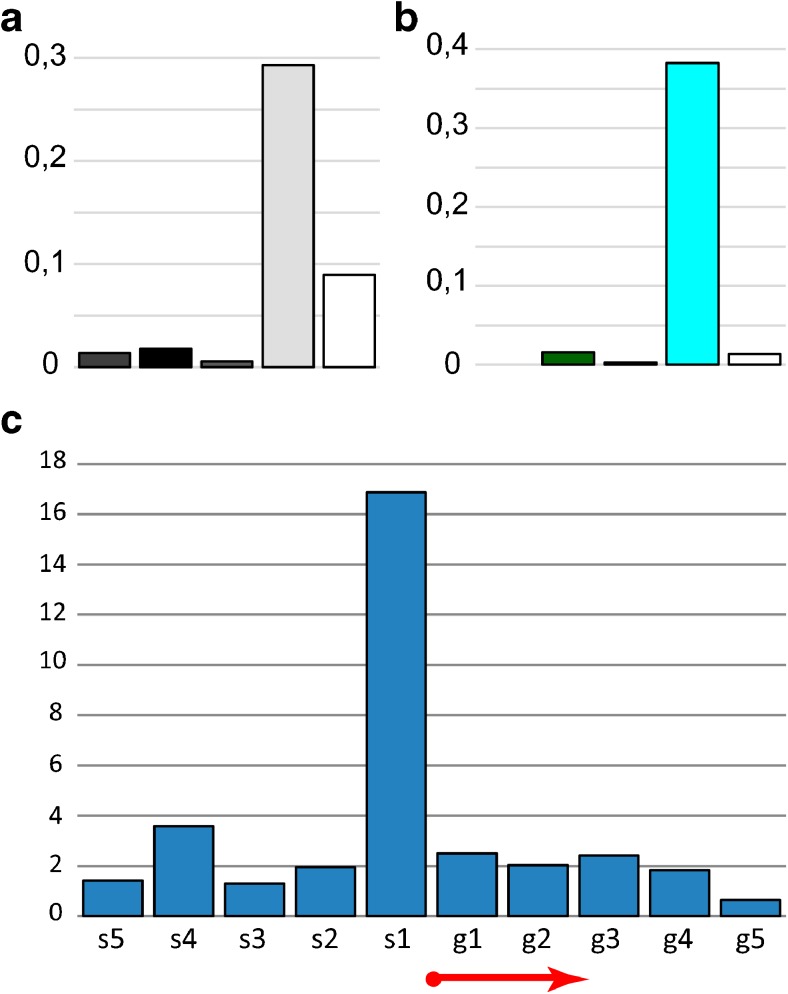
Fig. 14.
Distribution of the DNaseI hypersensitivity sites (DHS): a in the cytological structures of the fourth chromosome, with the first column corresponding to all the bands of the fourth chromosome, and further—as shown in Fig. 2b; b in the four chromatin types of the fourth chromosome. The ordinate shows the density in pcs/kb. с DHS distribution (modENCODE data) in S2 cells relative to genes beginning in the interbands of the fourth chromosome. The interbands are divided into fragments of 200 bp from the beginning of the gene towards the intergenic spacer (s1–s5) and towards the structural part of the gene (g1–g5); the genes are aligned with respect to the beginning. The graph shows five fragments in each direction. The ordinate shows the total number of sites in these fragments, normalized by the number of the gene transcripts. The red arrow shows the start and direction of the genes.

