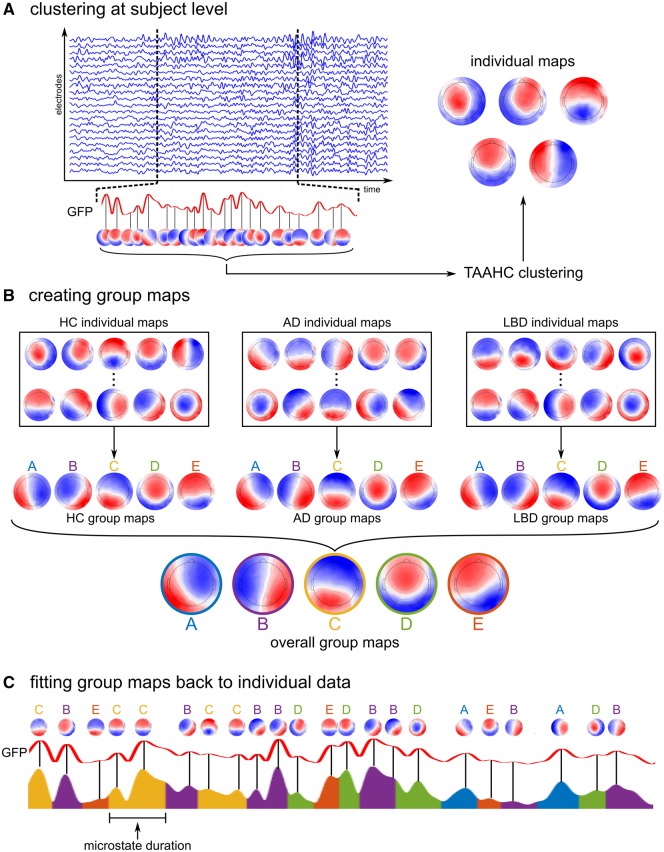
Figure 1.
Microstate analysis methods. (A) For each subject, data at global maxima of the GFP are clustered using the TAAHC algorithm to obtain individual microstate maps. (B) The individual maps are combined to obtain group maps within each clinical group using a permutation algorithm. (C) Group maps are fit back to the data at GFP peaks assigning each GFP peak to the microstate class with the highest topographical correlation. Microstates in-between GFP peaks are interpolated. AD = Alzheimer’s disease; HC = healthy controls; LBD = Lewy body dementia; TAAHC = topographic atomize and agglomerate hierarchical clustering.

