

Abstract
Treatment‐free remission (TFR) by tyrosine kinase inhibitors (TKI) discontinuation in patients with deep molecular response (DMR) is a paramount goal in the current chronic myeloid leukemia (CML) therapeutic strategy. The best DMR level by real‐time quantitative PCR (RT‐qPCR) for TKI discontinuation is still a matter of debate. To compare the accuracy of digital PCR (dPCR) and RT‐qPCR for BCR‐ABL1 transcript levels detection, 142 CML patients were monitored for a median time of 24 months. Digital PCR detected BCR‐ABL1 transcripts in the RT‐qPCR undetectable cases. The dPCR analysis of the samples, grouped by the MR classes, revealed a significant difference between MR4.0 and MR4.5 (P = 0.0104) or MR5.0 (P = 0.0032). The clinical and hematological characteristics of the patients grouped according to DMR classes (MR4.0 vs MR4.5‐5.0) were superimposable. Conversely, patients with dPCR values <0.468 BCR‐ABL1 copies/µL (as we previously described) showed a longer DMR duration (P = 0.0220) and mainly belonged to MR4.5‐5.0 (P = 0.0442) classes compared to patients with higher dPCR values. Among the 142 patients, 111 (78%) discontinued the TKI treatment; among the 111 patients, 24 (22%) lost the MR3.0 or MR4.0. RT‐qPCR was not able to discriminate patients with higher risk of MR loss after discontinuation (P = 0.8100). On the contrary, according to dPCR, 12/25 (48%) patients with BCR‐ABL1 values ≥0.468 and 12/86 (14%) patients with BCR‐ABL1 values <0.468 lost DMR in this cohort, respectively (P = 0.0003). Treatment‐free remission of patients who discontinued TKI with a dPCR <0.468 was significantly higher compared to patients with dPCR ≥ 0.468 (TFR at 2 years 83% vs 52% P = 0.0017, respectively). In conclusion, dPCR resulted in an improved recognition of stable DMR and of candidates to TKI discontinuation.
Keywords: chronic myeloid leukemia, digital PCR (dPCR), minimal residual disease (MRD) monitoring, treatment‐free remission (TFR), tyrosine kinase inhibitors (TKI) discontinuation
1. INTRODUCTION
Therapy with tyrosine kinase inhibitors (TKI) changed the fate of chronic myeloid leukemia (CML). Two decades after the introduction of imatinib (IM), the life expectancy of CML patients treated with TKI has approached to that of the general population1 and, now, the new objectives are focused on improving the management of the disease and, possibly, the quality of life of the patients.2, 3, 4
The current policy of CML therapy with TKI is to achieve a faster major molecular response (MMR or MR3.0 = BCR‐ABL1/ABL1 IS ≤0.1%) to prevent the progression to blastic phase and to obtain a deep molecular response (DMR or MR4.0 if ≤0.01% BCR‐ABL1/ABL1 %IS, or MR4.5 if ≤0.0032% BCR‐ABL1/ABL1 %IS or MR5.0 if ≤0.001 BCR‐ABL1/ABL1 %IS) to gain the opportunity of a treatment discontinuation.5
The results from the Stop IMatinib (STIM) and TWISTER pivotal trials challenged the rule that TKI therapy should be continued lifelong. Since then, both IM6, 7, 8 and second‐generation TKI discontinuation studies9, 10 confirmed that about 50‐60% of patients with a DMR can successfully stop TKI, achieving a treatment‐free remission (TFR). These important clinical trials demonstrated that TKI discontinuation did not cause CML‐related deaths and, moreover, molecular relapses are still sensitive to therapy resumption.11, 12
As mentioned above, TFR is one of the most important objectives in CML patients, and recently, TKI discontinuation has become a reality also in clinical practice. In fact, in June 2017, the European Society of Medical Oncology (ESMO) introduced the option of TKI interruption out of the clinical trials too.13 However, patients’ inclusion criteria for discontinuation such as the prognostic score, the overall duration of TKI treatment, the “stable” DMR and the levels of DMR are still matters of debate. Therefore, the TKI discontinuation strategy cannot be considered as optimized in this setting. Clinically relevant questions were addressed also by the French CML Study Group, which recently published the recommendations on discontinuation of TKI in CML for clinical practice.12 They remark the importance of determining the best level of DMR for TKI discontinuation. Clinical evidences unexpectedly highlight the absence of a linear correlation between the depth of the DMR, quantified following the IS, and the TFR maintenance rate. One of the causes could be related to the intrinsic limitations of real‐time quantitative PCR (RT‐qPCR), particularly concerning its lack of precision, especially in the quantification of the low levels of the target, and the variation of its sensitivity from one test to another.14, 15
For these reasons, the great majority of patients who undergo TKI discontinuation frequently have a DMR with undetectable levels of BCR‐ABL1 transcript by RT‐qPCR, Overall, according to the published data, 50%‐60% of patients with undetectable DMR by RT‐qPCR are expected to lose the DMR.16, 17, 18, 19
Therefore, the RT‐qPCR cannot be considered as an optimal tool neither to select the best candidates for treatment discontinuation nor to design personalized treatment programs, especially in the era of the more potent second‐generation TKI.
In the last years, the digital PCR (dPCR) has emerged as a more sensitive and accurate detection tool of minimal residual disease (MRD) and this increased the interest for its use in the clinical practice.20, 21, 22 The dPCR provides an absolute target sequence quantity, and recently, the alignment of the methods for BCR‐ABL1 transcript quantification by using the Qx100/Qx200 Droplet Digital PCR System (Biorad) and the QuantStudio 3D Digital PCR System (Thermofisher) has been accomplished.23
Although the dPCR is not yet routinely applied for the standard analysis of molecular MRD in CML, preliminary data suggest that it is more sensitive and accurate than RT‐qPCR for monitoring the BCR‐ABL1 transcript levels and, possibly, for predicting the patients who are going to relapse after discontinuation of TKI.24
This study focused on the MRD RT‐qPCR/dPCR comparative monitoring in 142 CML patients treated with TKI and with durable DMR (>2 years), as conventionally assessed by RT‐qPCR, before the enrollment.
The aim of this study was to evaluate the reliability and the efficiency of dPCR for a better evaluation of “stable” DMR and for a better selection of the candidates for treatment discontinuation.
2. METHODS
2.1. Patients
In total, 142 CML patients treated with TKIs (IM, nilotinib [NIL], or dasatinib [DAS]) for a median of 99 months (range 14‐215) and with durable (≥2 years) RT‐qPCR DMR (median 71 months; range 24‐171) were enrolled into the study, approved by the Ethical Committee of each participating Center. The patients were recruited by 10 Italian Hematologic Centers belonging to the CML GIMEMA (Gruppo Italiano Malattie Ematologiche dell'Adulto) Working Party. The clinical and hematological features of the patients, at the time of the enrollment, included: age, type of BCR‐ABL1 transcript, Sokal risk distribution at diagnosis, the first‐ and second‐line TKI treatment, treatment dosage and duration, time to complete cytogenetic response (CCyR), MMR, DMR, and best molecular response (MR).
Table 1 reports the cohort's characteristics according to DMR class at the time of the enrollment into the study. Of the 142 cases, 116 (82%) had more than 24 months of DMR when they were enrolled and started (Time point 0) to be comparatively evaluated by the conventional RT‐qPCR and dPCR (RT‐qPCR/dPCR).
Table 1.
Clinical and hematological characteristics of 142 Ph + CML patients with stable DMR comparatively monitored by RT‐qPCR and dPCR grouped in MR class by RT‐qPCR (MR4.0 vs MR4.5‐5.0) and by dPCR (≥ or <0.468 copies/µL) at enrollment
| Variable | RT‐qPCR | dPCR | |||||
|---|---|---|---|---|---|---|---|
| Total (n = 142) | MR4.0(n = 60) (42%) | MR4.5‐5.0 (n = 82) (58%) | P‐value | dPCR at enrollment ≥0.468 copies/µL (n = 31) (22%) | dPCR at enrollment <0.468 copies/µL (n = 111) (78%) | P‐value | |
| M/F | 82/60 | 36/24 | 46/36 | 0.6419 | 17/14 | 65/46 | 0.7108 |
| Median age (range) | 53 (20‐80) y | 52.5 (22‐80) y | 53 (20‐80) y | 0.9763 | 53 (22‐77) y | 53 (20‐80) y | 0.6710 |
| BCR‐ABL transcript at diagnosis | |||||||
| B3A2 | 84 (59%) | 35 (58%) | 49 (60%) | 0.6978 | 17 (55%) | 67 (60%) | 0.5731 |
| B2A2 | 53 (37%) | 24 (40%) | 29 (35%) | 14 (45%) | 39 (35%) | ||
| B2A2/B3A2 | 4 (3%) | 1 (2%) | 3 (4%) | — | 4 (4%) | ||
| NA | 1 (1%) | — | 1(1%) | — | 1(1%) | ||
| Sokal | |||||||
| L | 63 (44%) | 24 (40%) | 39 (48%) | 0.5074 | 16 (52%) | 47 (42%) | 0.8358 |
| I | 52 (37%) | 24 (40%) | 28 (34%) | 10 (32%) | 42 (38%) | ||
| H | 22 (15%) | 11 (18%) | 11(13%) | 4 (13%) | 18 (16%) | ||
| NA | 5 (4%) | 1 (2%) | 4 (5%) | 1 (3%) | 4 (4%) | ||
| 1st line TKI | |||||||
| IM | 108 (76%) | 49 (82%) | 59 (72%) | 0.4460 | 23 (74%) | 85 (77%) | 0.7372 |
| NIL | 28 (20%) | 10 (17%) | 18 (22%) | 6 (19%) | 22 (20%) | ||
| DAS | 5 (3.5%) | 1 (1%) | 4 (5%) | 2 (7%) | 3 (3%) | ||
| BOS | 1 (0.5%) | — | 1 (1%) | — | 1 (1%) | ||
| 1st TKI median dose (range) | |||||||
| IM | 400 (300‐800) | 400 (400‐800) | 400(300‐800) | 1.0000 | 400 (400‐800) | 400 (300‐800) | 1.0000 |
| NIL | 400 (300‐800) | 400 (400‐600) | 400(300‐800) | 400 (400‐600) | 400 (300‐800) | ||
| DAS | 100 (100‐100) | 100 (100‐100) | 100(100‐100) | 100 (100‐100) | 100 (100‐100) | ||
| BOS | 500 (500‐500) | — | 500 (500‐500) | — | 500 (500‐500) | ||
| Shift to second‐line TKI | 31 (22%) | 17 (28%) | 14 (17%) | 0.4664 | 7 (23%) | 24 (22%) | 0.8051 |
| NIL | 18 (58%) | 9 (53%) | 9 (64%) | 5 (71%) | 13 (54%) | ||
| DAS | 11 (36%) | 7 (41%) | 4 (29%) | 2 (29%) | 9 (38%) | ||
| IM | 1 (3%) | — | 1 (7%) | — | 1 (4%) | ||
| BOS | 1 (3%) | 1 (6%) | — | 1 (4%) | |||
| Duration of TKIs treatment | 99 (14‐215) m | 98 (19‐215) m | 100(14‐188) m | 0.5272 | 99 (26‐199) m | 99 (14‐215) m | 0.7184 |
| Time to CcgR | |||||||
| 3 mo | 75 (53%) | 34 (57%) | 41 (41%) | 0.1732 | 14 (45%) | 61 (55%) | 0.2819 |
| 6 mo | 34 (24%) | 14 (23%) | 20 (24%) | 9 (29%) | 25 (23%) | ||
| 12 mo | 12 (9%) | 2 (3%) | 10 (12%) | 2 (7%) | 10 (9%) | ||
| NA | 6 (4%) | 4 (7%) | 2 (2%) | 3 (10%) | 3 (3%) | ||
| Time to MMR | 6 (2‐112) m | 6 (2‐112) m | 6(2‐83) m | 0.3879 | 6 (2‐40) m | 6 (2‐112) m | 0.9773 |
| Time to DMR | 12 (3‐120) m | 23 (3‐120) m | 12 (3‐119) m | 0.2678 | 12 (3‐78) m | 13 (3‐120) m | 0.6211 |
| Time to best MR | 48 (2‐172) m | 59 (2‐162) m | 42 (5‐172) m | 0.1762 | 53 (3‐140) m | 46 (2‐172) m | 0.9180 |
| DMR duration (overall) | 71 (24‐171) m | 79 (24‐171) m | 65 (24‐164) m | 0.1314 | 50 (24‐144) m | 76 (24‐171) m | 0.0220 |
| MR at first dPCR | — | ||||||
| MR4.0 total | 60 | — | — | 18 | 42 | 0.0442 | |
| MR4.0 undetectable | 32 (42%) | 10 (58%) | 22 (38%) | ||||
| MR4.5‐5.0 total | 82 | 13 | 69 | ||||
| MR4.5‐5.0 undetectable | 54 (58%) | 11 (42%) | 43 (62%) | ||||
The times are expressed in years (y) or in months (mo). For RT‐qPCR and dPCR, the Mann‐Whitney and t test with Welch correction have been, respectively, used for comparison of the following continuous variables: age, duration of TKI treatment, time to MMR, time to DMR, time to best MR and DMR duration. A chi‐square analysis was performed for comparison of the following categorical variables: sex, BCR‐ABL transcript, Sokal class, 1st line TKI, TKI dose, shift to second‐line TKI, time to CcgR, MR t first dPCR. CML, chronic myeloid leukemia; DAS, dasatinib; NIL, nilotinib.
Bold and italic indicates the significance of the P value.
The patients were grouped into two pairs of DMR classes: the ones with MR4.0 vs the MR4.5‐5.0, and the ones with ≥0.468 vs those with <0.468 BCR‐ABL1 copies/µL, according to the dPCR cutoff value of 0.468 BCR‐ABL1 copies/µL, discriminating the deep molecular responders, as previously reported.24 A new receiver operating characteristic (ROC) curve analysis was carried out on the present cohort of patients and confirmed the reliability of the abovementioned cutoff in identification of the DMR patients by dPCR. (Figure S1).24
The assignment of DMR class, by using the RT‐qPCR values, was based on the results of the first RT‐qPCR evaluation, at the time of enrollment (Time point 0). In particular, at the Time point 0, according to RT‐qPCR results, 60 (42%) out of 142 patients had an MR4.0, and 32 (53%) out of 60 cases had MR4.0 undetectable; 82 (58%) had an MR4.5 or MR5.0 and 54 (66%) out of 82 cases were undetectable. On the other hand, according to dPCR results, 31 (22%) out of 142 patients had ≥0.468 BCR‐ABL1 copies/µL, and 111 cases (78%) had <0.468 BCR‐ABL1 copies/µL. (Table 1).
The median time of concomitant RT‐qPCR/dPCR monitoring was 24 months (range 12‐40). The median follow‐up of the entire cohort is 19 (1‐76).
Of note, 111 (78%) out of 142 patients discontinued the TKIs therapy. Fifty (45%) of patients who discontinued TKI therapy were enrolled in different discontinuing trails: ENESTFreedom (5/111, 4.5%), ENESTpath (8/111, 7.2%), and NP0 in Brescia (37/111, 33.3%).
Sixty‐one patients (55%) discontinued TKIs therapy out of clinical trials according to the Center policy based on clinical practice and shared patient's decision. All patients were evaluated at the time of discontinuation and after the discontinuation, while 13 cases were monitored also before the discontinuation of treatment (Table 2).
Table 2.
Clinical and hematological characteristics of 111 patients who discontinued TKI treatment comparatively monitored by RT‐qPCR and dPCR grouped in MR class by RT‐qPCR (MR4.0 vs MR4.5‐5.0) and by dPCR (≥ or <0.468 copies/µL) at enrollment
| Variable | Total (n = 111) | RT‐qPCR | dPCR | ||||
|---|---|---|---|---|---|---|---|
| MR4.0 (n = 45) (41%) | MR4.5‐5.0 (n = 66) (59%) | P‐value | dPCR at enrollment ≥0.468 copies/µL (n = 25) (23%) | dPCR at enrollment <0.468 copies/µL (n = 86) (77%) | P‐value | ||
| M/F | 61/50 | 26/19 | 35/31 | 0.6216 | 12/13 | 49/37 | 0.4271 |
| Median age (range) | 53 (20‐80) y | 52 (22‐80) y | 54 (20‐80) y | 0.7331 | 50 (22‐77) y | 53 (20‐80) y | 0.5752 |
| BCR‐ABL transcript at diagnosis | |||||||
| B3A2 | 83 (75%) | 34 (76%) | 49 (74%) | 0.7603 | 17 (68%) | 66 (77%) | 0.3038 |
| B2A2 | 23 (21%) | 10 (22%) | 13 (20%) | 8 (32%) | 15 (17%) | ||
| B2A2/B3A2 | 4 (4%) | 1 (2%) | 3 (5%) | — | 4 (5%) | ||
| NA | 1 (1%) | — | 1 (1%) | — | 1 (1%) | ||
| Sokal | |||||||
| L | 45 (41%) | 16 (36%) | 29 (44%) | 0.6781 | 13 (52%) | 32 (37%) | 0.5870 |
| I | 43 (39%) | 20 (44%) | 23 (35%) | 8 (32%) | 35(41%) | ||
| H | 19 (5%) | 8 (18%) | 11 (17%) | 3 (12%) | 16(19%) | ||
| NA | 4 (4%) | 1 (2%) | 3 (4%) | 1 (4%) | 3 (3%) | ||
| 1st line TKI | |||||||
| IM | 86 (77%)19 | 37 (77%) | 49 (74.2%) | 0.5792 | 19 (76%) | 67 (78%) | 0.7531 |
| NIL | (17%) | 7 (20%) | 12 (18.2%) | 4 (16%) | 15 (17%) | ||
| DAS | 5 (5%) | 1 (3%) | 4 (6.1%) | 2 (8%) | 3 (4%) | ||
| BOS | 1 (1%) | — | 1 (1.5%) | — | 1 (1%) | ||
| 1st TKI median dose (range) | |||||||
| IM | 400 (400‐800) | 400 (400‐800) | 400 (400‐800) | 1.0000 | 400 (400‐800) | 400 (400‐800) | 1.0000 |
| NIL | 400 (400‐600) | 400 (400‐600) | 400 (400‐600) | 400 (400‐400) | 400 (400‐600) | ||
| DAS | 100 (100‐100) | 100 (100‐100) | 100 (100‐100) | 100 (100‐100) | 100 (100‐100) | ||
| BOS | 500 (500‐500) | — | 500 (500‐500) | — | 500 (500‐500) | ||
| Shift to second‐line TKI | 21 (19%) | 10 (22%) | 11 (17%) | 0.3512 | 4 (16%) | 17 (20%) | 0.7591 |
| NIL | 11 (52%) | 4 (64%) | 7 (64%) | 3 (75%) | 8 (47%) | ||
| DAS | 8 (38%) | 5 (50%) | 3 (45%) | 1 (25%) | 7 (41%) | ||
| IM | 1 (5%) | — | 1 (1%) | 1 (6%) | |||
| BOS | 1 (5%) | 1 (10%) | — | 1 (6%) | |||
| Duration of TKIs treatment | 97 (33‐194) m | 97 (36‐194) m | 95 (33‐162) m | 0.6018 | 99 (38‐163) m | 96 (33‐194) m | 0.7031 |
| Time to CcgR | |||||||
| 3 mo | 64 (58%) | 29 (64%) | 35 (53%) | 0.4549 | 12 (43%) | 52 (60%) | 0.2458 |
| 6 mo | 27 (24%) | 11 (24%) | 16 (24%) | 9 (39%) | 18 (21%) | ||
| 12 mo | 7 (6%) | 1 (2%) | 6 (9%) | 1 (4%) | 6 (7%) | ||
| NA | 4 (4%) | 2 (4%) | 2 (3%) | 2 (9%) | 2 (2%) | ||
| Time to MMR | 7 (2‐112) m | 8 (2‐112) m | 6 (2‐83) m | 0.2510 | 6 (2‐40) m | 8 (2‐112) m | 0.6201 |
| Time to DMR | 19 (3‐120) m | 28 (3‐120) m | 14 (3‐119) m | 0.1502 | 16 (3‐78) m | 19 (3‐120) m | 0.3889 |
| Time to best MR | 52 (3‐162) m | 78 (3‐162) m | 46 (5‐144) m | 0.1672 | 50 (3‐83) m | 52 (5‐162) m | 0.5940 |
| DMR duration (overall) | 74 (5‐162) m | 81 (5‐154) m | 66 (24‐162) m | 0.050 | 54 (5‐144) m | 76 (24‐162) m | 0.0250 |
| DMR duration (until discontinuation) | 50 (9‐116) m | 57 (10‐116) m | 45 (9‐113) m | 0.1388 | 45 (10‐108) m | 52 (9‐116) m | 0.7272 |
| MR at first dPCR | |||||||
| MR4.0 total | 45 (41%) | 45 (100%) | 0 (0%) | — | 12 (48%) | 33 (38%) | 0.3881 |
| MR4.0 undetectable | 23 (51%) | 6 (50%) | 17 (52%) | ||||
| MR4.5‐5.0 total | 66 (59%) | 0 (0%) | 66 (100%) | 13 (52%) | 53 (62%) | ||
| MR4.5‐5.0 undetectable | 45 (68%) | 11 (85%) | 34 (64%) | ||||
| Patients who lost MR3.0 or MR4.0 | 24 (22%) | 9 (20%) | 15 (23%) | 0.8100 | 12 (48%) | 12 (14%) | 0.0003 |
| Median time | 3 (1‐19) m | 3 (1‐4) m | 5 (1‐19) m | 0.1371 | 3 (1‐19) m | 4 (1‐16) m | 0.6381 |
| lost MR3.0 | 8/9 (67%) | 2/15 (13%) | 5/12 (42%) | 3/12 (25%) | |||
| lost MR4.0 or 1 Log | 1/9 (33%) | 13/15 (87%) | 7/12 (58%) | 9/12 (75%) | |||
The times are expressed in years (y) or in months (mo). For RT‐qPCR and dPCR, the Mann‐Whitney and t test with Welch correction have been, respectively, used for comparison of the following continuous variables: age, duration of TKI treatment, time to MMR, time to DMR, time to best MR, DMR duration, and number of patients who lost MR. A chi‐square analysis was performed for comparison of the following categorical variables: sex, BCR‐ABL transcript, Sokal class, 1st line TKI, TKI dose, shift to second‐line TKI, time to CcgR, MR at first dPCR, and time to loss of MR. DAS, dasatinib; IM, imatinib; NIL, nilotinib.
Bold and italic indicates the significance of the P value.
During the monitoring period, a total of 556 peripheral blood samples were comparatively analyzed by RT‐qPCR/dPCR.17, 24, 25
The study was performed according to good clinical practice and Helsinki's Declaration, and the patients gave their informed consent.
2.2. RT‐qPCR and dPCR analyses
Conventional RT‐qPCR measurements were carried out at the Reference Laboratory of each participating Center, according to ELN Guidelines.4, 25, 26, 27 At each time point scheduled for the MRD monitoring, 10 mL of peripheral blood was sampled and used for RT‐qPCR analysis.17, 24
Molecular responses by RT‐qPCR were defined according to the latest laboratory recommendations and using ABL1 as a housekeeping gene.24 Measurable MR was assigned following the international scale (IS) and scored MR4.0 if ≤0.01% BCR‐ABL1 %IS, MR4.5 if ≤0.0032% BCR‐ABL1 %IS, and MR5.0 if ≤0.001 BCR‐ABL1 %IS. Minimum sum of ABL1 reference gene transcripts, irrespective of whether BCR‐ABL1 was detected or not, 10.000, 32.000, and 100.000 for MR4.0, MR4.5, and MR5.0, respectively.24
The participating reference laboratories belonged the Gimema Labnet and accredited by the Gimema Labnet Quality Committee to release the results of RT‐qPCR analysis, since certified for the quantification of BCR‐ABL1 according to the IS, as recommended by the International Experts Panel's Guide Lines.25 These analysis were performed as detailed in Data S2.
To the purpose of our study, the loss of the MR was defined as loss of MR3.0 according to ENESTFreedom and ENESTpath criteria (13 cases) or as “at least two positive RT‐PCR results showing a significant increase (by 10 times; ie, one log), at two consecutive assessments or loss of major molecular response (MMR)” according to what reported by STIM study (98 cases).6The dPCR analysis was performed on the same cDNA samples used for RT‐qPCR, in order to limit the retrotranscription step variability.28 Therefore, each patient enrolled in the study was comparatively analyzed for the BCR‐ABL1 transcript by RT‐qPCR and by dPCR at every time point.
The dPCR analysis was centralized at the Laboratory CREA (Centro di Ricerca Emato‐Oncologico AIL) of the ASST Spedali Civili of Brescia and performed as previously described.24
Briefly, the cDNA was quantified using a Quant‐iT™ OliGreen® ssDNA kit (Thermofisher Scientific) by Infinite200 (Tecan) and diluted at 50 ng/µL since this quantity resulted the best to obtain a deep quantification and to avoid the saturation of the chip.
We prepared 16 μL of reaction mix containing 8 μL of 2X QuantStudio 3D Digital PCR Master Mix (Thermofisher Scientific), 0.8 μL of 20X TaqMan‐MGB‐FAM‐probe assay, 1.1 μL of diluted cDNA, and 6.1 μL of nuclease‐free water (Qiagen). The negative control reaction mix contained 8 µL of 2X QuantStudio 3D Digital PCR Master Mix, 0.8 μL of 20X TaqMan‐MGB‐FAM‐probe assay, and of 7.2 μL nuclease‐free water. One negative control was loaded every thermal cycling run containing samples prepared with the same mix. The reverse transcription negative control reaction mix contained 8 μL of 2X QuantStudio 3D Digital PCR Master Mix, 0.8 μL of 20X TaqMan‐MGB‐FAM‐probe assay, 1.2 μL of reverse transcription blank, and 6.1 μL of nuclease‐free water.
For each sample, we loaded 15 μL of the reaction mixes onto a QuantStudio 3D Digital PCR 20K Chip (Thermofisher Scientific) using the automatic chip loader and the signal was amplified by the following thermocycling profile: 95°C for 8 minutes, 45 cycles at 95°C for 15 seconds, and 60°C for 1 minute, with a final extension step at 60°C for 2 minutes. The amplification was followed by the chips imaging and the secondary analysis performed with the QuantStudio 3D AnalysisSuite Cloud Software. All samples were analyzed twice by different operators and the final results were expressed as means of the number of BCR‐ABL1 copies/µL of reaction of the replicates.24
2.3. Statistical analysis
Clinical and laboratory data were categorized as continuous or categorical variables. The t test or Mann‐Whitney and chi‐square were used to compare the continuous and categorical variables, respectively. The t test with Welch's correction has been used in the evaluation of dPCR subgroups as unbalanced sample sizes had to be taken into account (in fact 111 and 31 patients in the overall cohort, and 86 and 25 patients in the discontinuation cohort presented dPCR lower and higher than 0.468, respectively). Normality distribution of variables was assessed by a Shapiro‐Wilk test. The type of analysis performed is stated in figures’ and tables’ legends.
Treatment‐free remission was calculated from the date of TKI withdrawal to the date of loss of MR3.0 or MR4.0 or last control by the Kaplan‐Meier method. Comparison of subgroups was carried out by the log‐rank test. Univariate Cox regression analysis was used to evaluate the association of variables with TFR. Variables included age at diagnosis, sex, previous therapy with IFN, time to MMR and DMR, Sokal class, type of transcript, time to discontinuation, use of frontline second‐ generation TKIs, MR classes considering detectable and undetectable transcript, and dPCR. Multivariable analysis has been performed on dPCR values and, by univariate analysis, the duration of DMR resulted significant.
Receiver operator curves analysis was done to recalculate the optimal dPCR cutoff value to discriminate the patients with DMR and lower probability to lose MR3.0 after TKI discontinuation. Notably, a cutoff of 0.468 was found to be coincidental with the previous one identified discriminating the deep molecular responders by dPCR.24 This value divided patients with lower risk of disease molecular relapse better, with an area under the curve of 0.69 (CI 95% 0.57‐0.81), specificity of 85% and sensitivity of 54% (Figure S1). All p‐values are two‐sided and significance level has been set below 0.05. Statistical analyses were conducted with EZR software (version 1.33), as previously described.29
3. RESULTS
This study aimed to comparatively evaluate the efficiency and the reliability of the RT‐qPCR and dPCR for the recognition of an accurate and “stable” DMR and selection of candidates to TKIs discontinuation.
For that purpose, 142 CML patients with a durable RT‐qPCR DMR (≥2 years) were comparatively monitored by RT‐qPCR/dPCR every 3‐4 months for a median time of 24 months (range 12‐40), from the time of enrollment (first RT‐qPCR/dPCR analysis = Time point 0) thereafter (last follow‐up). Furthermore, 111/142 patients underwent treatment discontinuation and were valuable for TFR.
First, the levels of BCR‐ABL1 minimal residual disease, as conventionally assessed by RT‐qPCR, were correlated with the dPCR values measured at the same time points.
The 556 samples comparatively analyzed by RT‐qPCR and dPCR are plotted in Figure 1. RT‐qPCR BCR‐ABL1 results were grouped into MR4.0, MR4.5, and MR5.0class (“X axis”). When the same samples were analyzed by dPCR, different levels of BCR‐ABL1 copies were measured (“Y axis”). The numbers of BCR‐ABL1 copies/µL in each MR class resulted heterogeneous and widely dispersed, even the relative medians and range were progressively decreasing moving from the MR4.0 class to MR5.0class. The difference was statistically significant between the MR4.0 class and the MR4.5 (P = 0.0104) or the MR5.0 class (P = 0.0032), but not between the MR4.5 and the MR5.0 classes (P = 0.2021) (Figure 1).
Figure 1.
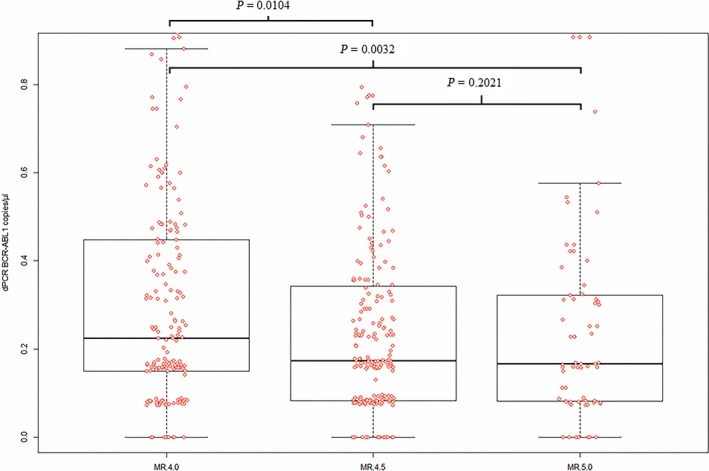
Levels of BCR‐ABL1 transcript measured by dPCR (y‐axis) according to different MR classes calculated by RT‐qPCR (x‐axis). RT‐qPCR BCR‐ABL1 results were grouped into MR4.0, MR4.5, and MR5.0 class (“X axis”). When the same samples were analyzed by dPCR, different levels of BCR‐ABL1 copies were measured (“Y axis”). The difference was statistically significant between the MR4.0 class and the MR4.5 (P = 0.01) or the MR5.0 class (P = 0.003), but not between the MR4.5 and the MR5.0 classes (P = 0.2). The statistic test used was t test. In box and whiskers plot, center line represents the median values; the boxes’ limits represent the lower and the higher quartile; whiskers define the extreme values; and points represent the single analysis values
Then, we comparatively analyzed the course of RT‐qPCR monitoring in the MR4.0 and MR4.5‐5.0 patients, as well as the course of molecular dPCR monitoring in the patients with ≥ and <0.468 BCR‐ABL1 copies/µL (Figure 2).
Figure 2.
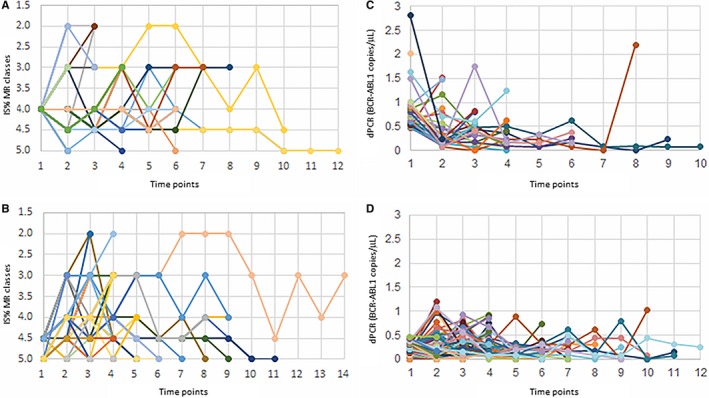
Molecular residual disease (MRD) over time as measured by RT‐qPCR and dPCR. (A) MRD monitoring by RT‐qPCR in patients with MR4.0 at Time Point 0. (B) MRD monitoring by RT‐qPCR in patients with MR4.5‐5.0 at Time Point 0. (C) MRD monitoring by dPCR in patients with value of BCR‐ABL1 copies/µL ≥0.468 at Time Point 0. (D) MRD monitoring by dPCR in patients with value of BCR‐ABL1 copies/µL <0.468 at Time Point 0
The patients grouped into the MR4.0 and MR4.5‐5.0 class by RT‐qPCR started from the same MR determined at Time point 0 (Figure 2A,B); on the other hand, patients with dPCR ≥0.468 BCR‐ABL1 copies/µL, at the Time point 0, presented different levels of molecular MRD and had a median value of 0.758 (range 0.469‐2.806), while patients with dPCR <0.468 copies/µL presented lower levels of BCR‐ABL1 copies and their median value was of 0.171 (range 0‐0.467) (Figure 2C,D).
No difference between the monitoring course of MR4.0 and MR4.5‐5.0 classes could be appreciated and measured. Instead, observing the course of dPCR MRD molecular monitoring, the patients belonging the group below the cutoff of <0.468 BCR‐ABL1 copies/µL seemed to show lower and more “stable” levels of MRD along all the time of monitoring (Figure 2D). During the follow‐up, patients with dPCR <0.468 BCR‐ABL1 copies/µL at the Time point 0, presented a median value of 0.175 copies/µL (range 0‐1.348), while patients with dPCR ≥0.468 copies/µL presented higher levels of BCR‐ABL1 copies and had a median value of 0.393 copies/µL (range 0‐2.195). The differences at Time point 0 and the variations during the follow‐up period did not result statistically significant between the two groups.
In order to evaluate the correlation between the DMR, the characteristics of patients, and the probability to maintain the TFR, the analysis was carried out first on all of the 142 cases and then in the patients who discontinued the treatment (n = 111), grouped into two pairs of classes according to the RT‐qPCR and dPCR results at Time point 0: the MR4.0 vs MR4.5‐5.0 class, and ≥0.468 vs <0.468 BCR‐ABL1 copies/µL group (Tables 1 and 2).
The clinical and hematological characteristics of the patients grouped according to DMR classes (M4.0 vs MR4.5‐5.0) were superimposable, while the patients with dPCR <0.468 had a longer DMR duration (P = 0.0250) and more frequently belonged to MR4.5‐5.0 (P = 0.0442) classes compared to patients with higher dPCR values (Table 1).
Overall, 111/142 (78%) patients discontinued the TKI treatment after a median time of 97 months of TKI therapy (range 33‐194). MRD levels assessed by RT‐qPCR at the time of treatment discontinuation identified 45/111 (41%) patients with MR4.0 (23/45—51%—presented BCR‐ABL1 transcript undetectable) and 66/111 (59%) with MR4.5‐5.0 (45/66—68%—presented BCR‐ABL1 transcript undetectable). These patient groups, MR4.0 vs MR4.5‐5.0, did not show any significant statistical difference in clinical and hematological characteristics (Table 2).
By dPCR, 25/111 (23%) had ≥0.468 and 86/111 (77%) had <0.468. No significant statistical difference was observed in clinical and hematological characteristics, except for a longer overall DMR duration in patients with dPCR <0.468 (76 vs 54 months. P = 0.0250) (Table 2).
At last follow‐up, 24/111 (22%) patients lost the MR3.0 (10/24) or the MR4.0 (14/24) (Table 2). The median time of MR loss was 3 months from TKI discontinuation (range 1‐19), with an incidence rate of 10.4 pt/year. Overall, the TFR was 83% at 6 months, 80% at 12 months, and 77% at 24 months (Figure 3). According to RT‐qPCR at the time of TKI discontinuation, 9/45 were in MR4.0 (20%) and 15/66 (23%) were in MR4.5‐5.0 (P = 0.8100); according to dPCR, 12/25 (48%) and 12/86 (14%) had BCR‐ABL1 values ≥0.468 and <0.468, respectively (P = 0.0003) (Table 2).
Figure 3.
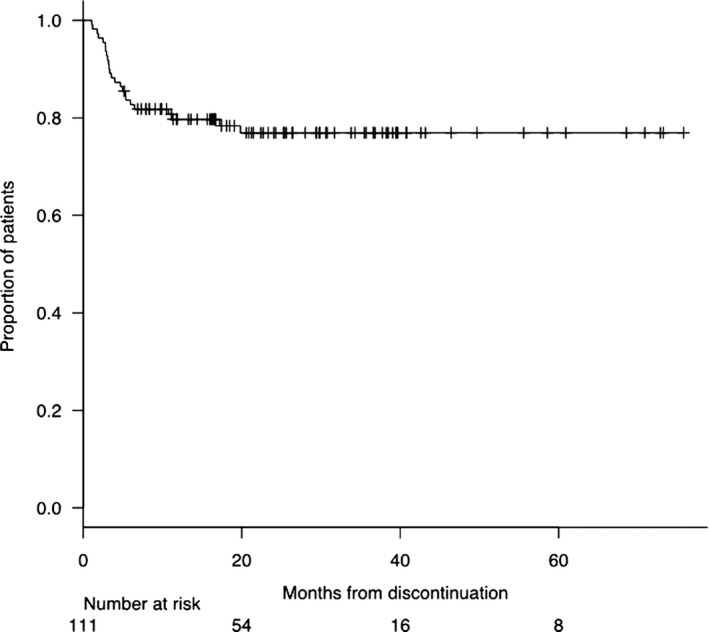
Treatment‐free remission (TFR) curve of 111 patients in deep molecular response (DMR) who discontinued TKI. The probability of maintaining TFR was 83%, 80%, and 77% at 6, 12, and 24 months, respectively. The plot has been performed by the Kaplan‐Meier method
By survival analysis, no statistical significant differences according to different MR classes were found (Figure 4; P = 0.6510). An additional Kaplan‐Meier analysis was carried out on detectable MR4.0 vs total MR4.5‐5.0 (Supplementary File 3A), on MR4.0‐4.5 detectable and total MR5.0 (Figure S2B), and on MR4.0 detectable with MR4.5 detectable and MR5.0 at all (Figure S2C). In any cases, the consideration of the detectability of the transcript was not statistically significant. On the contrary, a dPCR value below 0.468 BCR‐ABL1 copies/µL at the time of discontinuation highly stratified patients with lower probability to lose MR Indeed, the TFR at 1 and 2 years was 85% and 83% patients presenting dPCR values below the defined cutoff compared to 59% and 52% of patients with higher dPCR values at the time of discontinuation, respectively (P = 0.0017) (Figure 5).
Figure 4.
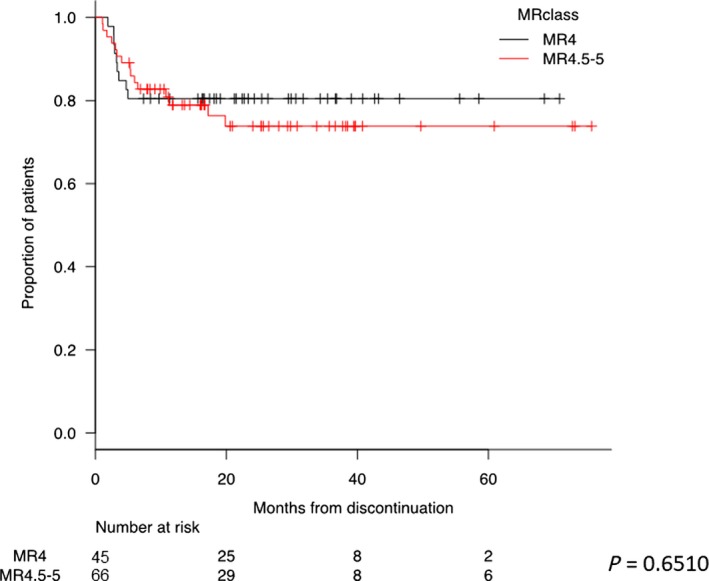
Treatment‐free remission (TFR) curves according to MR class measured by RT‐qPCR at the time of discontinuation. The red curve represents patients discontinued with MR4.0, and the black curve patients with MR4.5‐5.0. The probability of maintaining TFR for patients discontinued with MR4.0 was 80% at both 1 and 2 years. The probability of maintaining TFR for patients discontinued with MR4.5‐5.0 was 79% and 74% at 1 and 2 years, respectively. Kaplan‐Meier analysis was used for the evaluation of TFR. Comparison of subgroups was carried out by the log‐rank test
Figure 5.
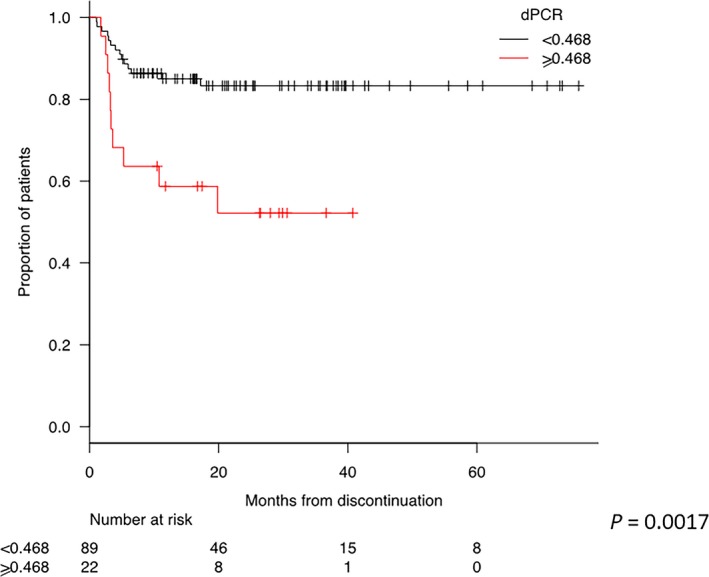
Treatment‐free remission (TFR) curves according to dPCR values. The red curve represents patients discontinued with a dPCR value lower than 0.468 and the black curve patients with a dPCR value higher than 0.468. The probability of maintaining TFR for patients discontinued with dPCR <0.468 was 85% and 83% at 1 and 2 years, respectively. The probability of maintaining TFR for patients discontinued with dPCR ≥ 0.468 was 59% and 52% at 1 and 2 years, respectively. A Kaplan‐Meier analysis was used for the evaluation of TFR. Comparison of subgroups was carried out by a log‐rank test
The univariate and multivariate analyses confirmed the predictive value of dPCR. In particular, DMR duration > 5 years (HR 0.2855, CI 95% 0.0931‐0.8760, P = 0.0284) and dPCR (HR 0.2936, CI 95% 0.1302‐0.6618, P = 0.0031) resulted significantly predictable of TFR maintenance in univariate analysis. By multivariate analysis, only dPCR retained its significant value (HR 0.2124, CI 95% 0.0637‐0.7082, P = 0.0117 (Figure 6).
Figure 6.
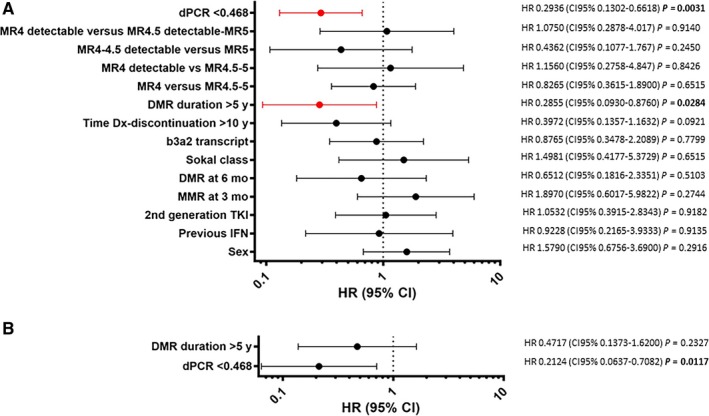
Univariate and multivariate analyses for the prediction of treatment‐free remission (TFR). (A) Univariate Cox regression analysis. Variables included were age at diagnosis, sex, previous therapy with IFN, time to MMR and DMR, Sokal class, type of transcript, time to discontinuation, use of frontline second‐generation TKIs, MR classes considering detectable and undetectable transcript, and dPCR. DMR duration > 5 years (HR 0.2855, CI 95% 0.0931‐0.8760, P = 0.0284) and dPCR (HR 0.2936, CI 95% 0.1302‐0.6618, P = 0.0031) resulted significantly predictable of TFR maintenance. (B) Multivariate analysis—only dPCR retained its significant value (HR 0.2124, CI 95% 0.0637‐0.7082, P = 0.0117)
In 13 cases, a comparative monitoring of DMR by RT‐qPCR/dPCR was possible for at least 24 months before TKIs discontinuation. In these cases, 10 out of 13 (77%) had stable <0.468 BCR‐ABL1 copies/µL by dPCR and 2/10 (20%) lost MR. On the other hand, 3/13 (23%) presented stable ≥0.468 BCR‐ABL1 copies/µL by dPCR and 2/3 (67%) lost MR (P = 0.1245).
4. DISCUSSION
This study, based on a multicentric cohort of CML patients with durable DMR (≥2 years), shows that the dPCR appears to be more accurate and sensitive than conventional RT‐qPCR for detecting and monitoring the BCR‐ABL1 molecular levels. Moreover, dPCR is potentially able to improve the recognition of DMR and the selection of the candidates to TKI treatment discontinuation.
The study reports on a longlasting comparative RT‐qPCR/dPCR monitoring of BCR‐ABL1 transcript levels in 142 CML patients having a median duration of TKI treatment and DMR of 8.3 years and 5.9 years, respectively. These long periods could explain why a very high TFR rate (80% at 1 year) was observed in our cohort of patients, in comparison to an expected rate of 50%‐60%, usually reported in the literature.6, 7 Notably, the TKI exposure and DMR duration was 4.8 and 3 years in STIM trial, 6 and 3.3 years in IFN‐IM cohort of Twister trial, and 6.3 and 2.4 in STOP 2G‐TKI study, respectively. Durable DMR, more than the duration of TKI treatment, is considered the most important modifiable prognostic factor playing a key role for TKI discontinuation success, but at present, there is no general agreement on the duration either of the TKIs therapy or of DMR. 11
Indeed, ESMO recommends at least 5 years of TKI therapy combined with ≥2 years of DMR before TKI discontinuation,13 while the French CML Study Group requires at least 2 years of MR4.5 before discontinuation in order to reach the TFR. Moreover, a great uncertainty still remains for the level of MR.12
Considering the pivotal clinical trials concerning TKI discontinuation, in EURO‐SKI study, a threshold of 3.1 years of MR4.0 was identified as dissecting the patients with the lowest probabilities to lose the TFR. 30 In the JALSG‐STIM213 trial, patients in MR5.0 undetectable before IM or nilotinib discontinuation had significantly higher probabilities to maintain the TFR than those in MR4.5. 31, 32 In the STIM study, the following duration of the treatment was considered: at least 3 years of IM was required, with at least 2 years of MR4.5 undetectable levels of BCR‐ABL1 quantified following the IS system. 7
It clearly appears that the sensitivity and the detectability of BCR‐ABL1 transcript are additional elements that may play an important role. In fact, because of its low sensitivity, RT‐qPCR could not discriminate the depth of response in patients with undetectable BCR‐ABL1 transcript and a patient with undetectable MR4.0 could belong to MR5.0.
In our experience, the majority of the samples classified as DMR had an undetectable level of transcript, confirming the low RT‐qPCR capability to detect low levels of MRD while the dPCR appeared to overcome this important bias thanks to its high sensitivity and accuracy, allowing a better selection of patients eligible for TKI discontinuation. Our data, according to Takahashi and colleagues,31 encourage TFR studies using dPCR, offering better quantitative accuracy than RT‐qPCR IS for DMR.
Looking at our RT‐qPCR and dPCR comparative analysis and monitoring, dPCR allowed to highlight a high heterogeneity of MRD levels in patients belonging the same class of MR at the Time point 0. Indeed, measuring the absolute number of BCR‐ABL1 copies/µL by dPCR, it was evident that both the patients with MR4.0 and those with MR4.5‐5.0 had different levels of MRD (Figure 1). Importantly, absolute numbers of BCR‐ABL1 copies/µL could be detected and measured also in MR4.0, MR4.5, or MR5.0 patients with undetectable BCR‐ABL1 transcripts by RT‐qPCR.
Furthermore, due to a sort of “normalizing” effect of RT‐qPCR, the courses of the patients monitored by RT‐qPCR did not allow the identification of patients with “stable” DMR from the patients with the “unstable” DMR, neither in the group of MR4.0 responses nor in the group of MR4.5‐5.0 responses, independently from a detectable or undetectable BCR‐ABL1 transcript.
Observing MRD courses by dPCR in the group of patients with ≥ or <0.468 BCR‐ABL1 copies/µL, it was possible to appreciate a specific trend for each patient. Moreover, patients presenting MRD levels <0.468 BCR‐ABL1 copies/µL at Time point 0, apparently showed lower levels of transcript along all the follow‐up than patients with MRD levels ≥0.468 BCR‐ABL1 copies/µL, even if we did not find any statistical difference between median levels of ≥ and <0.468 BCR‐ABL1 copies/µL groups. Lacking of a statistically significant difference could be due to the narrow range of values measured by dPCR and to the needing of a dPCR power test, focused on this end point and carried out on a larger cohort of CML patients.
These data suggest that the dPCR may be able to identify a set of optimal and stable molecular responders based on the levels and the stability of MRD (<0.468 BCR‐ABL1 copies/µL).
One hundred and eleven patients discontinued the TKI treatment and 24 (22%) of them lost the MR3.0 or the MR4.0 according to the criteria reported by Etienne et al.6
In our cohort of patients, the TFR rate was higher than the one currently reported in the IM and second‐generation TKI discontinuation studies31, 32 but, as expected, the loss of MR occurred in 24/111 (22%) cases early after TKIs discontinuation (3 months). This highly positive selection could be explained, as above reported, by the prolonged treatment and the DMR duration.30, 31 Furthermore, the major part of the patients (75%) who underwent TKIs discontinuation was characterized by the presence of the transcript b3a2. This transcript has been recently associated with a better response to the TKIs treatment, resulting in higher sustained DMR rate,39 and a longer TFR.40It has to be underlined that considering our entire cohort, patients with <0.468 dPCR values of MRD had also a significantly longer duration of DMR and this seemed to significantly translate in a lower rate of loss of MR, either MR3.0 or MR4.0.
By the way, the rate of MR3.0 or MR4.0 loss in the cases with <0.468 BCR‐ABL1 copies/µL by dPCR resulted significantly lower (14%) than one of the cases with ≥0.468 BCR‐ABL1 copies/µL (48%). Indeed, the probability to predict the TFR was 86% for the cases with <0.468 BCR‐ABL1 copies/µL and 52% for the cases with ≥0.468 BCR‐ABL1 copies/µL, and this difference was statistically significant (P=0.0003) (Table 2).
Looking at the clinical and hematological characteristics of these two groups of patients, they resulted comparable, except for the longer duration of DMR (P = 0.025).
Interestingly, these data first showed a potential correlation between the duration and stability of DMR and a measurable reduction of molecular levels of BCR‐ABL1 transcript. In our opinion, they suggest the value <0.468 BCR‐ABL1 copies/µL of transcript by dPCR would reflect the threshold of BCR‐ABL1 transcript suitable for a higher probability of treatment discontinuation success. In fact, in our study, the dPCR resulted the only parameter associated with TFR by multivariate analysis (Figure 6), while no statistically significant difference (P = 0.6510) was observed between the rate of MR loss of patients with MR4.0 (detectable or undetectable) vs MR4.5‐5.0 (detectable or undetectable) (Figure 4).
There is general agreement on considering RT‐qPCR not sufficiently adequate to measure low levels of BCR‐ABL1 transcripts and this has to be considered particularly relevant in the era of the more potent second‐generation TKIs. 25, 38 However, while everybody knows the limits of RT‐qPCR, newly available technologies have not been yet introduced in the quantification of the MRD, particularly in the setting of deep responders CML patients, possible candidates to TKIs discontinuation.
In order to routinely apply dPCR for BCR‐ABL1 detection and quantification for a personalized management of CML patients, other efforts have to be performed in the standardization of the procedures and in the alignment of the results generated by the different dPCR platforms.22, 24, 41
No firm conclusion can be drawn and, certainly, the higher accuracy, sensitivity, and predictive value of dPCR have to be prospectively confirmed on a larger cohort of cases. However, this study practically tested the potential of dPCR and highlighted that this technique is able to detect measurable quantities of BCR‐ABL1 transcripts in the cases with undetectable DMR by RT‐qPCR; that patients belonging to the same MR class do not have the same quantities of BCR‐ABL1 transcript when measured by dPCR; and that dPCR may improve the recognition of “stable” DMR, hence contributing to a better selection of candidates to TKIs discontinuation.
CONFLICT OF INTEREST
The authors declare no competing financial interests.
AUTHOR CONTRIBUTIONS
DR, SB, and MM designed the study; SB, CZ, and EDE performed the dPCR analysis; MM, MF, MD, CC, AI, CB, M. Bonifacio, ET, MT, CD, GG, FS, FDR, M. Bergamaschi, MG, LF, MDD, and EA enrolled the patients and collected the clinical data; NP and EDE performed the statistical analysis; SB, MM, NP, EDE, CZ, and DR wrote the manuscript.
Supporting information
ACKNOWLEDGMENTS
This work was supported in part by European Leukemia Net (ELN)—European Treatment and Outcome Study (EUTOS) and Gimema CML‐Working Party, Department of Clinical and Experimental Sciences of University of Brescia funds, and by Cofin 2009.
Bernardi S, Malagola M, Zanaglio C, et al. Digital PCR improves the quantitation of DMR and the selection of CML candidates to TKIs discontinuation. Cancer Med. 2019;8:2041–2055. 10.1002/cam4.2087
REFERENCES
- 1. Kantarjian H, O'Brien S, Jabbour E, et al. Improved survival in chronic myeloid leukemia since the introduction of imatinib therapy: a single‐institution historical experience. Blood. 2012;119(9):1981‐1987. [DOI] [PMC free article] [PubMed] [Google Scholar]
- 2. Hehlmann R, Hochhaus A, Baccarani M. European LeukemiaNet. Chronic myeloid leukaemia Lancet. 2007;370(9584):342‐350. [DOI] [PubMed] [Google Scholar]
- 3. Sasaki K, Strom SS, O’Brien S, et al. Relative survival in patients with chronic‐phase chronic myeloid leukaemia in the tyrosine‐kinase inhibitor era: analysis of patient data from six prospective clinical trials. Lancet Haematol. 2015;2(5):e186‐e193. [DOI] [PMC free article] [PubMed] [Google Scholar]
- 4. Baccarani M, Deininger Mw, Rosti G, et al. European LeukemiaNet recommendations for the management of chronic myeloid leukemia: 2013. Blood. 2013;122(6):872‐884. [DOI] [PMC free article] [PubMed] [Google Scholar]
- 5. Latham S, Bartley PA, Budgen B, et al. BCR‐ABL1 expression, RT‐qPCR and treatment decisions in chronic myeloid leukaemia. J Clin Pathol. 2016;69(9):817‐821. [DOI] [PubMed] [Google Scholar]
- 6. Etienne G, Guilhot J, Rea D, et al. Long‐term follow‐up of the French Stop Imatinib (STIM1) study in patients with chronic myeloid leukemia. J Clin Oncol. 2017;35(3):298‐305. [DOI] [PubMed] [Google Scholar]
- 7. Mahon F‐X, Réa D, Guilhot J, et al. Discontinuation of imatinib in patients with chronic myeloid leukaemia who have maintained complete molecular remission for at least 2 years: the prospective, multicentre Stop Imatinib (STIM) trial. Lancet Oncol. 2010;11(11):1029‐1035. [DOI] [PubMed] [Google Scholar]
- 8. Ross DM, Branford S, Seymour JF, et al. Safety and efficacy of imatinib cessation for CML patients with stable undetectable minimal residual disease: results from the TWISTER study. Blood. 2013;122(4):515‐522. [DOI] [PubMed] [Google Scholar]
- 9. Giles FJ, Rea D, Rosti G, et al. Impact of age on efficacy and toxicity of nilotinib in patients with chronic myeloid leukemia in chronic phase: ENEST1st subanalysis. J Cancer Res Clin Oncol. 2017;143(8):1585‐1596. [DOI] [PMC free article] [PubMed] [Google Scholar]
- 10. Rea D, Nicolini FE, Tulliez M, et al. Discontinuation of dasatinib or nilotinib in chronic myeloid leukemia: interim analysis of the STOP 2G‐TKI study. Blood. 2017;129(7):846‐854. [DOI] [PubMed] [Google Scholar]
- 11. Hughes TP, Ross DM. Moving treatment‐free remission into mainstream clinical practice in CML. Blood. 2016;128(1):17‐23. [DOI] [PubMed] [Google Scholar]
- 12. Rea D, Ame S, Berger M, et al. Discontinuation of tyrosine kinase inhibitors in chronic myeloid leukemia: Recommendations for clinical practice from the French Chronic Myeloid Leukemia Study Group. Cancer. 2018;124(14):2956‐2963. [DOI] [PubMed] [Google Scholar]
- 13. Hochaus A, Saussele S, Rosti G, et al. Chronic myeloid leukaemia: ESMO Clinical Practice Guidelines for diagnosis, treatment and follow‐up. Ann Oncol. 2017;28(suppl 4):41‐51. [DOI] [PubMed] [Google Scholar]
- 14. Marum JE, Branford S. Current developments in molecular monitoring in chronic myeloid leukemia. Ther Adv Hematol. 2016;7(5):237‐251. [DOI] [PMC free article] [PubMed] [Google Scholar]
- 15. Branford S. Molecular monitoring in chronic myeloid leukemia–how low can you go? Hematology. 2016;2016(1):156‐163. [DOI] [PMC free article] [PubMed] [Google Scholar]
- 16. Hughes TP, Ross DM. Targeted therapies: remembrance of things past—discontinuation of second‐generation TKI therapy for CML. Nat Rev Clin Oncol. 2017;14(4):201‐202. [DOI] [PubMed] [Google Scholar]
- 17. Branford S, Fletcher L, Cross NC, et al. Desirable performance characteristics for BCR‐ABL measurement on an international reporting scale to allow consistent interpretation of individual patient response and comparison of response rates between clinical trials. Blood. 2008;112(8):3330‐3338. [DOI] [PubMed] [Google Scholar]
- 18. Rea D, Mahon F‐X. How I manage relapse of chronic myeloid leukaemia after stopping tyrosine kinase inhibitor therapy. Br J Haematol. 2018;180(1):24‐32. [DOI] [PubMed] [Google Scholar]
- 19. Saußele S, Richter J, Hochhaus A, Mahon F‐X. The concept of treatment‐free remission in chronic myeloid leukemia. Leukemia. 2016;30(8):1638‐1647. [DOI] [PMC free article] [PubMed] [Google Scholar]
- 20. Huggett JF, Cowen S, Foy CA. Considerations for digital PCR as an accurate molecular diagnostic tool. Clin Chem. 2015;61(1):79‐88. [DOI] [PubMed] [Google Scholar]
- 21. Cao L, Cui X, Hu J, et al. Advances in digital polymerase chain reaction (dPCR) and its emerging biomedical applications. Biosens Bioelectron. 2017;90:459‐474. [DOI] [PubMed] [Google Scholar]
- 22. Alikian M, Whale AS, Akiki S, et al. RT‐qPCR and RT‐Digital PCR: a comparison of different platforms for the evaluation of residual disease in chronic myeloid leukemia. Clin Chem. 2017;63(2):525‐531. [DOI] [PubMed] [Google Scholar]
- 23. Fava C, Bernardi S, Gottardi EM, et al. Standardization of two Dpcr platforms for detection of BCR/ABL1—Minimal Residual Disease (MRD) in Ph+ Chronic Myeloid Leukemia (CML). Blood. 2017;130(suppl 1):2867. [Google Scholar]
- 24. Bernardi S, Ruggieri G, Malagola M, et al. Digital PCR (Dpcr) a Step Forward to Detection and Quantification of Minimal Residual Disease (MRD) in Ph+/BCR‐ABL1 Chronic Myeloid Leukemia (CML). J Mol Biomark Diagn. 2017;08(03):1‐3. [Google Scholar]
- 25. Cross NC, White HE, Colomer D, et al. Laboratory recommendations for scoring deep molecular responses following treatment for chronic myeloid leukemia. Leukemia. 2015;29(5):999‐1003. [DOI] [PMC free article] [PubMed] [Google Scholar]
- 26. Steegmann JL, Baccarani M, Breccia M, et al. European LeukemiaNet recommendations for the management and avoidance of adverse events of treatment in chronic myeloid leukaemia. Leukemia. 2016;30(8):1648‐1671. [DOI] [PMC free article] [PubMed] [Google Scholar]
- 27. Gabert J, Beillard E, van der Velden VH, et al. Standardization and quality control studies of 'real‐time' quantitative reverse transcriptase polymerase chain reaction of fusion gene transcripts for residual disease detection in leukemia ‐ a Europe Against Cancer program. Leukemia. 2003;17(12):2318‐2357. [DOI] [PubMed] [Google Scholar]
- 28. Alikian M, Gale RP, Apperley JF, Foroni L. Molecular techniques for the personalised management of patients with chronic myeloid leukaemia. Biomol Detect Quantif. 2017;11:4‐20. [DOI] [PMC free article] [PubMed] [Google Scholar]
- 29. Kanda Y. Investigation of the freely available easy‐to‐use software ‘EZR’ for medical statistics. Bone Marrow Transplant. 2013;48(3):452‐458. [DOI] [PMC free article] [PubMed] [Google Scholar]
- 30. Saussele S, Richter J, Guilhot J, et al. Discontinuation of tyrosine kinase inhibitor therapy in chronic myeloid leukaemia (EURO‐SKI): a prespecified interim analysis of a prospective, multicentre, non‐randomised, trial. Lancet Oncol. 2018;19(6):747‐757. [DOI] [PubMed] [Google Scholar]
- 31. Takahashi N, Nishiwaki K, Nakaseko C, et al. Treatment‐free remission after two‐year consolidation therapy with nilotinib in patients with chronic myeloid leukemia: STAT2 trial in Japan. Haematologica. 2018;103(11):1835‐1842. [DOI] [PMC free article] [PubMed] [Google Scholar]
- 32. Takahashi N, Tauchi T, Kitamura K, et al. Deeper molecular response is a predictive factor for treatment‐free remission after imatinib discontinuation in patients with chronic phase chronic myeloid leukemia: the JALSG‐STIM213 study. Int J Hematol. 2018;107(2):185‐193. [DOI] [PubMed] [Google Scholar]
- 33. Dulucq S, Mahon F‐X. Deep molecular responses for treatment‐free remission in chronic myeloid leukemia. Cancer Med. 2016;5(9):2398‐2411. [DOI] [PMC free article] [PubMed] [Google Scholar]
- 34. Ross DM, Hughes TP. How I determine if and when to recommend stopping tyrosine kinase inhibitor treatment for chronic myeloid leukaemia. Br J Haematol. 2014;166(1):3‐11. [DOI] [PubMed] [Google Scholar]
- 35. Ross DM, Branford S, Seymour JF, et al. Patients with chronic myeloid leukemia who maintain a complete molecular response after stopping imatinib treatment have evidence of persistent leukemia by DNA PCR. Leukemia. 2010;24(10):1719‐1724. [DOI] [PubMed] [Google Scholar]
- 36. Legros L, Nicolini FE, Etienne G, et al. Second tyrosine kinase inhibitor discontinuation attempt in patients with chronic myeloid leukemia. Cancer. 2017;123(22):4403‐4410. [DOI] [PubMed] [Google Scholar]
- 37. Shah NP, Paquette R, Müller MC, et al. Treatment‐free remission (TFR) in patients with chronic phase chronic myeloid leukemia (CML‐CP) and in stable deep molecular response (DMR) to dasatinib ‐ the Dasfree Study. Blood. 2016;128(22):1895. [Google Scholar]
- 38. Soverini S, De Benedittis C, Mancini M, Martinelli G. Best practices in chronic myeloid leukemia monitoring and management. Oncologist. 2016;21(5):626‐633. [DOI] [PMC free article] [PubMed] [Google Scholar]
- 39. Farina M, D’Adda M, Schieppati F, et al. The impact of different BCR‐ABL1 transcript on outcome of Chronic myeloid leukemia (CML) patients: a monocentric real life experience”. Haematologica. 2017;102:(3).28255019 [Google Scholar]
- 40. D’Adda M, Farina M, Schieppati F, et al. An e13a2 type of BCR‐ABL transcript has a significant adverse impact on the achievement of a Sustained deep molecular response and on the maintenance of a treatment free remission after stopping tyrosine kinase inhibitors. Blood. 2017;130:1589. [Google Scholar]
- 41. Fava C, Varotto M, Berchialla P, et al. Droplet digital PCR may have a prognostic value for predicting relapse after imatinib discontinuation. Haematologica. 2016;101:449. [Google Scholar]
Associated Data
This section collects any data citations, data availability statements, or supplementary materials included in this article.
Supplementary Materials