

Abstract
Background:
Although there are limited studies, recent data are lacking to determine the prevalence of eye problems in Ethiopia accurately and there is no scientific evidence of such study in Sekela Woreda. The purpose of this study was to determine the prevalence of visual impairment among school children in Sekela Woreda, Ethiopia.
Methods:
The study design was a community-based analytical cross-sectional with a multi-stage cluster random sampling technique from September to November 2016.Visual acuity was tested using Snellen’s “E” chart while color vision was tested using Ishihara chart. The data were analyzed using SPSS version 20 software, and binary logistic regression was used to identify factors associated with visual impairment.
Results:
A total of 875 participants, 466 (53.3%) males and 409 (46.7%) females, with an age range of 8–18 years were screened for visual acuity and color vision deficiency. The prevalence of visual impairment (visual acuity ⩽ 6/12) in “either eye” was 70 (8.0%). Among these, 37 (52.9%) were males and 33 (41.1%) were females. The prevalence of low vision (visual acuity ) and blindness (visual acuity < 3/60) in “either eye” were 28 (3.2%) and 10 (1.1%), respectively. Thirty two (3.7%) had mild visual impairment . The prevalence of color vision deficiency was 36 (4.1%). Among these, 27 (3%) were males and 9 (1.1%) were females. The variables age (adjusted odds ratio (95% confidence interval) = 1.14 (1.01–1.28) and color blindness (adjusted odds ratio (95% confidence interval) = 3.93(1.69–9.09) were significantly associated with visual impairment.
Conclusion:
The prevalence of blindness and low vision in school children were higher than the national prevalence in Ethiopia. Increasing age and color defective vision were factors associated with the children’s visual impairment. The Woreda health office ought to work with responsible stakeholders to tackle the situation in early childhood.
Keywords: Prevalence, visual impairment, color blindness schoolchildren, Ethiopia
Background
The estimated number of people visually impaired in the world was 285 million in 2012.1 Unless marked improvements are made in numbers of healthcare personnel, infrastructure and services, it is estimated that 75 million people will be blind by the year 2020.2 The major cause of blindness in children varies widely from region to region, being largely determined by socioeconomic development, and the availability of primary health and eye care services.3
In Sub-Saharan Africa, refractive errors (REs), trachoma and vitamin A deficiency are the leading causes of visual impairment (VI).4 The prevalence of VI rises with poor economic and health care community services.
For example, in a population with good economic and health care services, the prevalence of blindness was about 0.25%, rising to 1.0% or more in populations with extremely poor economic and health care services.5 One study conducted in the United States, also showed that people with low vision had less income.6 VI has implications on the affected child and family influencing on educational, employment, personal, and social prospects of the child.7
In Ethiopia, the national prevalence of childhood blindness in the “better eye” was 0.1%.8 A study conducted among school children in Ethiopia, reported the prevalence of VI in “either eye” or both was 8.2%, 8.1%, and 9.5%, respectively.9–11
Studies showed that rural dwellers are more susceptible to VI and blindness.12 In studies conducted among primary school children in rural areas, the prevalence of VI, in at least one eye was found to be 10.2%, 4.8% and 5.9%.4,5,13 In Ethiopia, the childhood prevalence of blindness is unacceptably high and accounts for about 6% of the total blindness.14 Studies showed that family size significantly contributes to the increased risk of a more severe active trachoma sign.15
People with low educational status, living in rural areas and unemployment were more likely to have VI and blindness.12 A study conducted in Nigeria indicated that the risk of blindness doubled among illiterate participants.16 The high prevalence of trachoma could be associated with poor health-seeking behavior and lack of access to eye care services.17
Uncorrected RE was the most common cause of VI among school children in Brazil.5 Also, studies conducted in Ethiopia and India reported, 65.9that,11 92.5%,9 and 21.2%13 of VI were due to uncorrected REs.
The present study was conducted to determine the magnitude of VI among school children in Sekela Woreda, Amhara Regional State, Ethiopia. Determining the magnitude of VI will pave the way for stakeholders to address the problem early in childhood, which will have educational and behavioral benefits and prevent long-term visual disability. This study was also conducted to identify factors associated with VI and to design or recommend the possible solution to the problem.
Methods
This study was conducted in Sekela Woreda, Amhara Regional State, Ethiopia from September to November 2016. Sekela Woreda is one of the remotest areas in West Gojjam Zone, Amhara Regional State, North-West Ethiopia. A community-based analytical cross-sectional study design was conducted using a multi-stage cluster random sampling technique.
First, due to financial limitations, 3 primary schools among 44 were selected randomly using lottery methods in Sekela Woreda. Next, the total sample size was distributed proportionally based on their population size to the selected schools. Then the total samples of each school were again distributed to each grade (literacy level) proportionally. Finally, students in each grade were selected using systematic random sampling methods (Figure 1).
Figure 1.

Schematic representation of sampling techniques in three primary schools of Sekela, Ethiopia, 2016.
PSU: primary sampling unit; SSU: secondary sampling unit; SyRS: systematic random sampling.
All school children in Sekela Woreda were the source population and those who satisfied the study inclusion criteria were the study populations. For both visual acuity (VA) and color vision tests, all school children in the three primary schools from grade three to eight with an age range of 8–18 years were included in this study. For the VA test, students below grade three, students below 8 years and above 18 years of age were excluded.
All participants who underwent VA test did not undergo the color vision screening test. Participants who were bilaterally blind, participants with macular degeneration, and participants who could not read the numbers on the Ishihara chart were excluded from doing the color vision test. All remaining participants underwent both VA assessment and color vision screening.
The minimum required sample size for this study was obtained using a single proportion formula by taking the proportion of low vision 4.9% in Amhara Regional State8 with a design effect of four, possible maximum error of 0.03% and 95% confidence
where n is the sample size (795), P is the proportion of low vision in Amhara Region (0.049), Z = 1.96 at 95% confidence interval (CI), d is the possible maximum error/margin of error = 0.03, and g is the design effect.
The final sample size was estimated to be 875 with 10% adjusted non-response rate. Ethics approval was obtained from the Department Research, and Ethics Review Committee of Medical Physiology, School of Medicine, College of Health Science, Addis Ababa University. Legally authorized care-givers were invited to the school, and verbal informed consent was obtained to conduct the study. Information about the objectives and importance of the study was provided for both the care-givers and the participants.
There were no potential risks that may cause any harm to the participants. All information, which was communicated with the participants was kept private and confidential. Coding and aggregate reporting was used to eliminate respondents’ identification and ensure anonymity, and the data was not transferred to any third party and was used only for the research purpose to ensure confidentiality.
Monocular VA testing was performed using Snellen’s tumbling “E” chart at 6 m distance from the participant in natural day-light room illumination. The right eye was tested first followed by the left eye. The eye not being tested was covered with the participant’s hand, ensuring that the participant was not pressing his or her eye. Before starting the test, participants were advised that they had 3 s to correctly identify the orientation of the symbols which were presented to them.
The study optometrist performed the following procedures: eye examination by using a pinhole (for REs), torch (for corneal opacity test), and ophthalmoscopy to examine the lens, and vitreous body. External eye diseases were identified by external eye examination. Other causes for VI which has not been identified by an optometrist were diagnosed by a senior ophthalmologist in Debre Markos Referral Hospital.
According to the International Classification of Diseases Version 10 (ICD-10), classification of VA impairment, the participants in this study were considered to be visually impaired when their VA was 6/12 or worse in “either eye.” Participants with VA worse than 6/12 in “either eye” were re-examined using a pinhole test to indicate if an uncorrected RE was present. When pinhole vision improved to better than 6/12, participants were recorded as needing glasses and were given a referral slip to the nearest hospital for refraction.
The color vision screening test was conducted using Ishihara color plates (24-plate edition). Plates 1–15 were presented to determine the normality or defectiveness of color vision. Color vision was recorded as normal if the numbers on 13 or more plates were correctly identified. When nine or fewer plates read correctly, the color vision was said to be deficient. Plate numbers 16 and 17 were used to determine the presence of protanopes and deuteranopes (Ishihara 24-plate edition guideline). In order to collect information associated with VI, families of participants with VI were asked about their educational status, income, and attitudes about how to care their child’s eyes (Table 1).
Table 1.
The socio-demographic features of caregivers of children with VI in the three primary schools of Sekela Woreda, Ethiopia, 2016.
| Educational background of the head of house hold | Number (%) | Income/month in Ethiopian birr | Number (%) |
|---|---|---|---|
| Illiterate | 47 (67.2%) | 700–1500 | 11 (15.7%) |
| Read and write | 15 (21.4%) | 1501–2500 | 29 (41.4%) |
| Elementary school | 5 (7.1%) | 2501–3500 | 20 (28.6%) |
| Secondary school | 3 (4.3%) | 3501–4500 >4500 |
5 (7.1%) 5 (7.1) |
| Occupation of head of house hold | Number (%) | Family size (number) | Number (%) |
| Farmer | 54 (77.2%) | 2–5 | 25 (35.7%) |
| Government employee | 4 (5.7%) | 6–9 | 39 (55.7%) |
| Merchant | 11 (15.7%) | 10-12 | 6 (8.6%) |
| Others | 1 (1.3%) | 13-14 | – |
| Father Self-reported eye diseases | Number (%) | Mother self-reported eye diseases | Number (%) |
| Yes | 15 (20.4%) | Yes | 19 (32.7%) |
| No | 55 (79.6%) | No | 51 (67.3%) |
| Awareness of their children’s eye defect | Number (%) | Visit to clinic | Number (%) |
| Yes | 39 (55.7%) | Yes | 11 (15.7%) |
| No | 31 (44.3%) | No | 59 (84.3%) |
| Positive family history | Number (%) | Care for their child | Number (%) |
| Yes | 25 (35.7%) | Yes | 3 (4.3%) |
| No | 45 (64.3%) | No | 67 (95.7%) |
The data were collected using structured investigator-administered questionnaires, which were prepared following research and consultation with experienced experts in the subject area (see Supplemental material). The questionnaire was pre-tested in pilot study before data collection. The data were entered directly in to the Statistical Package for Social Science (SPSS) version 20 software, cleared and checked for completeness and accuracy before analysis was performed. Frequency distribution and graphs were used to describe the study variables. Multiple binary logistic regression model was used to assess factors associated with VI. An adjusted odds ratio (AOR) was used as a measure of association, and all variables with a p-value < 0.05 were considered as significantly associated with VI.
Operational definitions
Childhood blindness. Presenting VA of < 3/60 in the better eye.14
VI. Presenting VA of ⩽ 6/12 in the better eye to 3/60.14
Low vision. Presenting VA of ≤ in the better eye14 (ICD-10).
Normal VA. A presenting VA of >6/12 in the better eye14 (ICD-10).
School children. Individuals whose age is ⩾8 and ⩽18 years of old.14
Color blindness. If nine or fewer plates are read normally out of 24, the color vision is regarded as color blind (24-Plate edition guide line).
Results
All of the total sample size (n = 875) participated in the study giving a response rate of 100%. The study participants had a mean age of 13.3 years with a standard deviation of ± 2.1 years, which ranged from 8–18 years. There were 70 (8.0%) school children with VI, VA ⩽ 6/12. Among these, 37 (52.9%) were males, and 33 (47.1%) were females. The distributions of bilateral and unilateral VI with respect to sex are presented in (Table 2). The socio-demographic features of participants with VI were assessed to identify factors associated with VI (Table 1).
Table 2.
Sex based distributions of bilateral and unilateral visual impairment in the three primary schools of Sekela Woreda, Ethiopia, 2016.
| Visual acuity | Sex |
Total |
|||
|---|---|---|---|---|---|
| M | F | % (n = 70) | % (N = 875) | ||
| ⩽6/12 to ⩾6/18 | Bilateral | 8 (11.4%) | 14 (20%) | 22 (31.4%) | 2.5 |
| Unilateral | 11 (15.7%) | 9 (12.9%) | 20 (28.9%) | 2.3 | |
| Total | 19 (27.1%) | 23 (32.9%) | 42 (60%) | 4.8 | |
| ⩽6/36 to ⩾6/60 | Bilateral | 5 (7.1%) | 2 (2.9%) | 7 (10%) | 0.8 |
| Unilateral | 5 (7.1%) | 6 (8.6%) | 11 (15.7%) | 1.3 | |
| Total | 10 (14.2%) | 8 (11.5%) | 18 (25.7%) | 2.1 | |
| <3/60 to LP | Bilateral | – | – | – | – |
| Unilateral | 1 (1.4%) | – | – | – | |
| Total | 1 (1.4%) | – | 1 (1.4%) | 0.1 | |
| LP | Bilateral | 2 (2.9%) | 1 (1.4%) | 3 (4.3%) | 0.3 |
| Unilateral | 1 (1.4%) | – | 1 (1.4%) | 0.1 | |
| Total | 3 (4.3%) | 1 (1.4%) | 4 (5.7%) | 0.4 | |
| NLP | Bilateral | 1 (1.4) | – | 1(0.1) | 0.1 |
| Unilateral | 3 (4.3%) | 1 (1.4%) | 4 (5.7%) | 0.5 | |
| Total | 4 (5.7%) | 1 (1.4%) | 5 (7.1%) | 0.6 | |
| Grand total | 37 (52.9%) | 33 (47.1%) | 70 (100%) | 8.0 | |
LP: light perception; NLP: no light perception; M: male; F: female.
The prevalence of childhood blindness in “either eye” was 10 (1.1%) (Table 3). Uncorrected RE was the leading cause of VI in 33 (47.1%) participants followed by allergy 8 (11.4%), other corneal opacity 8 (11.4%), uveitis 4 (5.7%), retinitis pigmentosa 3 (4.3 %), amblyopic or “lazy eye” 2 (2.9%), strabismus 2 (2.9%), pterygium 2 (2.9%), nystagmus 1 (1.4%), and others or idiopathic causes were found in 7 (10%) participants (Figure 2). Thirty six (4.1%) participants had color defective vision, 27 (3%) males and 9 (1.1%) females. Fifteen participants (1.7%) were categorized as deutan, 7 (0.8%) as protan and 14 (1.6%) were found to be combined (unclassified) forms (Figure 3).
Table 3.
Distributions of presenting visual acuity in either eye in the three primary schools of Sekela Woreda, Ethiopia, 2016.
| Presenting VA | ICD-10 categories | WHO classification | Children with VI in the two age
groups |
Total | % N (875) | |||
|---|---|---|---|---|---|---|---|---|
| 8–13 | 14–18 | |||||||
| NLP | Blind | Blind | LV | 1 | 4 | 5 | 0.6 | 1.1 |
| LP | 1 | 3 | 4 | 0.4 | ||||
| LP | 1 | – | 1 | 0.1 | ||||
| 6/60 | Severe VI | Moderate VI | LV | 4 | 3 | 7 | 0.8 | 2.1 |
| 6/36 | Moderate VI | Moderate VI | LV | 1 | 10 | 11 | 1.3 | |
| ≤ 6/12 to | Mild VI | Normal vision | 22 | 20 | 42 | 4.8 | 4.8 | |
| Total | 30 | 40 | 70 | 8.0 | 8.0 | |||
VA: visual acuity; VI: visual impairment; NLP: no light perception; LP: light perception; WHO: World Health Organization; N: number; ICD: International Classifications of Diseases; LV: Low Vision.
Figure 2.
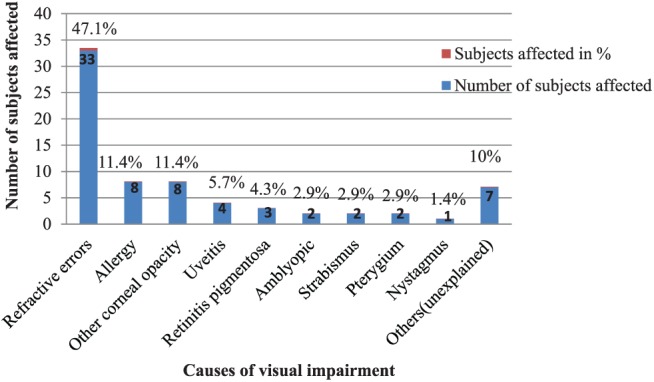
The major causes of visual impairment among school children in the three primary schools of Sekela Woreda, Ethiopia, 2016.
Figure 3.
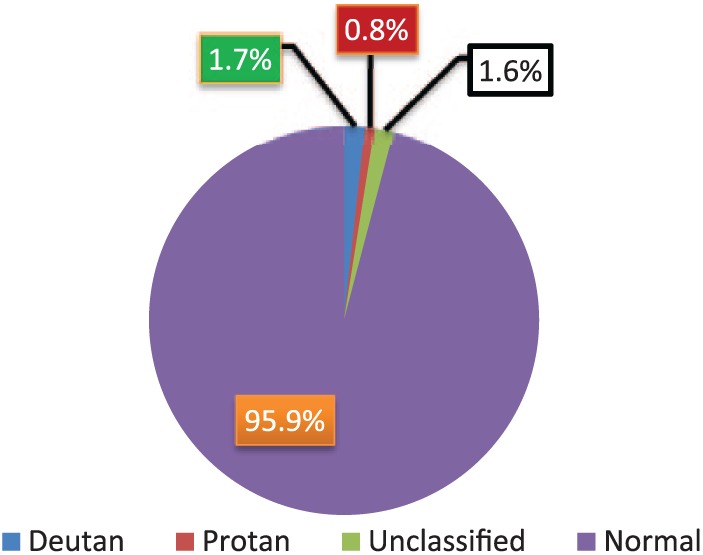
Distributions of color vision deficiency among school children in the three primary schools of Sekela Woreda, Ethiopia, 2016.
In the present study, the variables age (AOR = 1.14; 95% CI, 1.01–1.28; p-value = 0.034) and color vision deficiency (AOR = 3.93; 95% CI, 1.69–9.09; p-value = 0.001) were significantly associated with VI. The chances of participants with defective color vision being visually impaired were 3.93 times higher than those with normal color vision. A unit increase in age increased the chance of getting VI by 14%. There was no significant association between VI and sex of the participants (AOR = 0.76; 95% CI, 0.45–1.28; p-value = 0.31) (Table 4).
Table 4.
Binary logistic regression analysis of factors associated with VI among schoolchildren in the three primary of Sekela Woreda, Ethiopia, 2016.
| Variables associated with VI | Status of visual acuity |
OR (95% CI) | p-value | ||||
|---|---|---|---|---|---|---|---|
| Normal |
Impaired |
||||||
| n, % | n, % | ||||||
| Sex | M | 429 | 49.1% | 37 | 4.2% | 0.76 (0.45–1.28) | 0.31 |
| F | 376 | 42.9% | 33 | 3.8% | 1 | ||
| Age | 8–18 | 875 | 92% | 70 | 8.0% | 1.14 (1.01–1.28) | 0.034* |
| Grade | 3–8 | 805 | 92% | 70 | 8.0% | 0.85 (0.67–1.06) | 0.15 |
| Color vision | Normal | 777 | 88.8% | 62 | 7.1% | 1 | 0.001** |
| Blind | 28 | 3.2% | 8 | 0.9% | 3.93 (1.69–9.09) | ||
VI: visual impairment; CI: confidence interval; OR: odds ratio.
All variables with a p-value of <0.05 CI was considered as significantly associated with VI. *Significant at 5% level of significance and **significant at 1% level of significance, 1 = reference. The results of the multiple logistic regression analysis revealed that the variables age, and color visions were significantly associated with VI at 5% level of significance, a p-value < 0.05.
Discussion
VI is one of the major public health problems in the world. VI has implications on the affected child and family influencing the educational, employment, personal, and social prospects of the child.7 If due emphasis is not given and marked improvements are not made in the numbers of healthcare personnel and infrastructure and services provided, it is estimated that 75 million will have been blind by the year 2020.2
This study was conducted in a rural and remote area with no adequate health care and primary eye care service. In the present study, the magnitude of VI was found to be 70 (8%); out of these 37 (52.9%) were males and 33 (47.1%) were females. The overall prevalence of color vision deficiency was 36 (4.1%); of which, 15 (1.7%) were deutan, 7 (0.8%) were protan, and 14 (1.6%) were combined (unclassified) forms.
Previous studies showed that low awareness and low socioeconomic status are associated with VI.6,10,12,16,17 Apart from the financial challenges of paying for treatment, there are other indirect costs associated with traveling to health facilities which poor people cannot afford.18 As indicated in Table 1, the majority of care-givers of children with VI had low estimated income, that is, 85% of them earned less than 19 birr per day. According to the national policy of Ethiopia, if one individual earns less than 19–20 birr per day, it is said to be below the poverty line.
Of the 39 (55.7%) care-givers, who were aware of their children’s eye problems, only 11 (15.7%) visually impaired children previously visited the clinic (Table 1), possibly due to socio-economic problems. Furthermore, the majority of care-givers of visually impaired children in this study were farmers and illiterate (Table 1). This aligns with a previous study which revealed that people with low educational status, living in rural areas and unemployed were more likely to be visually impaired or blind.12 Another study conducted in Nigeria showed that the risk of being blind was doubled for participants who were illiterate.16
The prevalence of blindness and low vision in the present study was lower than the national prevalence in Ethiopia;14 possibly due to the younger age group involved in the present study, as the national prevalence includes all age groups. But the present study findings for VI was comparable with studies done in other parts of Ethiopia.9,10,19 However, in the present study, the overall prevalence of childhood blindness was higher than the national prevalence of childhood blindness in Ethiopia, that is, 0.1%.8 Possibly this may be due to low socioeconomic status, low awareness and inadequate infrastructures.
In the present study, the leading cause of VI was uncorrected REs, 33(47.1%). This was similar to previous studies conducted in Ethiopia9,11 and India.13 In line with a previous study,5 the present study found allergy was associated with VI. However, the association between VI with retinitis pigmentosa found in the present study was not a common cause in other studies involving school children.19
The prevalence of amblyopia (best corrected visual acuity [BCVA] ⩽ 6/12 in at least one eye associated with vertical tropia at 0.5 m (strabismic amblyopia)) found in the present study was 0.22%, with 2.9% of the visually impaired children found to be amblyopic. This finding was in line with studies involving school-age children in Africa (0.28%) and in Nepal (0.35%).20 In the present study, there was a significant association between age and VI. This was similar to the studies conducted in other parts of Ethiopia.9,10,14,21
As age increased by one unit, the chance of VI increased by 14%. This was similar to previous studies conducted in Ethiopia.8–10,14,21 Color vision deficiency was also significantly associated with VI, which is in line with another study.22 This study revealed that gender was not associated with VI in line with a previous study in Ethiopia.9
Limitations of the study
Due to resource and time limitations, children who passed the screening test were not invited to continue with study and hence the cycloplegic diagnosis was not conducted. In the study setting the available color vision testing chart was Ishihara 24-plate edition which is a color perception test for red-green color deficiencies. The Ishihara test does not check for tritanopia, however, tritanopia is exceedingly rare (less than 0.008% prevalence). Hence, the Ishihara test is an appropriate and widely used test in clinical practice.
Conclusion
The prevalence of childhood blindness in Sekela Woreda was significantly higher than the national childhood prevalence in Ethiopia. Uncorrected RE was the leading cause of VI. Increasing age and color defective vision were factors associated with the children’s VI. Screening children’s vision at the time of school admission, and further periodical eye examinations are recommended for early diagnoses of impaired vision in school children. The Ministry of Health, Ministry of Education and other stakeholders should give consideration to rural and remote areas, like Sekela Woreda to prevent and treat the burden of eye problems in early childhood.
Supplemental Material
Supplemental material, Questionnaires_as_a_supplementary_material for Prevalence of visual impairment among school children in three primary schools of Sekela Woreda, Amhara regional state, north-west Ethiopia by Mengistu Zelalem, Yekoye Abebe, Yilikal Adamu and Tewodros Getinet in SAGE Open Medicine
Acknowledgments
The authors would like to thank SekelaWoreda administration, respective offices and school directors, teachers for their cooperation during data collection, and above all, they are indebted to the study participants for their kind cooperation.
Footnotes
Author contributions: Mengistu Zelalem Wale wrote the proposal, participated in data collection. Mengistu Zelalem Wale and Tewodros Getinet analyzed the data and drafted the paper. Yekoye Abebe and Yilikal Adamu approved the paper with some revisions and participated in data analysis with Mengistu Zelalem Wale and Tewodros Getinet. All the authors revised the subsequent drafts of the paper, read and approved the final manuscript.
Availability of data and materials: We have sent all the available data, and we do not want to share the raw data as we are doing related study.
Declaration of conflicting interests: The author(s) declared no potential conflicts of interest with respect to the research, authorship, and/or publication of this article.
Ethical approval: The Department Research and Ethics Review Committee of Medical Physiology, School of Medicine, College of Health Science, Addis Ababa University provided ethics approval. The ethical review letter was issued with a reference no of phy/82/2016 on August 15/2016.
Funding: The author(s) received no financial support for the research, authorship, and/or publication of this article.
Informed consent: After information was explained about the objectives and importance of the study, verbal informed consent was obtained from the caregivers (guardians) before eye examination. Since we did not have intervention procedures like surgery or drug administration, our study did not need written consent from adult guardians. We have done only routine eye examination or routine school eye screening. There were no potential risks that may cause any harm in children in any case. This verbal consent was approved by the ethics committee of Department of Medical physiology, Addis Ababa University, Ethiopia. The guardians were legally authorized representative of the minor subjects.
Supplemental material: Supplemental material for this article is available online.
ORCID iD: Tewodros Getinet  https://orcid.org/0000-0002-6525-754X
References
- 1. World Health Organization. Global data on visual impairments. In: Global data final for web. Geneva: World Health Organization, 2012, pp. 1–6. [Google Scholar]
- 2. Courtright P, West SK. Contribution of sex-linked biology and gender roles to disparities with trachoma. Emerg Infect Dis 2004; 10(11): 2012–2016. [DOI] [PMC free article] [PubMed] [Google Scholar]
- 3. Gilbert C, Foster A. Childhood blindness in the context of vision 2020: the right to sight. Bull World Health Organ 2001; 79(3): 227–232. [PMC free article] [PubMed] [Google Scholar]
- 4. Wedner S, Ross D, Balira R, et al. Prevalence of eye diseases in primary school children in a rural area of Tanzania. Br J Ophthalmol 2000; 84(11): 1291–1297. [DOI] [PMC free article] [PubMed] [Google Scholar]
- 5. Salomão SR, Mitsuhiro MR, Belfort R., Jr. Visual impairment and blindness: an overview of prevalence and causes in Brazil. An Acad Bras Cienc 2009; 81(3): 539–549. [DOI] [PubMed] [Google Scholar]
- 6. Frick KD, Gower EW, Kempen JH, et al. Economic impact of visual impairment and blindness in the United States. Arch Ophthalmol 2007; 125(4): 544–550. [DOI] [PubMed] [Google Scholar]
- 7. Rahi JS, Dezateux C. Epidemiology of visual impairment in Britain. Arch Dis Child 1998; 78(4): 381–386. [DOI] [PMC free article] [PubMed] [Google Scholar]
- 8. Berhane Y, Worku A, Bejiga A, et al. Prevalence and causes of blindness and low vision in Ethiopia. Ethiopian J Health Dev 2007; 21(3): 204–210. [Google Scholar]
- 9. Kassa T, Alene GD. Prevalence of refractive errors in pre-school and school children of Debark and Kola Diba towns, North-western Ethiopia. Ethiopian J Health Dev 2003; 17(2): 117–121. [Google Scholar]
- 10. Zelalem M, et al. School of Medicine, Department of Physiology Visual Status of School Children in Sekela Woreda, Amhara Regional State, Approved by Examining Board. 2017, http://etd.aau.edu.et/bitstream/handle/123456789/6398/Mengistu%20Zelalem.pdf?sequence=1&isAllowed=y (accessed 8 December 2018).
- 11. Mehari ZA, Yimer AW. Prevalence of refractive errors among school children in rural central Ethiopia. Clin Exp Optom 2013; 96(1): 65–69. [DOI] [PubMed] [Google Scholar]
- 12. Rim TH, Nam JS, Choi M, et al. Prevalence and risk factors of visual impairment and blindness in Korea: the Fourth Korea National Health and Nutrition Examination Survey in 2008-2010. Acta Ophthalmol 2014; 92(4): e317–e325. [DOI] [PubMed] [Google Scholar]
- 13. Datta A, Bhardwaj N, Patrikar SR, et al. Study of disorders of visual acuity among adolescent school children in Pune. Med J Armed Forces India 2009; 65(1): 26–27. [DOI] [PMC free article] [PubMed] [Google Scholar]
- 14. Berhane Y, Worku A, Bejiga A. National survey on blindness, low vision and trachoma in Ethiopia. Addis Ababa, Ethiopia: Federal Ministry of Health of Ethiopia, 2006, pp. 1–10. [Google Scholar]
- 15. Ngondi J, Gebre T, Shargie EB, et al. Risk factors for active trachoma in children and trichiasis in adults: a household survey in Amhara Regional State, Ethiopia. Trans R Soc Trop Med Hyg 2008; 102(5): 432–438. [DOI] [PubMed] [Google Scholar]
- 16. Kyari F, Gudlavalleti MV, Sivsubramaniam S, et al. Prevalence of blindness and visual impairment in Nigeria: the national blindness and visual impairment survey. Invest Ophthalmol Vis Sci 2009; 50(5): 2033–2034. [DOI] [PubMed] [Google Scholar]
- 17. Mesfin MM, Camera J, Tareke IG, et al. A community-based trachoma survey: prevalence and risk factors in the Tigray region of northern Ethiopia. Ophthalmic Epidemiol 2006; 13(3): 173–181. [DOI] [PubMed] [Google Scholar]
- 18. Jaggernath J, Øverland L, Ramson P, et al. Poverty and eye health. Scientific Research Publishing Inc., 2014, pp. 2–3. [Google Scholar]
- 19. Teshome T. Prevalence and causes of blindness in Merhabete, North Shoa, Ethiopia. Ethiopian J Health Dev 2002; 16(1): 71–72. [Google Scholar]
- 20. Xiao O, Morgan IG, Ellwein LB, et al. ; Refractive Error Study in Children Study Group. Prevalence of amblyopia in school-aged children and variations by age, gender, and ethnicity in a multi-country refractive error study. Ophthalmology 2015; 122(9): 1924–1931. [DOI] [PMC free article] [PubMed] [Google Scholar]
- 21. Melese M, Alemayehu W, Bayu S, et al. Low vision and blindness in adults in Gurage Zone, central Ethiopia. Br J Ophthalmol 2003; 87(6): 677–680. [DOI] [PMC free article] [PubMed] [Google Scholar]
- 22. Simunovic MP. Color vision deficiency. Eye 2010; 24(5): 747–752. [DOI] [PubMed] [Google Scholar]
Associated Data
This section collects any data citations, data availability statements, or supplementary materials included in this article.
Supplementary Materials
Supplemental material, Questionnaires_as_a_supplementary_material for Prevalence of visual impairment among school children in three primary schools of Sekela Woreda, Amhara regional state, north-west Ethiopia by Mengistu Zelalem, Yekoye Abebe, Yilikal Adamu and Tewodros Getinet in SAGE Open Medicine