Abstract
Noise-induced hearing loss leads to anatomic and physiologic changes in primary auditory cortex (A1) and the adjacent dorsal rostral belt (RB). Since acetylcholine is known to modulate plasticity in other cortical areas, changes in A1 and RB following noise damage may be due to changes in cholinergic receptor expression. We used [3H]scopolamine and [18F]flubatine binding to measure muscarinic acetylcholine receptor (mAChR) and nicotinic acetylcholine receptor (nAChR) expression, respectively, in guinea pig A1 and RB 3 weeks following unilateral, left ear noise exposure, and a temporary threshold shift in hearing. [3H]Scopolamine binding decreased in right A1 and RB (contralateral to noise) compared to sham controls across all cortical layers. [18F]Flubatine binding showed a nonsignificant upward trend in right A1 following noise but only significantly increased in right RB and 2 layers of left RB (ipsilateral to noise). This selective response may ultimately influence cortical plasticity and function. The mechanism(s) by which cholinergic receptors are altered following noise exposure remain unknown. However, these data demonstrate noise exposure may differentially influence mAChRs that typically populate interneurons in A1 and RB more than nAChRs that are traditionally located on thalamocortical projections and provide motivation for cholinergic imaging in clinical patient populations of temporary or permanent hearing loss.
Keywords: autoradiography, hearing loss, muscarinic receptors, nicotinic receptors, radioligand binding
Introduction
Hearing loss is a growing problem, particularly among the elderly individuals, that often leads to long-term challenges with auditory rehabilitation.1,2 It is estimated that more than 10% of the US population, and a similar fraction worldwide, have some aspect of hearing loss. A better understanding of the biochemical characteristics of conditions such as presbycusis (age-related hearing loss) might aid in development of new approaches to treatment and lifestyle improvements for afflicted patients. We therefore wished to explore whether molecular imaging could be utilized to better understand the mechanisms underlying hearing loss following noise damage.
Noninvasive neuroimaging of human primary auditory cortex (A1) in hearing loss have utilized computed tomography, functional magnetic resonance imaging, positron emission tomography, electroencephalography, and magnetoencephalography.3,4 Positron emission tomography studies have, with one exception, centered on measurements related to glucose metabolism (fludeoxyglucose)5 or blood flow ([15O]H2O).6 A single study has reported the specific binding of a targeted radiotracer, [18F]ADAM, to the brain serotonin transporter in a rat model of noise-induced hearing loss.7 That study demonstrated a widespread reduction in specific binding of the radioligand throughout the brain but provided no insights into changes in A1 that might be directly contributing to the development of hearing loss.
The effects of peripheral ear damage and resultant hearing loss on central auditory circuits have been increasingly investigated. A1 reveals increased neural spontaneous firing rates (SFRs)8 and enhanced neural synchrony (NS) following permanent (PTS) or temporary thresholds shifts (TTS).9 We recently demonstrated these physiologic changes were responsive to bimodal (somatosensory–auditory) stimulation in guinea pig A1.10 Depending on pairing order and interval of the bimodal stimulation, SFRs and NS were differentially responsive; a process consistent with stimulus-timing–dependent plasticity,10,11 the macromolecular correlate of spike-timing dependent plasticity (STDP); and the up- or downregulation of neural firing depending on pre- or postsynaptic stimulation order. Interestingly, bimodal effects on SFRs and NS were also observed in rostral belt (RB); an adjacent cortical auditory associative region thought to influence A1 firing properties.11,12 These data suggest that noise damage alters firing properties in A1 and associative RB that may ultimately change how neurons respond to auditory and nonauditory sensory stimuli.
The human cerebral cortex (including A1) has a widespread and heterogeneous distribution of receptors for a variety of neurotransmitters.13 It is thought that observed physiologic plasticity in A1 and RB following noise damage may, in part, reflect underlying changes in cholinergic (acetylcholine; ACh) receptor expression and receptor-mediated linkage.14 Cholinergic receptors are widely distributed throughout the brain and have been shown to modulate STDP in other brain regions, including the visual and somatosensory cortices.15-17 Muscarinic receptor (mAChR) activation has been shown to influence visual cortex through STDP,18 while stimulation of nicotinic receptors (nAChR) inhibited STDP mechanisms in prefrontal cortex.19 Given that mAChRs are upregulated in the auditory pathway after cochlear damage,20 it is possible that plasticity within the cholinergic system exists and may influence A1 and RB following noise exposure.
Both nAChRs and mAChRs have been shown to influence A1 neuronal plasticity through either direct receptor-mediated linkage or via other neurotransmitter release, like glutamate, that can lead to long-term changes in neural plasticity.21,22 Nicotinic receptors are inotropic, heterogeneous cationic channels composed of varying combinations of α (α2-α10) and β (β2-β4) subunits.23 They are widely distributed throughout the central nervous system (CNS) and are typically found on thalamocortical projections and pre- and postsynaptic terminals as well as dendrites and cell bodies.24 Alternatively, mAChRs are more abundant in the CNS and are well characterized.25 Muscarinic receptors are G-protein–coupled receptor consisting of 5 subtypes (M1-M5) that are distinctly distributed throughout the brain and located largely on cortical interneurons.26 Despite differential locations within the central auditory circuits, both nAChR and mAChRs are in position to influence central auditory processing and plasticity following noise damage. Partial or complete hearing loss following noise exposure leads to increased neural responsiveness and sensory reorganization within A1.27 However, little is known about the role of ACh in A1 and RB and how the expression of such receptors is altered following noise damage.
Positron emission tomography and specific radioligands are a potential noninvasive method to examine acute- and long-term changes of neurotransmitter receptors in A1. The present study investigated A1 and RB using highly sensitive radioligand-binding techniques in a guinea pig model of noise exposure and TTS in hearing.28 [3H]Scopolamine was used to map mainly M1 subtypes (the most common in cortex)29,30 and [18F]flubatine to map the α4β2 nAChR subtype.31-33 Both [3H]scopolamine and [18F]flubatine bind with high affinity to their respective receptor subtypes.34 By characterizing mAChR and nAChR expression in A1 and RB following TTS in hearing, this study investigated anatomic changes in cholinergic receptors that may contribute to mechanisms that lead to noise-induced plasticity.
Materials and Methods
Noise Exposure and Tissue Preparation
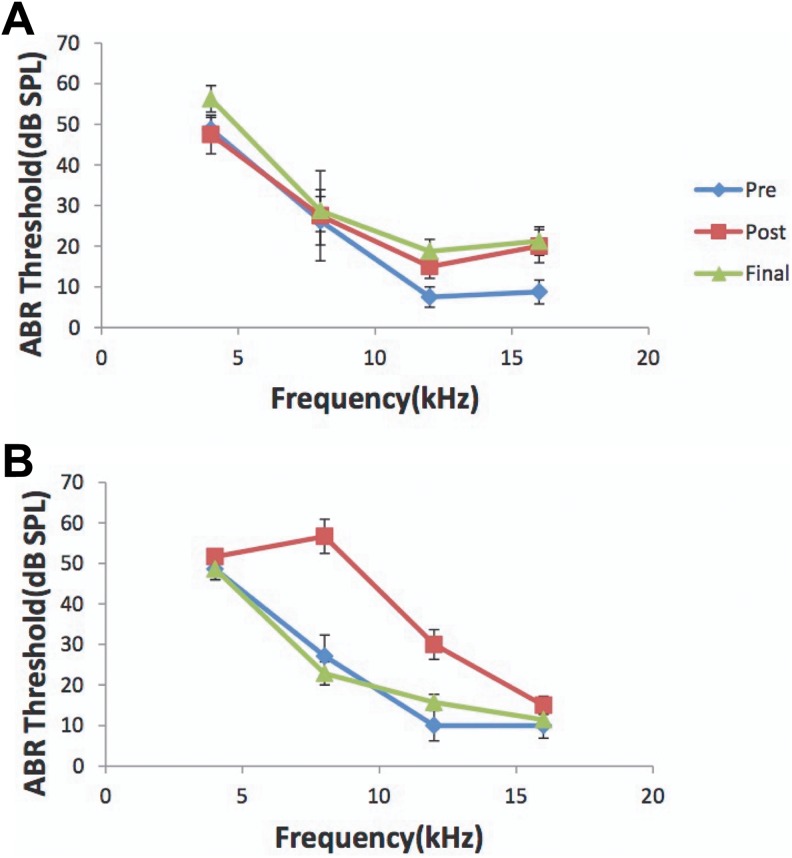
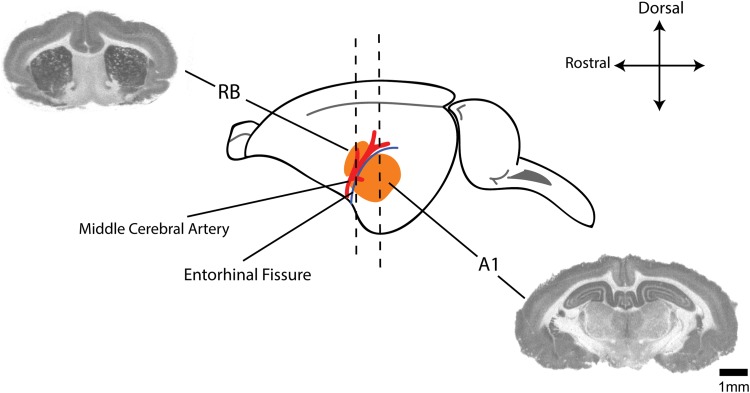
To avoid any potential confounding effects on the data of this pilot study, all experiments were performed on mature, female, pigmented guinea pigs (n = 9; 250-350 g; Elm Hill colony). All procedures were performed in accordance with the National Institutes of Health Guidelines for the Use and Care of Laboratory Animals and approved by the Institutional Animal Care and Use Committee at the University of Michigan. Auditory brain stem responses (ABRs) were recorded to confirm normal hearing prior to a 2-hour unilateral noise exposure (97 dB noise with ¼ octave band centered at 7 kHz) to the left ears (Figure 1; pre). Animals were anesthetized with ketamine (40 mg/kg) and xylazine (10 mg/kg) during noise exposure (n = 5) or anesthesia only for sham controls (n = 4). A second ABR was recorded immediately after the noise exposure to confirm a TTS in ABR thresholds (at 4, 8, 12, and 16 kHz; Figure 1; post). Animals recovered for 3 weeks after which a third ABR was recorded to confirm normalization of hearing thresholds (Figure 1; final). We chose 3 weeks recovery time after noise exposure to perform these studies, as we have shown that interval period after a noise-induced TTS is adequate for normalization of auditory thresholds and the generation of tinnitus perception to be detected behaviorally and therefore may be present in these animals.10 Animals were killed and brains removed and snap frozen in isopentane at −20°C and stored at −80°C until cryo-sectioning. Based on anatomic coordinates and landmarks (Figure 2) including the middle cerebral artery and entorhinal fissure,12,35,36 coronal sections (20 µm) through anterior–posterior extent of RB and A1 were separately harvested on a cryostat and mounted on poly-l-lysine–coated slides and stored at −80°C until processed for radioligand binding.
Figure 1.
Noise exposure leads to a TTS. Noise exposed. ABR thresholds (dB SPL) across the tested frequencies (4, 8, 12, and 16 kHz) for the sham and noise-exposed group. A, ABR thresholds for sham controls that only received anesthesia and no noise exposure. Note no changes in thresholds after anesthesia (post) when compared to baseline (pre) and 3 weeks later at the time of physiology recordings (final). B, Note the normal baseline response prior to noise (pre; solid line) and the 15- to 35-dB increase in threshold immediately after unilateral noise exposure (post; dashed line) that normalizes 3 weeks later at the time of physiology recordings (final; dotted line) confirming the TTS. ABR indicates auditory brainstem responses; TTS, temporary thresholds shift.
Figure 2.
Anatomical distribution of regions of interest. Schematic showing anatomic relationship between the dorsal rostral belt (RB) and primary auditory cortex (A1; both in orange) including middle cerebral artery (red) and the entorhinal fissure (blue line) as gross anatomic landmarks.35,36 Accompanied are autoradiographic coronal sections through representative areas used for RB and A1 binding analysis.37 Scale bar represents 1-mm increments.
[3H]Scopolamine Receptor Autoradiography
Slides with mounted sections of A1 and RB for both noise-exposed and sham controls were prewashed in phosphate-buffered saline-EDTA (PBS-EDTA; pH 7.4 at 25°C) for 5 minutes and subsequently incubated in PBS-EDTA (pH 7.4) with [3H]scopolamine (molar activity = 84.1 Ci/mmoL; PerkinElmer (Waltham, Massachusetts); NET636250UC) at a final concentration of 5 nM for 30 minutes (at 25°C). The sections were then rinsed twice each for 5 minutes in PBS-EDTA (pH 7.4 at 4°C) and then in deionized water for 5 seconds. Sections were dried at room temperature overnight before being opposed to a tritium phosphoimager (Fuji) plate for 72 hours.
[18F]Flubatine Receptor Autoradiography
[18F]Flubatine was synthesized at the University of Michigan, Division of Nuclear Medicine, as previously described.31 Frozen-mounted brain sections were rehydrated in PBS-EDTA (pH 7.4 for 5 minutes at room temperature) and then incubated in 0.5 nM (molar activity = 5564 Ci/mmoL) [18F]flubatine for 30 minutes. Brain sections were washed twice for 2.5 minutes in PBS-EDTA (pH 7.4 at 4°C) and then rinsed in deionized H2O and air-dried. The slides were then opposed to a phosphoimager screen (Fuji) for 10 minutes, along with known concentrations of [18F]flubatine solution aliquots to serve as controls and to formulate a binding curve. Densitometry was performed (Typhoon FLA 7000 and ImageQuant), and results for both radioligands were exported to Excel and then further analyzed in Matlab.
Optical Density and Statistical Analysis
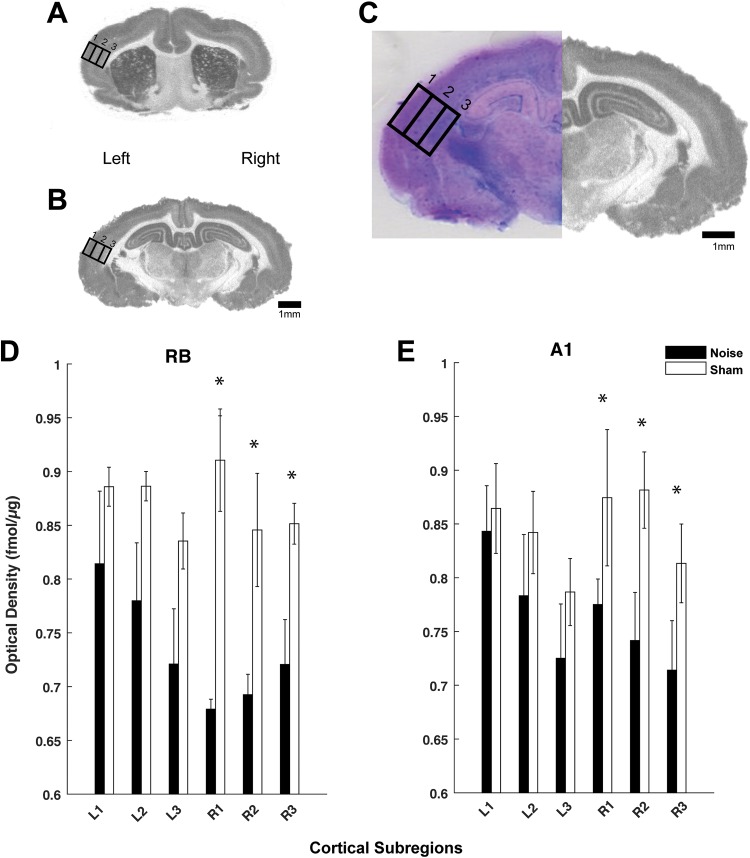
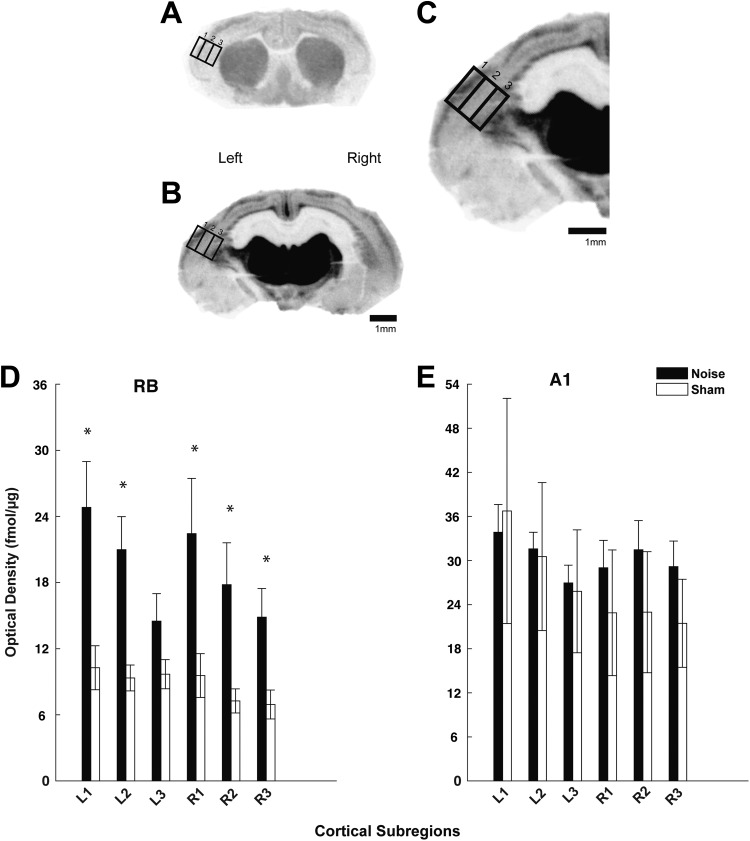
To better stratify mAChR and nAChR changes across the cortical layers in both hemispheres, optical density was measured in 3 separate subregions (supragranular, granular, and infragranular) within A1 and RB and analyzed (ImageQuant/GE Healthcare, Chicago, Illinois). The subregions were based on anatomic dimensions of the 3 recognized compartments and isolated by dividing the cortical area into thirds,36 confirmed by Giemsa-counterstained sections (Figure 3C). Giemsa when used to stain nervous tissue combines the properties of Nissl stain and provides ideal results for counterstaining autoradiographic sections.37 Specifically, binding for [3H]scopolamine (Figure 3) and [18F]flubatine (Figure 5) was analyzed using a standardized area of analysis (rectangle) placed over each subregion (Figures 3C and 5C). Autoradiographic images reveal representative sections from RB and A1 (Figures 3 and 5). Levels of section (A1 and RB) were determined using anatomical coordinates35,36 and landmarks as noted.38 Receptor density was calculated from co-exposed standards (considering background) and converted to fmol/μg protein using a standard curve. Once conversions were completed and background noninterference was verified, results were expressed at standard deviations evaluated using a 2-way analysis of variance and Tukey-Kramer post hoc correction in Matlab.
Figure 3.
mAChR expression is decreased in A1 and rostral belt (RB)following noise exposure. Autoradiographic images showing [3H]scopolamine binding in representative coronal sections through RB (A) and A1 (B) on left (noise exposed) and right hemispheres. Panel C shows a high magnification view of A1 (of panel B) with standardized areas of analysis drawn over the 3 cortical subregions: supragranular (1), granular (2), and infragranular (3) with Giemsa counterstained image to verify layers. Quantified optical density measures for [3H]scopolamine binding are shown in the bar graphs for both the RB (D) and A1 (E) comparing left (L) and right (R) cortical hemispheres between both groups (noise: black; sham: white). Significant differences between noise and sham controls were noted in the right hemisphere (contralateral to noise exposure) versus left (* P < .05; standard deviation). Scale bars represent 1-mm increments. mAChR indicates muscarinic acetylcholine receptor.
Figure 5.
nAChR expression is increased in rostral belt (RB) following noise exposure. Autoradiographic images showing [18F]flubatine binding in representative coronal sections through RB (A) and A1(B) on left (noise exposed) and right hemispheres. Part C shows a high magnification view of A1 (of panel B) with standardized areas of analysis drawn over the 3 cortical subregions: supragranular (1), granular (2), and infragranular (3). Quantified optical density measures for [18F]flubatine binding are shown in the bar graphs for the RB (D) and A1 (E) comparing left (L) and right (R) cortical hemispheres between both groups (noise: black; sham: white). Significant differences between noise and sham controls were found in RB, but not A1 (* P < .05 as compared to sham control; standard deviation). Scale bars represent 1-mm increments. nAChR indicates nicotinic acetylcholine receptor.
Nonspecific Binding
To ensure the binding avidity of the radioligands to the appropriate receptors and to rule out nonspecific binding that may influence the final optical density analysis, cholinergic receptor ligands were used to preblock mAChRs (atropine) or nAChRs (nicotine and mecamylamine) to identify and correct for nonspecific binding.
Results
Noise Exposure Leads to a Temporary Threshold Shift
All animals from both groups were found to have normal ABR testing prior to noise exposure (experimental) or anesthesia only (sham; Figure 1). Immediately following a 2-hour, unilateral, left ear noise exposure, all experimental animals showed a TTS (15-35 dB shift at 4, 8, 12, and 16 kHz) that normalized per ABR testing 3 weeks later just prior to animal kill, brain harvest, and radioligand-binding assays (Figure 1). Sham controls showed no changes in ABR thresholds anytime throughout the experiment and showed no effects of anesthesia alone on hearing thresholds.
[3 H]Scopolamine Binding is Decreased in Contralateral A1 and RB Following Noise
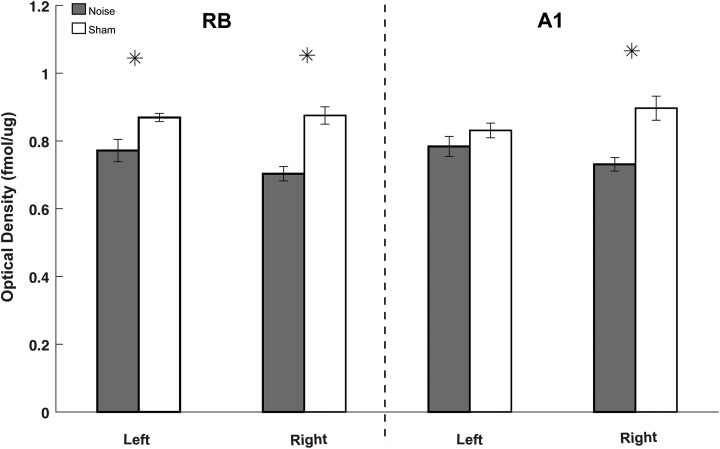
Three weeks following unilateral (left ear only) noise exposure, optical density measures of [3 H]scopolamine binding were significantly decreased in the contralateral (right) hemisphere (opposite to noise exposure) in both A1 and RB regions (Figure 3). The decrease was evident across all binned cortical layers in both A1 and RB. Within A1, decreased [3H]scopolamine binding was seen only on the right hemisphere when compared to sham controls in all cortical sublayers, including supragranular (P = .018), granular (P = .021), and infragranular (P = .042) areas (Figure 3). Within RB, binding was also significantly decreased only on the right hemisphere across all cortical subcompartments, including supragranular (P = .001), granular (P = .043), and infragranular (P = .046; Figure 3). No significant differences in [3H]scopolamine binding were seen in the ipsilateral (to noise exposure) A1 (supragranular, P = .732; granular, P = .344; and infragranular, P = .322) or within the ipsilateral RB (supragranular, P = .181; granular, P = .131; infragranular, P = .280).
All 3 cortical subcompartments, spanning all layers, were subsequently combined to quantify receptor density on a regional basis within RB and A1 in noise-exposed and sham controls. Pooled mAChR binding in A1 and RB following noise in the right hemisphere was found to be similar for both regions (Figure 4). These data suggest that when compared to controls, TTS resulted in a regionally equivalent downregulation of mAChRs in both A1 and associative RB auditory regions.
Figure 4.
Noise decreases mAChR expression in A1 and rostral belt (RB). Bar graph comparing quantified [3H]scopolamine binding pooled from all cortical subregions (supragranular, granular, and infragranular) from each respective anatomic location (RB and A1). Note that noise-exposed animals (gray) showed significantly decreased [3H]scopolamine binding in both hemispheres of RB (larger decreases contralateral to noise) and in the right hemisphere of A1 as compared to sham controls (white). Overall, [3H]scopolamine binding decreases similarly in both A1 and RB (* P < .05 as compared to respective sham control; standard deviation). mAChR indicates muscarinic acetylcholine receptor.
[18F]Flubatine Binding is Increased in RB Following Noise Exposure
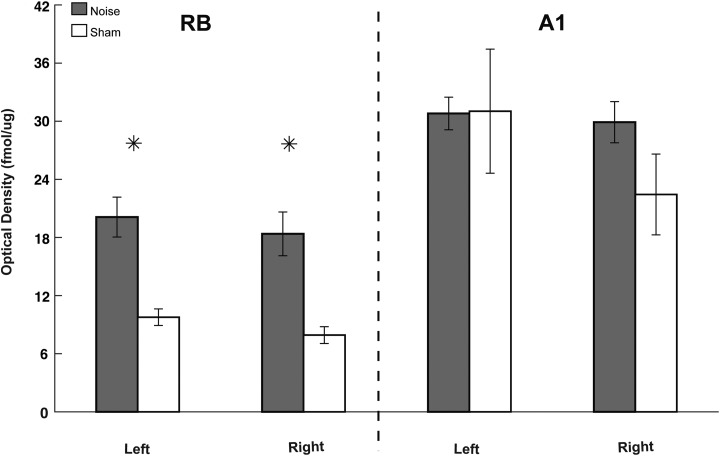
Three weeks following noise exposure, [18F]flubatine binding was significantly increased within the supragranular (P = .448), granular (P = .290), and infragranular (P = .337) regions of the right (contralateral to noise) RB in noise-exposed versus sham controls (Figure 5). The supragranular (P = .0001) and granular (P = .004) regions in the left (ipsilateral to noise exposure) RB were also increased following noise when compared to control (infragranular was not significant; P = .184; Figure 5). Despite an upward trend in the right A1 hemisphere (supragranular, P = .718; granular, P = .521; infragranular, P = .886) following noise exposure, no significant differences in [18F]flubatine binding were found between the 2 groups. There was also no significant difference observed in the left A1 hemisphere (supragranular, P = .888; granular, P = .448; infragranular, P = .290).
As was calculated for mAChRs, the 3 cortical subcompartments, spanning all layers, were combined to quantify nAChR expression within RB and A1 hemispheres in noise and controls. Pooled nAChR expression was greater than 50% less in the intact RB versus noise-damaged RB (Figure 6). These data suggest that when compared to controls, TTS resulted in a regionally specific downregulation of nAChRs in an associative RB versus A1.
Figure 6.
Noise differentially alters nAChR expression in A1 versus rostral belt (RB). Bar graph comparing quantified [18F]flubatine binding pooled from all cortical subregions (supragranular, granular, and infragranular) from each respective anatomic location (RB and A1). Note that noise-exposed (gray) animals showed significantly higher [18F]flubatine binding in the left and right hemispheres of RB as compared to sham controls (white). Data demonstrate that RB had greater percentage increases in [18F]flubatine binding than A1, suggesting that nAChRs in each region are differentially affected by noise exposure (* P < .05 as compared to respective sham control; standard deviation). nAChR indicates nicotinic acetylcholine receptor.
Negative Controls
No nonspecific binding activity was measured when atropine was added to the assay to block [3H]scopolamine binding. This is consistent with previous studies where large decreases in mAChRs (90%-95%) in various brain regions were seen when atropine was added to [3 H]scopolamine.39 Limited nonspecific optical density was measured in sections treated with mecamylamine to prevent [18F]flubatine binding, consistent with mecamylamine’s affinity for the ion channel rather than the ligand binding site. In contrast, nicotine revealed that approximately 70% of the [18F]flubatine signal was attributable to nonspecific binding. In each case, the specificity of binding allowed for receptor density quantification for this study.
Discussion
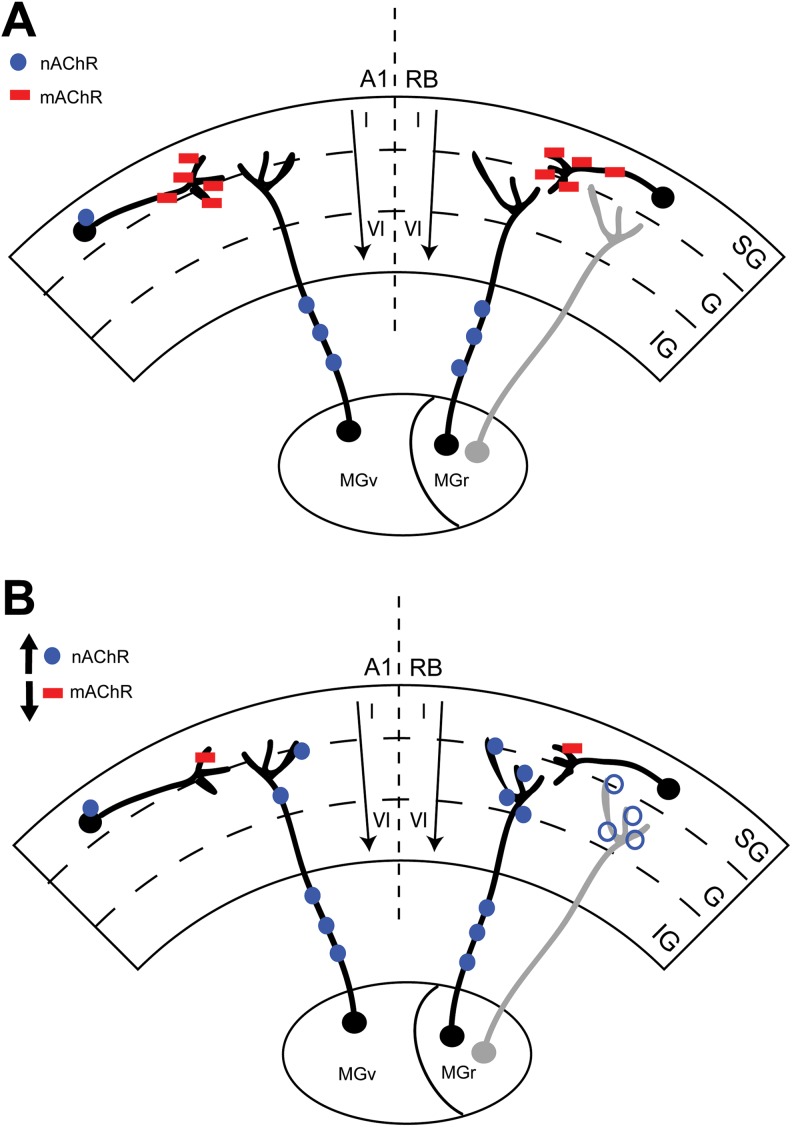
We show for the first time the effects of a TTS on mAChR and nAChR expression in guinea pig A1 and the associative RB region. We observed a downregulation of mAChR expression across all layers of contralateral A1 and RB 3 weeks following unilateral noise exposure (Figure 7). We also observed an upregulation of nAChR expression across all layers in the right RB and in the 2 outermost compartments (supragranular and granular) in the left RB. Despite an upward trend, noise did not significantly change nAChR expression in A1 (Figure 7). Together, these data suggest that mAChRs, and likely the neurons they populate in A1 and RB, are particularly susceptible to noise trauma. In contrast, nAChRs show increased expression only in RB neurons. This discrepancy in receptor sensitivity may, in part, account for observed physiologic plasticity seen in A1 and RB following noise damage.11
Figure 7.
Noise alters ACh receptor expression in A1 and rostral belt (RB). Cartoon schematic summarizing the overall effects of noise-induced TTS on both mAChR (red squares) and nAChR (blue circles) expression in RB and A1. Panel A shows the intact brain with known thalamocortical projections having separate/discrete A1 (MGv) and RB (MGr) projections. Note the expected distribution of cholinergic receptors within the intact cortices and thalamocortical projections. Panel B summarizes the current results and changes in AChR expression following noise exposure and a TTS in hearing. Note the decrease in mAChR expression in both A1 and RB at the cortical level on presumed cholinergic interneurons. Despite a nonsignificant upward trend in expression in A1, nAChR expression increases only in contralateral (right) RB at the 2 outermost cortical subregions (SG, supragranular; G, granular; IG, infragranular) in the ipsilateral (light gray) RB (open blue circle). mAChR indicates muscarinic acetylcholine receptor; MGr, medial geniculate; MGv, ventral geniculate; nAChR, nicotinic acetylcholine receptor; TTS, temporary thresholds shifts.
[3H]Scopolamine binds to multiple subtypes of mAChRs, but mainly M1 and M2 receptors40; 40% of mAChR subtypes are present in cerebral cortex.41 3H-N-methylscopolamine binds predominantly to M1 particularly in cerebral cortex.40 This complements our findings in A1 and RB showing a reduction in [3H]scopolamine binding after noise that likely reflects a downregulation of the M1 receptor.41 [3H]Scopolamine may also bind with much lower affinity to other mAChR subtypes (M3-M5),41 suggesting that while most of our current data reflect changes in the M1 protein, other subtypes may be involved. Future studies using more specific radioligands are required to differentiate these subtypes.
Mechanisms leading to isolated decreases in mAChR expression observed only in the right A1 and RB following noise are unknown. However, potential explanations including sensory deprivation to the contralateral A1/RB, neuronal cell death, molecular mechanisms leading to changes in post-translational processing, and activity-dependent changes are all possibilities. The first mechanism most likely reflects the anatomic distribution of crossing fibers from the peripheral (noise-damaged) ear and brain stem to the contralateral A1/RB.42 Resultant cochlear damage and physiological alterations in central auditory pathways43 disrupt contralateral A1 and RB. Some sensory information is conserved (through ascending pathways) on the ipsilateral side,42 which likely reflects minor projections of the ipsilateral auditory pathway observed in RB.
A second mechanism leading to the observed decrease in [3H]scopolamine binding may be due to a decline in A1/RB neurons via potential dendritic loss, or synaptic pruning in cells populated by mAChRs following TTS. This is plausible since noise damage leads to robust neuronal cell death throughout the central auditory system, including contralateral A1 layers IV through VI44 and I, III, IV, V, and VI.45 Isolated downregulation of mAChRs in our study could be explained, in part, by specific cellular phenomenon, including synaptic pruning,46 axon loss in brain stem,47 or decreased dendritic spines and mean apical dendrite length of pyramidal neurons in A1 following noise.48 Many of the long- and short-term changes seen in neuronal numbers following noise exposure throughout auditory structures vary with whether a TTS or PTS was observed.45 This is important to consider as we utilized a TTS that leads to restoration of hearing at the time of brain harvest 3 weeks later. Concurrent examination of cellular changes noted above was not investigated and certainly could explain the isolated changes in mAChR expression that may be dependent on timing, severity, and nature of the noise exposure and resultant hearing loss.
Alternative mechanisms for decreased binding may include posttranslational processing and cellular expression of protein. Damage to messenger RNA (mRNA) has been shown to alter receptor expression following hippocampal insults49 and cerebral cortical damage.50 Other outcomes of this are shown in various alterations in receptor expression following hearing loss and acoustic trauma.51 Examples include decreases in GAD65 expression,52 triggering of diffuse c-fos expression,53 and Arg3.1/arc increase53,54 in cortex following auditory insult. GABA receptor subtypes are shown to decrease in the contralateral A1 at various time points following noise damage.55 Additionally, increases or decreases in specific genes following noise could also explain our results. Within 2 hours of noise, genes that facilitate DNA repair and cellular protection by preventing apoptosis are increased.56 This suggests that increases in genes that protect A1 neurons from excitotoxicity following noise could be attempting to return A1 to a homeostatic state.51,56 It is important to note that various species may respond differently to noise, and molecular marker measures may vary across different species. Although there are limited data comparing AChRs across mammalian species, future studies utilizing in situ hybridization and concurrent immunohistochemical techniques could be employed to discern cellular changes and specific locations with measured mRNA levels as they relate to final receptor protein expression.
Finally, mechanisms leading to changes in mAChR expression in A1 and RB are, in part, activity dependent following noise damage. Increases or decreases in cholinergic inputs within A1 and RB neurons after noise may influence mAChR expression on pre- and/or postsynaptic neurons. For example, if large amounts of ACh accumulate in the synaptic cleft following trauma, mAChR expression may decrease, while less ACh in the cleft increases receptor expression. An example of this homeostatic plasticity is NMDA glutamate receptor feedback modulating synaptic reorganization following disease and trauma.57 Given that ACh drives cortical plasticity, in part through NMDA receptors,22 this suggests that mAChRs located on GABA and glutamatergic neurons may be targets following noise trauma.
Three weeks following unilateral noise, [18F]flubatine binding (nAChRs) showed no differences in A1, despite an upward trend in the right hemisphere in noise-exposed animals. Increases in all 3 compartments of the right hemisphere (Figure 7) and the 2 outermost regions of the left hemisphere (ipsilateral to noise) were seen in the noise-exposed RB. These data suggest that nAChR expression is upregulated in associative rather than A1 following noise. One possible explanation for the isolated increase in nAChRs in RB could only be due to the separate but parallel thalamocortical projections from discreet thalamic nuclei to each cortical region.35 Since the bulk of nAChRs reside on thalamocortical neurons as opposed to mAChRs (on cortical interneurons),26 it is possible that noise trauma differentially affects the separate thalamocortical input to RB from the rostral medial geniculate rather than input to A1 from the ventral geniculate nucleus.35
Alternatively, a nonsignificant increase in nAChR expression in A1 may be indicative of the TTS model where nAChR expression may transiently increase following noise. As thresholds normalize, and hearing is restored, nAChR expression may slowly decrease to baseline levels. This is plausible as numerous nAChRs are located on thalamocortical projections58 and cellular targets in A1 receiving those projections. With normalization of hearing at the time of animal sacrifice, it stands to reason that these receptors would also normalize in expression on projections and cellular targets in A1. Our current data showing the sensitivity of mAChR expression and enhancement of nAChR expression to noise suggest that an acute TTS likely effects cortical neuron interaction in A1 and RB, but may increase thalamocortial neurons in RB only, potentially altering neuronal excitability.
Our data demonstrate that when all cortical layers are combined and compared between the 2 regions, RB showed a larger percent difference of mAChR expression between sham and noise-exposed animals than did A1. This selective difference could be explained, in part, by known nontonopic organization and higher native responses to noise versus pure tones in RB than in A1.35 Moreover, noise damage in RB may strengthen thalamocortical neurons in A1 (possibly explaining nonsignificant increase in nAChRs in A1 following noise), or vice versa, like the phenomenon of cross-modal plasticity throughout sensory cortices.59 RB and the immediately adjacent somatosensory cortex also share projections.35 Noise damage could potentially alter somatosensory projections in RB increasing cross-modal plasticity in A1 and somatosensory fields following partial sensory trauma.10,60,61,62 This interconnectivity of RB and the somatosensory cortex could imply that the somatosensory inputs may influence nAChR circuitry by increasing following noise damage. Future studies could investigate AChRs in somatosensory cortex following noise to further understand the plasticity and regional interactions following trauma in these 2 cortices.
Limits of the study include the smaller sample size and the use of female guinea pigs only. Although the authors admit that this is a pilot study to evaluate the efficacy of these ligands to bind the respective mAChR and nAChRs, future larger studies will be required to investigate the specific temporal nature of receptor changes and to what specific threshold of hearing loss. Another limitation of the study is the lack of anatomic resolution that exists with radioligand binding. Future studies that employ parallel immunohistochemical and in situ hybridization studies would be required to identify the specific neurons/cell types within A1 and RB that are undergoing most change after TTS.
Acknowledgments
The authors would like to thank Dr Susan Shore and Mr James Wiler for technical advice and the use of equipment for unilateral noise exposures. In addition, the authors would like to thank the Division of Nuclear Medicine for use of autoradiography supplies and equipment, as well as the staff of the PET Center for synthesis of [18F]flubatine.
Authors’ Note: All authors contributed to the interpretation of the results and the manuscript. TF and GB contributed to the study design; TF, MI, and TD collected and processed the data; TF, TD, PS, and GB analyzed the data; and TF and GB prepared the initial manuscript. All authors reviewed the manuscript and provided input leading up to the final version.
Declaration of Conflicting Interests: The author(s) declared no potential conflicts of interest with respect to the research, authorship, and/or publication of this article.
Funding: The author(s) disclosed receipt of the following financial support for the research, authorship, and/or publication of this article: This work was supported by a Clinician-Scientist Developmental Award sponsored by the American Otological Society (G.J.B.), and the University of Michigan Department of Radiology (startup funds to P.J.H.S.).
References
- 1. James C, Albegger K, Battmer R, et al. Preservation of residual hearing with cochlear implantation: how and why. Acta Otolaryngol. 2005;125(5):481–491. [DOI] [PubMed] [Google Scholar]
- 2. Fredriksson S, Hammar O, Toren K, et al. The effect of occupational noise exposure on tinnitus and sound-induced auditory fatigue among obstetrics personnel: a cross-sectional study. BMJ Open. 2015;5(3):e005793. [DOI] [PMC free article] [PubMed] [Google Scholar]
- 3. Rutytjens L, Willemsen ATM, Van Dijk P, et al. Functional imaging of the central auditory system using PET. Acta Otolaryngol. 2006;126(12):1236–1244. [DOI] [PubMed] [Google Scholar]
- 4. Weissman J, Hirsch B. Imaging of tinnitus: a review. Radiology. 2000;216(2):342–349. [DOI] [PubMed] [Google Scholar]
- 5. Cardier M, Zulueta-Santos C, Manrique-Huarte R, et al. Functional neuroimaging studies in asymmetric hearing loss. Audiol Neurootol. 2015;20(suppl 1):48–52. [DOI] [PubMed] [Google Scholar]
- 6. Berding G, Wilke F, Rode T, et al. Positron emission tomography imaging reveals auditory and frontal cortical regions involved with speech perception and loudness adaptation. PLoS One. 2015;10(6):e0128743. [DOI] [PMC free article] [PubMed] [Google Scholar]
- 7. Kang HH, Wang CH, Chen HC, et al. Investigating the effects of noise-induced hearing loss on serotonin transporters in rat brain using 4-[18F]-ADAM/small animal PET. Neuroimage 2013;75:262–269. [DOI] [PubMed] [Google Scholar]
- 8. Eggermont JJ, Komiya H. Moderate noise trauma in juvenile cats results in profound cortical topographic map changes in adulthood. Hear Res. 2000;142(1-2):89–101. [DOI] [PubMed] [Google Scholar]
- 9. Seki S, Eggermont JJ. Changes in spontaneous firing rate and neural synchrony in cat primary auditory cortex after localized tone-induced hearing loss. Hear Res. 2003;180(1-2):28–38. [DOI] [PubMed] [Google Scholar]
- 10. Basura GJ, Koehler SD, Shore SE. Bimodal stimulus timing-dependent plasticity in primary auditory cortex is altered after noise exposure with and without tinnitus. J Neurophysiol. 2015;114(6):3064–3075. [DOI] [PMC free article] [PubMed] [Google Scholar]
- 11. Basura G, Takacs J, Shore S. P27: noise exposure leads to increased synchrony between primary auditory cortex and anterior auditory field neurons. In 10th International Tinnitus Research Initiative Conference and 1st EU Cost Action (TINNET) Nottingham, UK: Conference Book of Abstracts; 2016:93. [Google Scholar]
- 12. Wallace MN, Rutkowski RG, Palmer AR. Interconnections of auditory areas in the guinea pig neocortex. Exp Brain Res. 2002;143(1):106–119. [DOI] [PubMed] [Google Scholar]
- 13. Zilles K, Palomero-Gallagher N. Multiple transmitter receptors in regions and layers of the human cerebral cortex. Front Neuroanat. 2017;11:78. [DOI] [PMC free article] [PubMed] [Google Scholar]
- 14. Rajan R, Irvine DR. Severe and extensive neonatal hearing loss in cats results in auditory cortex plasticity that differentiates into two regions. Eur J Neurosci. 2010;31(11):1999–2013. [DOI] [PubMed] [Google Scholar]
- 15. Gu Q. Contribution of acetylcholine to visual cortex plasticity. Neurobiol Learn Mem. 2003;80(3):291–301. [DOI] [PubMed] [Google Scholar]
- 16. Larsen RS, Rao D, Manis PB, Philpot BD. STDP in the developing sensory neocortex. Front Synaptic Neurosci. 2010;2:9. [DOI] [PMC free article] [PubMed] [Google Scholar]
- 17. Pawlak V, Wickens JR, Kirkwood A, Kerr JND. Timing is not everything: neuromodulation opens the STDP gate. Front Synaptic Neurosci. 2010;2:146. [DOI] [PMC free article] [PubMed] [Google Scholar]
- 18. Seol GH, Ziburkus J, Huang S, et al. Neuromodulators control the polarity of spike-timing-dependent synaptic plasticity. Neuron. 2007;55(6):919–929. [DOI] [PMC free article] [PubMed] [Google Scholar]
- 19. Couey JJ, Meredith RM, Spijker S, et al. Distributed network actions by nicotine increase the threshold for spike-timing-dependent plasticity in prefrontal cortex. Neuron. 2007;54(1):73–87. [DOI] [PubMed] [Google Scholar]
- 20. Jin YM, Godfrey DA, Wang J, Kaltenbach JA. Effects of intense tone exposure on choline acetyltransferase activity in the hamster cochlear nucleus. Hear Res. 2006;216-217:168–175. [DOI] [PubMed] [Google Scholar]
- 21. Metherate R, Hsieh CY. Regulation of glutamate synapses by nicotinic acetylcholine receptors in auditory cortex. Neurobiol Learn Mem. 2003;80(3):285–290. [DOI] [PubMed] [Google Scholar]
- 22. Fuenzalida M, Perez MA, Arias HR. Role of nicotinic and muscarinic receptors on synaptic plasticity and neurological diseases. Curr Pharm Des. 2016;22(14):2004–2014. [DOI] [PubMed] [Google Scholar]
- 23. Albuquerque EX, Pereira EF, Alkondon M, Rogers SW. Mammalian nicotinic acetylcholine receptors: from structure to function. Physiol Rev. 2009;89(1):73–120. [DOI] [PMC free article] [PubMed] [Google Scholar]
- 24. Gotti C, Zoli M, Clementi F. Brain nicotinic acetylcholine receptors: native subtypes and their relevance. Trends Pharmacol Sci. 2006;27(9):482–491. [DOI] [PubMed] [Google Scholar]
- 25. Nathanson NM. Molecular properties of the muscarinic acetylcholine receptor. Annu Rev Neurosci. 1987;10:195–236. [DOI] [PubMed] [Google Scholar]
- 26. Brann MR, Ellis J, Jorgensen H, Hill-Eubanks D, Jones SV. Muscarinic acetylcholine receptor subtypes: localization and structure/function. Prog Brain Res. 1993;98:121–127. [DOI] [PubMed] [Google Scholar]
- 27. Schormans AL, Typlt M, Allman BL. Crossmodal plasticity in auditory, visual and multisensory cortical areas following noise-induced hearing loss in adulthood. Hear Res. 2017;343:92–107. [DOI] [PubMed] [Google Scholar]
- 28. Turner J. Behavioral measures of tinnitus in laboratory animals. Prog Brain Res. 2007;166:147–156. [DOI] [PubMed] [Google Scholar]
- 29. Frey KA, Ehrenkaufer RL, Beaucage S, Agranoff BW. Quantitative in vivo receptor binding. I. Theory and application to the muscarinic cholinergic receptor. J Neurosci. 1985;5(2):421–428. [DOI] [PMC free article] [PubMed] [Google Scholar]
- 30. Bohnen NI, Frey KA. Imaging of cholinergic and monoaminergic neurochemical changes in neurodegenerative disorders. Mol Imaging Biol. 2007;9(4):243–257. [DOI] [PubMed] [Google Scholar]
- 31. Hockley BG, Stewart MN, Sherman P, et al. (−)-[(18) F]Flubatine: evaluation in rhesus monkeys and a report of the first fully automated radiosynthesis validated for clinical use. J Labelled Comp Radiopharm. 2013;56(12):595–599. [DOI] [PubMed] [Google Scholar]
- 32. Fischer S, Hiller A, Smits R, et al. Radiosynthesis of racemic and enantiomerically pure (−)-[18F]flubatine – a promising PET radiotracer for neuroimaging of α4β2 nicotinic acetylcholine receptors. Appl Radiat Isot. 2013;74:128–136. [DOI] [PubMed] [Google Scholar]
- 33. Kranz M, Sattler B, Tiepolt S, et al. Radiation dosimetry of the α4β2 nicotinic receptor ligand (+)-[18F]flubatine, comparing preclinical PET/MRI and PET/CT to first-in-human PET/CT results. EJNMMI Phys. 2016;3(1):25. [DOI] [PMC free article] [PubMed] [Google Scholar]
- 34. Maguire JJ, Kuc RE, Davenport AP. Radioligand binding assays and their analysis. Methods Mol Biol. 2012;897:31–77. [DOI] [PubMed] [Google Scholar]
- 35. Redies H, Brandner S, Creutzfeldt OD. Anatomy of the auditory thalamocortical system of the guinea pig. J Comp Neurol. 1989;282(4):489–511. [DOI] [PubMed] [Google Scholar]
- 36. Wallace MN, Rutkowski RG, Palmer AR. Identification and localisation of auditory areas in guinea pig cortex. Exp Brain Res. 2000;132(4):445–456. [DOI] [PubMed] [Google Scholar]
- 37. Basura GJ, Abbas AI, O’Donohue H, et al. Ontogeny of serotonin and serotonin2A receptors in rat auditory cortex. Hear Res. 2008;244(1-2):45–50. [DOI] [PMC free article] [PubMed] [Google Scholar]
- 38. Iñiguez C, Gayoso MJ, Carreres J. A versatile and simple method of staining nervous tissue using Giemsa dye. J Neurosci Methods. 1985;13(1):77–86. [DOI] [PubMed] [Google Scholar]
- 39. Frey KA, Ciliax B, Agranoff BW. Quantitative in vivo receptor binding. IV: detection of muscarinic receptor down-regulation by equilibrium and by tracer kinetic methods. Neurochem Res. 1991;16(9):1017–1023. [DOI] [PubMed] [Google Scholar]
- 40. Frey KA, Howland MM. Quantitative autoradiography of muscarinic cholinergic receptor binding in the rat brain: distinction of receptor subtypes in antagonist competition assays. J Pharmacol Exp Ther. 1992;263(3):1391–1400. [PubMed] [Google Scholar]
- 41. Levey AI, Kitt CA, Simonds WF, Price DL, Brann MR. Identification and localization of muscarinic acetylcholine receptor proteins in brain with subtype-specific antibodies. J Neurosci. 1991;11(10):3218–3226. [DOI] [PMC free article] [PubMed] [Google Scholar]
- 42. Pickles JO. Auditory pathways: anatomy and physiology. Handb Clin Neurol. 2015;129:3–25. [DOI] [PubMed] [Google Scholar]
- 43. Coordes A, Groschel M, Ernst A, Basta D. Apoptotic cascades in the central auditory pathway after noise exposure. J Neurotrauma. 2012;29(6):1249–1254. [DOI] [PubMed] [Google Scholar]
- 44. Basta D, Tzschentke B, Ernst A. Noise-induced cell death in the mouse medial geniculate body and primary auditory cortex. Neurosci Lett. 2005;381(1-2):199–204. [DOI] [PubMed] [Google Scholar]
- 45. Groschel M, Gotze R, Ernst A, Basta D. Differential impact of temporary and permanent noise-induced hearing loss on neuronal cell density in the mouse central auditory pathway. J Neurotrauma. 2010;27(8):1499–1507. [DOI] [PubMed] [Google Scholar]
- 46. Jones TA, Schallert T. Overgrowth and pruning of dendrites in adult rats recovering from neocortical damage. Brain Res. 1992;581(1):156–160. [DOI] [PubMed] [Google Scholar]
- 47. Kim J, Morest DK, Bohne BA. Degeneration of axons in the brainstem of the chinchilla after auditory overstimulation. Hear Res. 1997;103(1-2):169–191. [DOI] [PubMed] [Google Scholar]
- 48. Ouda L, Burianova J, Balogova Z, Lu HP, Syka J. Structural changes in the adult rat auditory system induced by brief postnatal noise exposure. Brain Struct Funct. 2016;221(1):617–629. [DOI] [PubMed] [Google Scholar]
- 49. Hicks RR, Numan S, Dhillon HS, Prasad MR, Seroogy KB. Alterations in BDNF and NT-3 mRNAs in rat hippocampus after experimental brain trauma. Brain Res Mol Brain Res. 1997;48(2):401–406. [DOI] [PubMed] [Google Scholar]
- 50. Kobori N, Clifton GL, Dash P. Altered expression of novel genes in the cerebral cortex following experimental brain injury. Brain Res Mol Brain Res. 2002;104(2):148–158. [DOI] [PubMed] [Google Scholar]
- 51. Gold JR, Bajo VM. Insult-induced adaptive plasticity of the auditory system. Front Neurosci. 2014;8:110. [DOI] [PMC free article] [PubMed] [Google Scholar]
- 52. Yang S, Weiner BD, Zhang LS, Cho SJ, Bao S. Homeostatic plasticity drives tinnitus perception in an animal model. Proc Natl Acad Sci U S A. 2011;108(36):14974–14979. [DOI] [PMC free article] [PubMed] [Google Scholar]
- 53. Wallhausser-Franke E, Mahlke C, Oliva R, Braun S, Wenz G, Langner G. Expression of c-fos in auditory and non-auditory brain regions of the gerbil after manipulations that induce tinnitus. Exp Brain Res. 2003;153(4):649–654. [DOI] [PubMed] [Google Scholar]
- 54. Mahlke C, Wallhausser-Franke E. Evidence for tinnitus-related plasticity in the auditory and limbic system, demonstrated by arg3.1 and c-fos immunocytochemistry. Hear Res. 2004;195(1-2):17–34. [DOI] [PubMed] [Google Scholar]
- 55. Browne CJ, Morley JW, Parsons CH. Tracking the expression of excitatory and inhibitory neurotransmission-related proteins and neuroplasticity markers after noise induced hearing loss. PLoS One. 2012;7(3):e33272. [DOI] [PMC free article] [PubMed] [Google Scholar]
- 56. Sun W, Zhang L, Lu J, Yang G, Laundrie E, Salvi R. Noise exposure-induced enhancement of auditory cortex response and changes in gene expression. Neuroscience. 2008;156(2):374–380. [DOI] [PMC free article] [PubMed] [Google Scholar]
- 57. Scheetz AJ, Constantine-Paton M. Modulation of NMDA receptor function: implications for vertebrate neural development. FASEB J. 1994;8(10):745–752. [DOI] [PubMed] [Google Scholar]
- 58. Metherate R. Nicotinic acetylcholine receptors in sensory cortex. Learn Mem. 2004;11(1):50–59. [DOI] [PubMed] [Google Scholar]
- 59. Rabinowitch I, Bai J. The foundations of cross-modal plasticity. Commun Integr Biol. 2016;9(2):e1158378. [DOI] [PMC free article] [PubMed] [Google Scholar]
- 60. Nys J, Smolders K, Laramee ME, Hofman I, Hu TT, Arckens L. Regional specificity of GABAergic regulation of cross-modal plasticity in mouse visual cortex after unilateral enucleation. J Neurosci. 2015;35(32):11174–11189. [DOI] [PMC free article] [PubMed] [Google Scholar]
- 61. Meredith MA, Keniston LP, Allman BL. Multisensory dysfunction accompanies crossmodal plasticity following adult hearing impairment. Neuroscience. 2012;214:136–148. [DOI] [PMC free article] [PubMed] [Google Scholar]
- 62. Allman BL, Keniston LP, Meredith MA. Adult deafness induces somatosensory conversion of ferret auditory cortex. Proc Natl Acad Sci U S A. 2009;106(14):5925–5930. [DOI] [PMC free article] [PubMed] [Google Scholar]


