Abstract
While zebrafish embryos in the first five days after fertilization are clear and amenable to optical analysis, older juveniles and adults are not, due to pigmentation development and tissue growth. Thus other imaging methods are needed to image adult specimens. NMR is a versatile tool for studies of biological systems and has been successfully used for in vivo zebrafish microscopy. In this work we use NMR microscopy (MRM) for assessment of zebrafish specimens, which includes imaging of formalin fixed (FF), formalin fixed and paraffin embedded (FFPE), fresh (unfixed), and FF gadolinium doped specimens. To delineate the size and shape of various organs we concentrated on 3D MRM. We have shown that at 7 T a 3D NMR image can be obtained with isotropic resolution of 50 μm/pxl within 10 min and 25 μm/pxl within 4 h. Also, we have analyzed sources of contrast and have found that in FF specimens the best contrast is obtained by T1 weighting (3D FLASH, 3D FISP), whereas in FFPE specimens T2 weighting (3D RARE) is the best. We highlight an approach to perform segmentation of the organs in order to study morphological changes associated with mutations. The broader implication of this work is development of NMR methodology for high contrast and high resolution serial imaging and automated analysis of morphology of various zebrafish mutants.
Keywords: FF, FFPE, formalin fixed, magnetic resonance microscopy, MRI, NMR, paraffin embedded, zebrafish
1 |. INTRODUCTION
Zebrafish are a popular model for biomedical research and have been studied at all levels from embryo to adult, from subcellular to the whole organism. One of the key advantages of the zebrafish model is the optical transparency of the embryos and larvae, as well as the ability to study the fish in vivo with optical microscopy. However, in many instances an adult or juvenile zebrafish is the subject of interest, but the development of pigmentation and tissue growth prevents direct analysis by optical means.
Because of this pressing need, a gamut of modalities have been tried and used to image adult zebrafish: optical projection tomography (OPT),1,2 photoacoustic tomography (PAT),3,4 optical multispectral 3D tomography,5 time‐gated optical projection tomography (TGOPT),6 optical coherence tomography (OCT),7 contrast‐enhanced X‐ray micro‐computed tomography,8 synchrotron X‐ray micro‐computed tomography (SR‐CT),9 ultrasound,10 and NMR microscopy (MRM) ex vivo11 and in vivo.12–16
The main advantage of optical methods is their high speed (real time imaging), high resolution, high sensitivity, and relative ease of in vivo implementation. The main disadvantage is the requirement for optical transparency of the specimen. Ultrasound could provide dynamic data (heart motion, blood flow) but with modest resolution and poor contrast. Micro‐computed tomography methods offer the highest resolution but are unsuitable for in vivo studies of soft tissue.
Because of its versatility, MRM could be optimized to share most of the advantages of other methods. It is capable of producing images with resolution of the order of tens of micrometers per pixel (μm/pxl), with an unparalleled repertoire of contrast modalities with or without contrast agents. In addition, it is nondestructive and therefore suitable for in vivo studies. However, the nondestructive character of MRM is inherently coupled to its major disadvantage, which is modest sensitivity. This makes image acquisition times long compared with other imaging modalities such as optical or x‐ray imaging. Regardless of this disadvantage, MRM is an extremely useful method to image biological specimens.17 High quality images can be obtained by careful optimization of hardware and data acquisition parameters—which is the subject of this study.
Using MRM, adult zebrafish have already been imaged ex vivo and in vivo, first to demonstrate NMR feasibility11 and then to detect malignant melanoma,11 generate an NMR brain atlas,18,19 and examine the zebrafish heart in vivo.14–16 Also, zebrafish embryos were imaged to study cryoprotectant permeation20 and paramagnetic molecule distributions.21
The emphasis of this work is on ex vivo MRM of adult zebrafish specimens: formalin fixed (FF), formalin fixed paraffin embedded (FFPE), fresh (unfixed), and gadolinium doped FF. For each specimen type we examined principal contrast sources (because they are different from the contrast found in rodent NMR imaging22,23) and then optimized parameters for fast 3D MRM methods, FLASH (fast low angle shot),24 RARE (rapid acquisition with refocused echoes),25 and FISP (fast imaging with steady state precession).26 We highlight the ability of image optimization to develop an analysis workflow to study morphological changes of various organs.
The major motivation for this work is our continuing interest in polycystic kidney disease (PKD),27 and development of animal models for this human condition. Studies in zebrafish embryos have demonstrated the relevance of zebrafish as a model for PKD28,29 and have provided numerous insights revealing the critical role of cilia,30–32 phosphodiesterase 1A,33 and the utility of zebrafish for drug screening.34 In PKD animal models, the main changes manifest at latter stages of organism development. Longitudinal studies using MRM have provided many insights, yet this has been unexplored in zebrafish models due to the lack of high quality imaging approaches available for visualizing the kidney beyond embryogenesis.
To characterize various mutants besides the organ of interest (in our case kidney), one needs to review/study other organs to make sure that mutations do not affect them adversely. This is accomplished easily by the whole body imaging. Alternatively, one could dissect the fish, remove internal organs and inspect them visually. However, in this process relations between the organs are lost and any malformations (tumor, cyst) that may affect more than one organ could be disturbed. Also any mechanical manipulation of inner organs causes their physical deformation, which prevents assessment of their shape or volume. Zebrafish kidney is particularly prone to mechanical damage because of its softness and elongated shape, and for kidney studies imaging the whole intact zebrafish is the method of choice.
Fixation is the standard procedure for long term preservation of tissue and therefore we imaged readily available FF specimens. Similarly, for histology analysis FF tissue is paraffin embedded and before sectioning for optical studies it could be easily imaged from paraffin melt.35–37 MRM of FFPE specimens is particularly useful for correlation of histology images with FF MRM images. For example, during solvent exchange the lipids from tissue could be washed away and the lipid structures could be absent from the histology images, but could be captured in MRM images of FF specimens. Fresh specimen imaging makes sense for quick specimen assessment before dissection or fixation for studies by other means. We also imaged Gd doped FF zebrafish specimens to expand the contrast domain and potentially accelerate data acquisition. Finally, we demonstrate an approach for rapid organ segmentation.
2 |. MATERIALS AND METHODS
2.1 |. Preparation of zebrafish specimens
Zebrafish were maintained and raised as described38 in the Mayo Clinic Zebrafish Facility, which is accredited by the Association for Assessment and Accreditation of Laboratory Animal Care, following procedures approved by the Mayo Clinic Institutional Animal Care and Use Committee. To prepare fresh specimens fish were anesthetized and sacrificed using 0.02% tricaine (MS222, Pentair, Cary, NC, USA) in fish system water (RO water with Instant Ocean sea salts according to standard procedures38 brought to 4°C). Fresh specimens are either kept and scanned at 4°C or immediately fixed by immersion in ice cold 4% paraformaldehyde (PFA, no 15710, Electron Microscopy Sciences, Hatfield, PA, USA) in Dulbecco’s phosphate‐buffered saline (PBS) (no PI28374, Fisher Scientific, Waltham, MA, USA).
After NMR scans the fixed specimens were paraffin embedded by the Mayo histology service laboratory using standard embedding processors and procedures.
2.2 |. Gadolinium doping
As a contrast agent we used 1mM solution of GdDTPA‐BMA (gadodiamide or Gd‐diethylenetriaminepentaacetic‐acid‐bis‐methylamide, Omniscan, GE Healthcare, Waukesha, WI, USA) in PFA. To make that sure the equilibrium distribution of agent had been reached, scanning was done a few weeks after the specimen was immersed into 50 mL of doped fixative.
2.3 |. MRM
NMR experiments were performed using an Avance III 300 MHz (7 T) wide bore NMR spectrometer equipped with micro‐imaging accessories (Bruker BioSpin, Billerica, MA, USA) with a 10 mm (VC10) or 20 mm (VC20) diameter volume coil. The FF specimens were scanned no earlier than one week after immersion into fixative. We assume that the fixation is completed after the swim bladder is filled with liquid. This is confirmed with 1H PRESS (point resolved spectroscopy), where fixative components are detected in the swim bladder (Figure S1). The FF specimen taken out of PFA is gently dried with tissue paper, transferred into a 10 mm NMR tube, and tightly secured in the middle of the tube by a custom made Teflon holder. Then the tube is filled with Fluorinert FC‐770 (3 M, St. Paul, MN, USA). Fluorinert is a perfluorinated solvent that helps improve the field homogeneity around the specimen, and being proton‐free does not contribute to the background NMR signal. All water based images (FF, fresh, Gd doped) are acquired at the core temperature of the gradient coil, 21°C.
Paraffin embedded specimens need to be imaged at temperatures above the paraffin melting point (~54°C) at about 60°C.36 To enable temperature control of the sample in the VC10 coil with a 10 mm tube, a standard NMR tube is modified to allow flow of conditioned air through the coil and around the specimen (Figure S2). The tube was cut open at the bottom, two pieces of thin wall tubing (obtained by cutting the bottoms from 3 mm NMR tubes) were glued on opposite sides inside the 10 mm tube and the bottom of the tube was closed with epoxide glue. This formed a chamber (see photograph and schematic drawing in supplement) large enough to accommodate the FFPE zebrafish specimen, simultaneously allowing conditioned air to flow through the coil with rates up to 650 L/h. Paraffin embedded specimens were freed from the paraffin block by melting at 60°C, and by removing excess paraffin with tissue paper (while still melted). Cooled (to room temperature), the specimen was then transferred into the chamber, mechanically secured in the middle by a custom made Teflon holder. The chamber is filled with high boiling point Fluorinert FC‐40 (b.p. 160°C) to accelerate heat transfer between the conditioned air and the specimen and to improve field homogeneity around the specimen. The chamber with the specimen was inserted into the VC10 and warmed above 60°C by a flow of warm air supplied via the thermo‐couple (TC) controlled variable temperature unit of the spectrometer (air‐flow 500 L/h, tTC 65–70°C).
Fresh specimens were kept and scanned at 4°C using the same set‐up as for the FFPE specimen. The only difference was that the conditioned air temperature was set to 4°C and that air had to be precooled to −10°C (by FTS Air Jet, SP Scientific, Gardiner, NY, USA) before entering the probe.
To generate parametric images, the relaxation times were measured using standard methods supplied by the manufacturer and processed using image sequence analysis tool (ISA, ParaVision 5.1). Images were recorded using RARE‐VTR (variable repetition time RARE) (T1, T2), MSME (multi‐slice multi‐echo) (T2), and MGE (multi‐gradient echo) (T2*). Precise relaxation measurements of individual organs were not attempted, as it is known that the values depend on the fixation time,39 fixative origin and concentration,40 and concentration of salt and buffer.41 Therefore, only representative samples of a given specimen type (FF, FFPE, fresh, Gd doped) were used.
The kernel density plots are made from respective T1‐T2‐parametric images using the seaborn visualization library in Python (https://doi.org/ 10.5281/zenodo.883859). Parametric images were first smoothed to remove outliers by applying a median filter with kernel size of 5 × 5. The fish were traced in each image, and this tracing was used as a mask to remove background pixels.
Imaging parameters for each scan are shown within its respective figure caption.
2.4 |. Image analysis
To highlight the ability for organ segmentation and measurement of organ volume, a previously developed semi‐automated method, the MIROS42 software package https://github.com/TLKline/PyCysticImage, was used. After segmenting out the individual organs, which included the brain, heart, and kidney, organ volume was calculated as the number of voxels contained within the segmentation, multiplied by the voxel volume.
3 |. RESULTS
3.1 |. Contrast sources
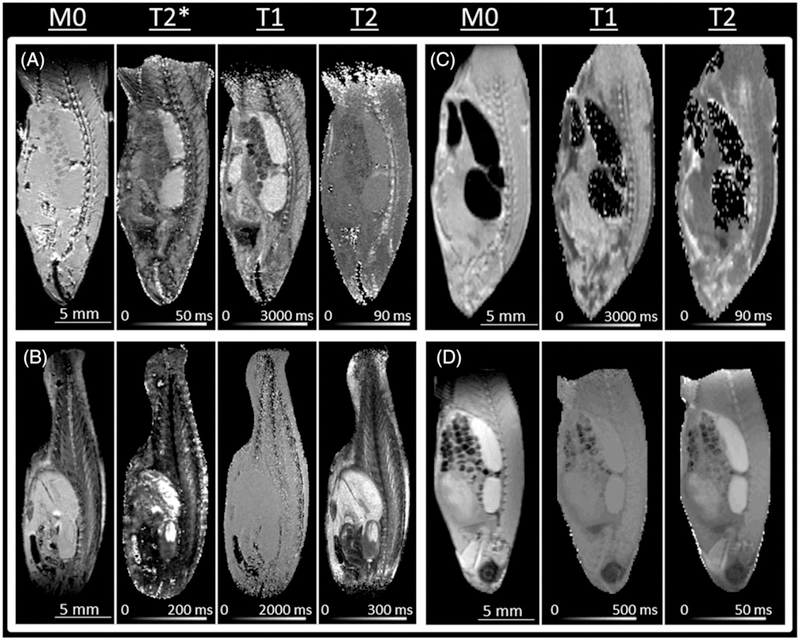
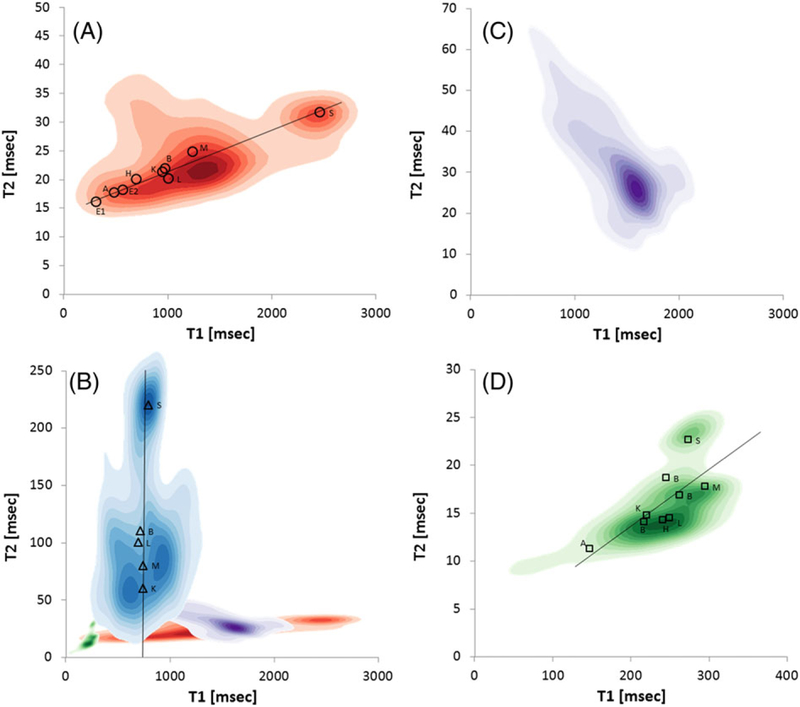
To optimize imaging parameters, the most useful are parametric images. As shown in Figure 1, the image brightness is directly proportional to the specified parameter (M0, T1, T2 or T2*). For contrast, most useful are parameters with the greatest variation across the specimen, which can be deduced from the 2D kernel density distribution plots. Figure 2 shows such a plot of the T1 and T2 taken from respective images from Figure 1. The relaxation time ranges are used to set up initial data acquisition parameters: or T2 weighted (T2W), TE ~ T2average, TR > T1average and for T1 weighted (T1W), TE < T2, TR ~ T1average.43 In the FISP‐FID (free induction decay) experiments where the contrast depends on the T2/T1 ratio,26,44 the initial TR/TE values are set to the shortest possible allowed by the hardware, with flip angle (FA) 45°.44
FIGURE 1.
Parametric images of M0, T1, T2, and T2* from differently prepared specimens. The images were calculated from a series of 2D images (the series sizes reported in subscript of the series range) with resolution 100 μm/pxl × 100 μm/pxl and slice thickness 500 μm. A, FF specimen: T1 (RARE‐VTR), TR (66–3935)9, TE 6; T2 (MSME), TR 3935, TE (6–47)8; T2* (MGE), TR 3935, TE (4–165)24. B, FFPE specimen: T1 (RARE‐VTR), TR (68– 3936)9, TE 9; T2 (RARE‐VTR), TR 3936, TE (9–69)8; T2* (MGE), TR 3936, TE (4.3–83)12. C, Fresh specimen: T1 (RARE‐VTR), TR (110–10000)12, TE 5.8; T2 (RARE‐VTR), TR 10 000, TE (5.8–47)8. D, Gd doped specimen: T1, TR (16–2500)12, TE 5.9; T2, TR 1500, TE (8.4–134.5)16. T2* images are not shown in C because parametric images are grossly distorted and in D because T2* ~ T2
FIGURE 2.
The kernel density plots, T2 = f (T1) generated from respective T1 and T2 parametric images shown in Figure 1. A, FF specimen. A straight line (linear fit of experimental point) is drawn to guide the eye. B, FFPE specimen. For the relative scale and position of the ranges, also shown are kernel plots from panels A, C and D on the same scale. C, Fresh specimen at 4°C; it is hard to identify organs because most relaxation time values are centered on T1/T2 1600/30. D, FF specimen in 1mM GdDTPA. A‐C have the same T1 range but the T2 ranges were customized for each panel. Symbols in A (circles), B (triangles) and D (squares) show average values for respective ROIs: atrium (A); brain (B); egg (E); heart (H); kidney head (K); liver (L); muscle (M); swim bladder (S). The water values for FF and Gd are reported at 21°C, fresh at 4°C and FFPE at 58°‐60°C. The ROIs for selected organs were obtained by organ outlining using the ParaVision ROI tool
3.2 |. FF zebrafish imaging
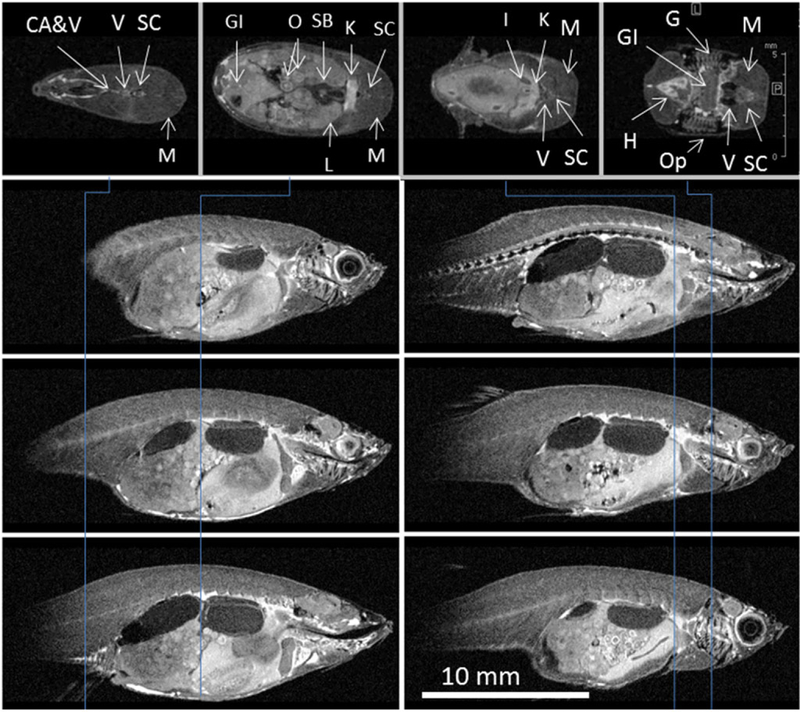
Figure 3 shows representative slices through a 3D IR (inversion recovery) RARE image of a FF, 18 month old, female zebrafish. In such high quality image many organs can be easily identified (see figure caption) but it takes over 10 h to get data for image with isotropic resolution of 50 μm/pxl.
FIGURE 3.
Cross‐sections from the IR 3D RARE image of FF zebrafish: VC20, TR 3000, TI 1000, TE 8, encoding matrix, raw data size (pixels) (EncMtx) 532 × 120 × 214, matrix, image size (pixels) (Mtx) 640 × 160 × 256, FOV (mm) 32 × 8 × 12.8, RARE factor 2, tt 10 h 42 min, resolution (μm/pxl) (Resol) 50 × 50 × 50. Vertical lines indicate position of axial sections (top row). Sagittal sections are taken 1 mm apart. Many organs can be easily identified: caudal artery and vein (CA&V), gastrointestinal tract (GI), gills (G), heart (H), interrenal gland (I), kidney (K), liver (L), muscle (M), oocytes in ovary (O), operculum (Op), swim bladder (SB), spinal cord (SC), vertebra (V)
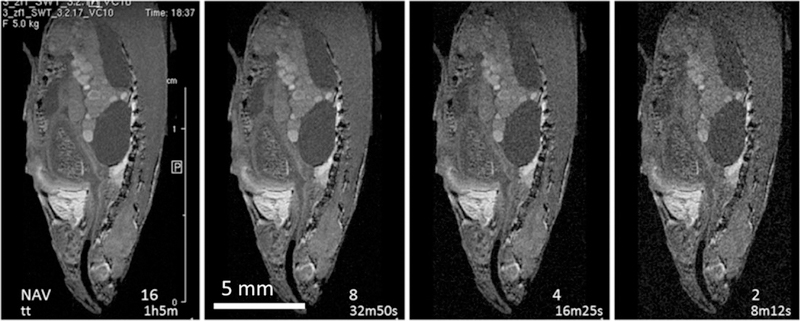
Substituting the VC20 RF coil by a VC10 RF coil one would expect a signal to noise ratio (SNR) improvement by a factor of approximately 2.45 However, in our own measurements of SNR in an FFPE specimen at 58°C and our calibration of RF power at 21°C with an FF specimen, we found an improvement of about 2.5‐fold. Thus, by use of the smaller coils one obtains images of the same quality much faster. Further improvement in the scanning speed could be achieved by the use of fast gradient echo methods (FISP, FLASH). Figure 4 shows the same sagittal slice as shown in Figure 3 from a series of 3D FISP images recorded with the same resolution (50 μm/pxl) and variable number of averages. With 2.5‐fold improvement in SNR and with the fast gradient echo method, a useful image can be obtained within 10 min (two averages), but it takes about an hour for really high quality images (16 averages).
FIGURE 4.
Sagittal slice from 3D FISP of zebrafish obtained with a VC10 coil. With an isotropic resolution of 50 μm/pxl an excellent 3D image could be obtained within an hour: TE 2.9, TR 14, FA 20, EncMtx 334 × 128 × 108, Mtx 400 × 176 × 128, FOV 20 × 8.8 × 6.4, scan TR 285. Total time and number of averages are indicated in the respective panels
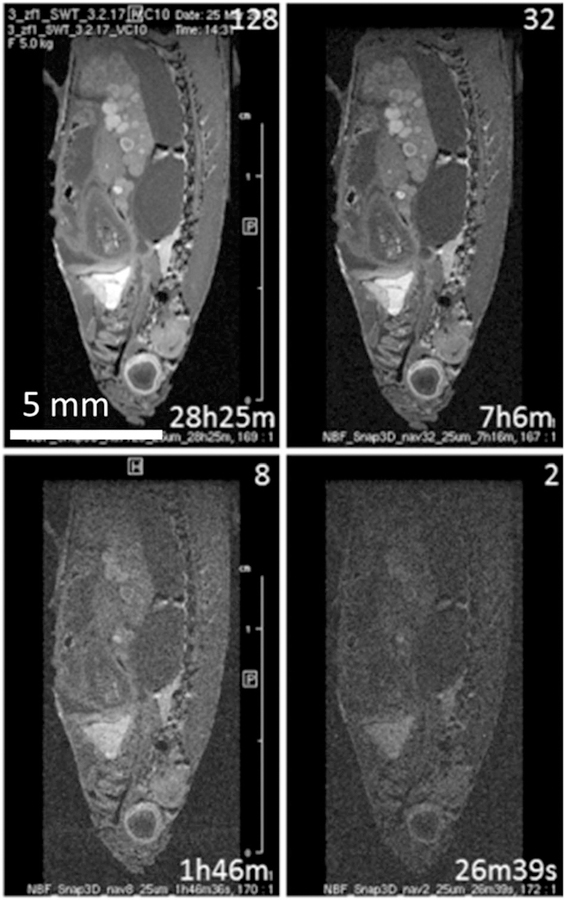
The resolution increase means spreading the same total signal over the larger number of pixels. Because the noise floor stays the same, the SNR decreases. Then, to preserve the same SNR, for higher resolution images more averages are needed. This is shown in Figure 5, where a slice from the 3D image of the same specimen as in Figure 4, recorded with isotropic resolution of 25 μm/pxl, is shown with increased number of scans. At least 16 averages and more than 3 h of scanning are needed to obtain a useful image with an isotropic resolution of 25 μm/pxl.
FIGURE 5.
A sagittal slice from 3D FISP images obtained with doubled isotropic resolution (25 μm/pxl) requires more than eight averages (2 h) to obtain a useful image. With 128 averages an excellent 3D image could be obtained, but with an impractically long scanning time of 28 h: VC10, TR 14, TRscan 467, TE 3.6, EncMtx 668 × 264 × 214, Mtx 800 × 352 × 256, FOV 20 × 8.8 × 6.4. The number of averages and the scanning times are indicated in the respective panels.
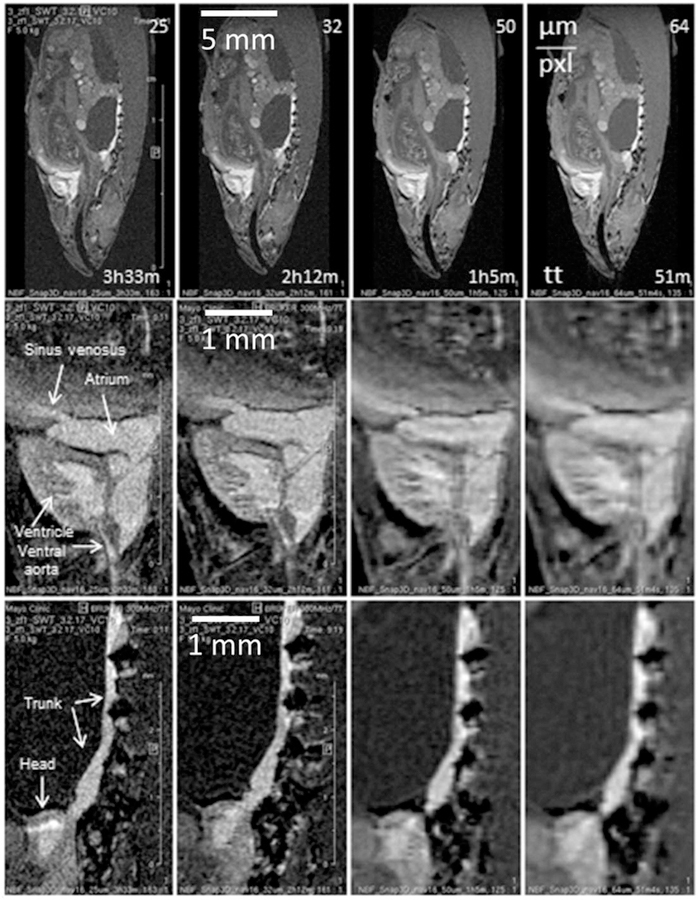
More averages and higher resolution produce better images but prolong the scanning time. This invokes an omnipresent question of parameter optimization or finding the minimal scanning time that reveals the information sought. Figure 6 shows the same slice from a series of 3D FISP images recorded with variable resolution and scanning time. Inspecting the images on the scale of the whole fish (Figure 6, top row), there is not much difference between the images with 25 μm/pxl and 64 μm/pxl resolution. However, upon zooming into the images, differences become obvious. The middle row in Figure 6 shows an enlargement of the heart region and the bottom row shows the kidney region. Advantages of higher resolution are very obvious only upon zooming into smaller regions of interest (ROIs).
FIGURE 6.
Sagittal slices from a series of 3D FISP images recorded with a VC10 coil at different resolutions. Scanning time and isotropic resolution are indicated in the top row for each column: TE 3.6, FOV 20 × 8.8 × 6.4, TR 14, TRscan 467, NAV 16. At the level of the whole zebrafish any resolution from 25 μm/pxl to 64 μm/pxl (isotropic) gives a useful image (top row). However, differences are obvious when images are inspected at the level of individual organs, middle row—heart, bottom row—kidney
3.3 |. FFPE zebrafish imaging
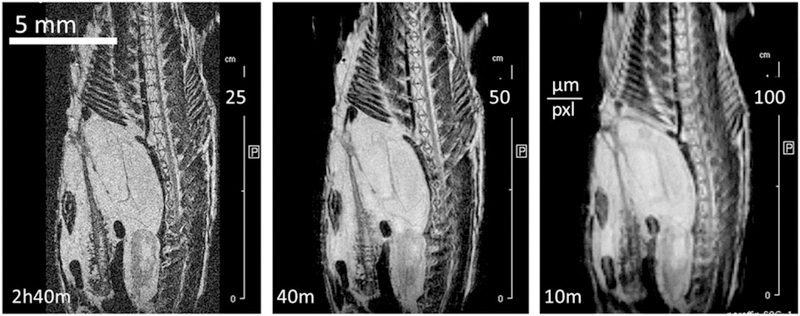
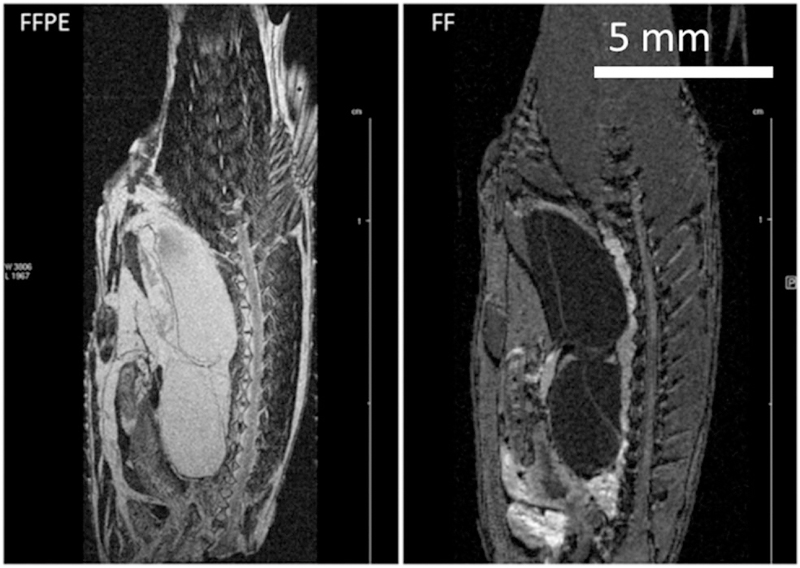
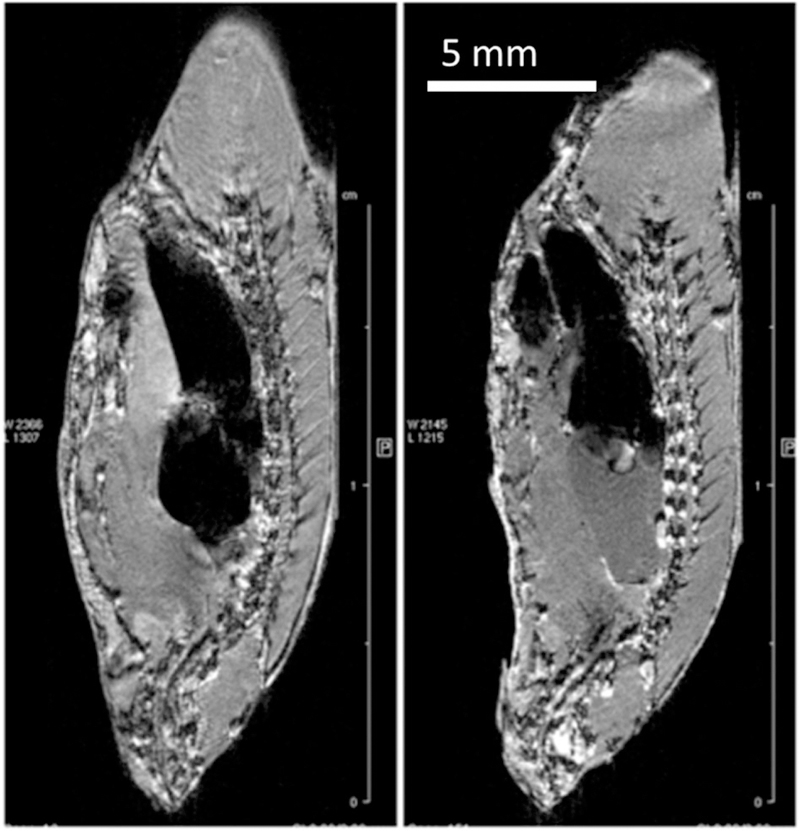
In FFPE specimens protons from paraffin are detected, with relaxation properties quite different from the water protons; thus, the sources of contrast in FFPE images (Figures 1B and 2B) are different from those in FF images (Figures 1A, 1C, 2A, and 2C). In paraffin, T1 is pretty uniform across the specimen but the spin density and T2 relaxation time vary significantly, making T2 weighting (RARE) most effective. Figure 7 shows a central sagittal slice from a series of 3D RARE experiments recorded with isotropic resolution in the range 25–100 μm/pxl. (The specimen was decapitated during paraffin embedding to make it fit into the embedding cassette.) The quality of FFPE images is comparable to the quality of FF images but with very different contrast. Figure 8 shows two matching slices from the same zebrafish specimen in paraffin (left) and in formalin (right). The complementarity of the contrast is striking. For example, in the water‐detected (FF) image, the kidney is bright, but in the paraffin it is dark. Also, the swim bladder and spinal cord are opposite, bright in the paraffin image and dark in water (FF).
FIGURE 7.
Central sagittal slice through 3D RARE of FFPE zebrafish at different resolutions (indicated in each frame): TEeff 43.8, TE 10.9, EncMtx 1024 × 320 × 160, Mtx 1024 × 320 × 160, FOV 25.6 × 8 × 4, RARE factor 8, TR 1500, NAV 1, tTC 69°C
FIGURE 8.
“Matching” slices from 3D RARE images of the same zebrafish specimen fixed and paraffin embedded. Left: FFPE, VC10, 3D RARE, TE 8.8, EncMtx 666 × 192 × 168, Mtx 800 × 256 × 200, FOV 20 × 6.4 × 5, RARE factor 1, TR 300, tt 5 h 22 min, Resol 25 × 25 × 25. Right: FF, 3D FLASH, VC20, TE 2.6, EncMtx 512 × 160 × 100, Mtx 512 × 160 × 100, FOV 25.6 × 8 × 5, TR 50, tt 7 h 6 min, Resol 50 × 50 × 50. The FFPE specimen is decapitated in preparation for paraffin embedding to fit into a standard embedding cassette.
3.4 |. Fresh (unfixed) zebrafish imaging
Freshly euthanized specimens can be imaged similarly to the fixed ones when the fixing time becomes an issue or when specimens are kept fresh for subsequent dissection. Although overall differences in relaxation properties between unfixed and fixed specimens are relatively small (T1fresh/ T1FF ~ 1000–2000/800–1200 and T2fresh/T2FF ~ 30–50/20–30) differences among tissues are much smaller and so is contrast in comparison to the fixed specimens. Figure 9 shows the central slice from a 3D FLASH image of the same unfixed specimen a few hours after euthanasia and two days later. Even after two days at 4°C the contrast is unaltered and the only changes are observed in the specimen shape (due to migration of liquid into the swim bladder). However, in unfixed tissue many reactions take place even at 4°C, and for reproducible relaxation measurement the specimen history must be strictly controlled.
FIGURE 9.
Sagittal slices through 3D FLASH images of fresh (unfixed) zebrafish: VC20, TR 50, TE 2.6, EncMtx 512 × 160 × 100, Mtx 512 × 160 × 100, FOV 32 × 10 × 6.4, Resol 64 × 64 × 64. Left: immediately after sacrifice, NAV 32, tt 7 h 6 min. Right: after 48 h in the scanner at 4°C, NAV 22, 4 h 53 min. The specimen changes shape over time due to migration of liquid into the swim bladder
3.5 |. Gd doped FF specimens
In rodent brain studies the fixative is doped with contrast agent and both reduction of the scanning time and improvement of contrast are observed.19,46–48 In our case (FF zebrafish in 1mM GdDTPA‐BMA, 21°C), a three‐ to fivefold shortening of T1 relaxation times was observed (Figure 2), but not significant contrast enhancement (Figure 10). Actually (except for the ovary and atrium), contrast was somewhat weakened as most tissue relaxation times converge toward the relaxation time of the agent (T1 = 200 ms @ 7 T, 21°C). Shortening of T1 helps in accelerating 3D FLASH experiment because significantly smaller TR could be used. Also, it helps in 3D RARE experiments (not shown), as the shortening of T2 (~40%) is modest compared with the shortening of T1 (400%). However, doping did not help much in 3D FISP experiments because they were already run with the shortest TR that our spectrometer can endure.
FIGURE 10.
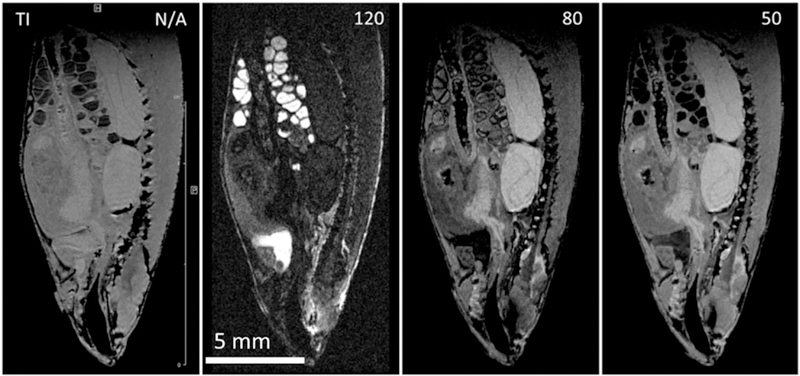
Sagittal slice from a series of 3D IR FLASH IR images of Gd doped (1mM GdDTPA‐BMA, Omniscan) FF zebrafish. Each image with isotropic resolution of 50 μm/pxl, TE 2, TR 350, EncMtx 333 × 148 × 74, Mtx 400 × 176 × 88, FOV 20 × 8.8 × 4.4, tt 4 h 15 min. A, No inversion; B, TI 120; C, TI 80; D, TI 50. Judicious selection of inversion time affords contrast enhancement of organs of interest
3.6 |. Organ segmentation
MRM provided detailed images of internal organs of intact fixed zebrafish. The brain, heart, and kidney contrast was sufficiently distinct from surrounding tissue to give enough contrast for organ segmentation. As shown in presented images, in most cases sufficient contrast could be obtained to allow segmentation of the brain, heart, and kidney. Once the individual organs were segmented, morphological measurements could be made. Figure 11 shows the organ segmentation from the 3D image shown in Figure 3: the zebrafish brain has a volume of 4.5 ± 0.2 mm3, the heart 0.82 ± 0.04 mm3, and the kidney 4.9 ± 0.2 mm3. (We report here only geometrical errors (less than 0.5%), which are much smaller than the variability introduced by different operators (~5%).42).
FIGURE 11.
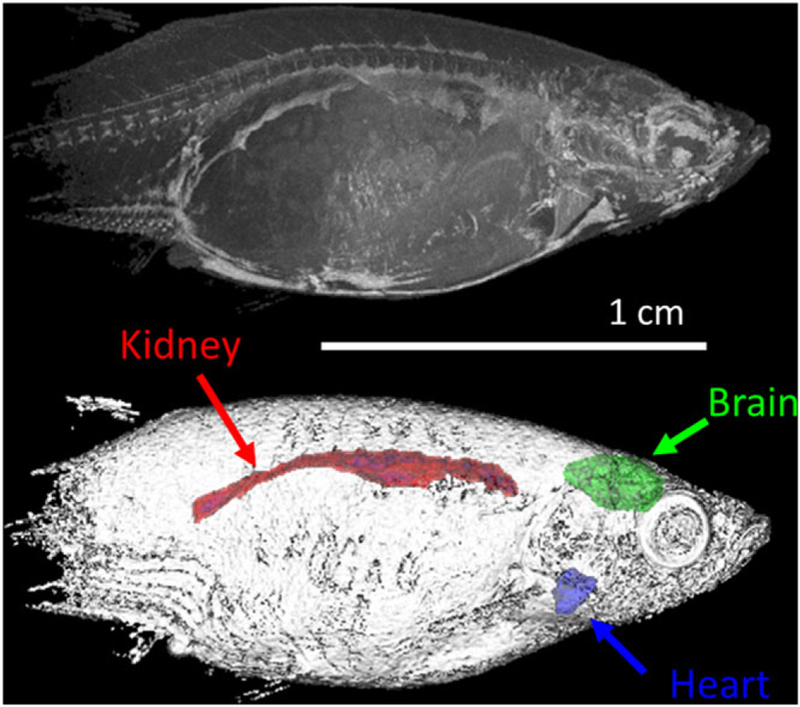
Organ segmentation from the 3D image shown in Figure 3. Top panel: maximum intensity projection of sagittal view of the zebrafish. Bottom panel: volume composite rendering of the zebrafish specimen with segmented brain, heart, and kidney. The image is recorded with 50 μm/pxl and segmented organ volumes are 4.5 mm3, 0.82 mm3, and 4.9 mm3 for the brain, heart, and kidney, respectively
4 |. DISCUSSION
Adult zebrafish specimens routinely either are dissected without fixation or are formalin fixed and subsequently paraffin embedded for histology. So we considered three types of commonly encountered specimen: FF, FFPE, and freshly euthanized zebrafish. For completeness we also imaged Gd doped FF specimens as the doping is easily achieved just by immersing an FF specimen into Gd doped PFA (fixative).
NMR parameters that modulate the image contrast strongly depend on the specimen preparation even if the preparations are supposedly the same. Namely, it is well known that the relaxation properties of fixed tissue depend on the tissue history,39 local conditions,49 and fixative origin and concentration.40 Also, we have shown that the T2 relaxation time in fixed tissue depends on the concentration of salt and buffer in formalin fixative.41 Most likely there are also other parameters (e.g. fixative impurities) that are hard to control. Whereas within a given laboratory by strict control of processing and measuring conditions one can aspire to obtain relaxation data of high precision, variability in relaxation times among different laboratories is unavoidable. This works aspires to describe a general approach for zebrafish organ quantification irrespectively of the specimen’s source, history, and fixative concentration and composition. Therefore we have selected to work with relaxation time ranges rather than with relaxation times of individual organs. We use relaxation ranges obtained from parametric images (Figure 1) of a single representative specimen rather than relaxation times that will require multiple measurements, specimens, and statistical analysis to be meaningful. We found 2D kernel density plots (Figure 2) to be the most useful way to present the relaxation time ranges and quantify relaxation times of different organs merely to indicate their positions within the T1, T2 space. These positions could be useful for finer tuning of acquisition parameters (TE, TR) by optimizing them to the organ of interest. Use of the relaxation ranges from representative samples in each specimen class (fresh, FF, FFPE, Gd doped) or from representative specimens from a given specimen cohort (within a selected class) enables optimal parameter selection for high contrast 3D images even when actual relaxation times vary among specimens.
Figures 1 and 2 show parametric plots and 2D kernel density plots of studied specimen classes. The solvent change from water (Figures 1A and 2A) to paraffin (Figures 1B and 2B) introduces the most dramatic changes, as the observed protons belong to completely different chemical species. We have previously shown that paraffin embedded specimens (at our level of interest) are stable on the scale of years.36 As described elsewhere,36,37 the paraffin interaction with surrounding tissue is negligible, making T1 relaxation times almost constant across the specimen and similar to the T1 of bulk paraffin (Figure 2B). Thus, T1 weighting in paraffin images is negligible. However, the T2 of paraffin is almost an order of magnitude longer than that of water, with an expanded range of T2 variability (Figure 2B). Consequently, T2W images in paraffin exhibit the strongest contrast. The paraffin penetration seems to be tissue dependent, thus revealing the tissue texture in spin‐density images (M0 in Figure 1B). In complete contrast to paraffin, the water images (apart from the swim bladder) show very weak contrast in spin‐density weighting, and very good contrast in T1 weighting (Figure 1A, 1C, and 1D. Finally, weighting by T2* is also possible in all cases, but local gradients that provide contrast also induce local image distortions.
Figure 3 shows a 3D IR RARE (T1W) image of an FF zebrafish obtained with isotropic resolution of 50 μm/pxl. The image is very informative, as numerous organs and anatomical details useful for mutant characterization could be easily distinguished (heart, brain, spinal cord, liver). In particular, the kidney is prominently bright, which is helpful for segmentation and morphology studies. The major drawback of IR experiments is relatively long scanning time (here almost 11 h) for a given resolution.
Possible ways to shorten scanning time, yet to preserve both high resolution and SNR, are to use coils with smaller diameter (here 10 mm instead of 20 mm) and faster scanning methods (here 3D FISP instead of 3D IR RARE). As shown in Figure 4, a good quality T1W image could be obtained in less than an hour (compared with more than10 h for image in Figure 3).
Imaging accelerated by the use of smaller coils and faster methods enables a resolution increase within manageable times. Figure 5 shows a slice from the same specimen as in Figure 4 scanned with doubled isotropic resolution (from 50 μm/pxl to 25 μm/pxl) with increasing number of scans. As is well known, by increasing the number of averages (NAV) SNR gradually increases, and satisfactory SNR is achieved with scans of 4 h.
On the scale of the whole specimen, it is hard to notice any improvement with the resolution increase beyond 100 μm/pxl (Figure 6 top row). However, upon zooming on the organ of interest benefits of increased resolution become evident (Figure 6 middle (heart) and bottom row (kidney)). If interest is in the organ size and shape only, then resolution of 64 μm/pxl, or even lower, could be quite satisfactory. If, however the organ structure and tissue texture are of interest, resolution of 25 μm/pxl or better is needed. There are two manifestations of 3D pixel merging caused by the resolution lowering. The first is obvious: in‐plane neighboring pixels begin to merge, which leads to image blurring. The second, less obvious to notice, is that the effective slice thickness increases with lowering resolution, merging slices that, at higher resolution, were separate. This can be noticed in the heart series (Figure 6, middle row), where in the 50 and 64 μm/pxl images the cross‐section of the aorta becomes obscured by the aorta walls originally above and below the selected slice (25 and 32 μm/pxl). Similarly, in lower resolution images the heart itself seems to have richer structure, mainly because features below and above the original slice become visible. In the kidney, high resolution images show kidney shape and boundaries more precisely, as well as a mottled appearance that may be indicative of its tubular structure. The ability to detect these variations in tissue appearance within the kidney may prove useful for detecting alterations in gross anatomy and tissue structure in disease models and experimental treatments.
Histology examinations of biological specimens commonly include paraffin embedding of FF tissue, so FFPE specimens are readily available irrespective of MRM. Above its melting point the paraffin signal is pretty strong, with T1 ~ 900 ms and T2 ~200 ms.36,37 Slightly shorter T1, and almost an order of magnitude longer T2, make paraffin rather superior for MRM in comparison to water. Relatively long T2 allows use of high RARE factors, which shortens scanning time significantly. A decent image could be obtained within 10 min, and excellent in less than 3 h (Figure 7).
Figure 8 shows a direct comparison between FF and FFPE images of the same specimen. Whereas the basic features (shape, size) are almost the same, the contrast is quite different. In FF the kidney and heart are very bright, whereas in FFPE they are dark. In contrast, FFPE images show a bright spinal cord, vertebrae, fins, and skeletal muscle striations. The heart and GI tract are discernible in both, but have a very different appearance. Nervous tissue seems to be highlighted in FFPE, which may be due to paraffin’s more efficient penetration into fat (myelinated) tissue. On the other hand, blood may appear brighter in FF, as suggested by the brighter kidney and heart, because paraffin is not affected by the presence of paramagnetic centers to the same extent as water.
Although not the highest quality, Figure 9 shows that images of unfixed specimens may be useful for quick checks of the specimens before dissection. Also, there is a broad repertoire of weighting methods that have not been tried in this work (diffusion weighted imaging, magnetization transfer) that could significantly improve the contrast.
Paramagnetic contrast agents act on the imaging contrast by shortening T1 and T2 in different tissues differently. This could be caused by selective accumulation of paramagnetic species, by selective alternation of local residence time of the paramagnetic center, and by its variable exposure to the bulk water. In addition, T2 relaxation time could be affected by chemical exchange of bulk water with fixative.50 In general, it is hard to predict which mechanism will prevail and how contrast will be affected. At one extreme the contrast agent uniformly distributes across the specimen, merely shortening T1 without any contrast enhancement, and on the other the agent selectively accumulates in different tissues, consequently enhancing contrast. In the present study we used standard contrast agent (Omniscan) to dope the fixative with a bulk Gd concentration of 1mM. Already the fixed specimen had been kept in a 10‐fold larger volume of doped fixative for several weeks at room temperature to make sure equilibrium distribution of the agent was achieved. Figure 1D suggest that the contrast agent accumulates in eggs (and atrium), as their relaxation times T1 and T2 are considerably shortened. Everywhere else the agent concentration is pretty uniform, as revealed by almost uniform shortening of T1. This shortening allows use of the IR method, which requires repetition times of the order of T1. An advantage of the IR method is that it can enhance contrast even between regions with very similar T1 values by careful selection of inversion recovery time (TI). Figure 10 shows a central sagittal slice from 3D T1W images of a Gd doped specimen without and with IR. Whereas the T1W image is pretty dull (Figure 10, TI N/A), the slices with different TI values have distinctly different contrasts. For example, with TI 120 the kidney is bright and with TI 80 dark. Similarly, atrium and ovary are very bright at TI 120 but become dark at TI 80 (atrium) or 50 (ovary).
Although the organ structure and tissue texture could be easily discerned from the images shown, our major aim here is the organ segmentation from MRM images. Our experience with segmentation of human MRI images42,51 is directly portable to the zebrafish MRM. As Figure 11 shows, main organs could be easily segmented from T1W images of an FF zebrafish specimen, which could make MRM a useful tool for mutant anatomy characterization.
MRM compares very favorably with other imaging modalities. Optical multispectral photoacoustic 3D tomography can obtain a 3D image with lateral/axial resolutions of 80 μm/600 μm, within 15 min.5 On the other hand, in vivo MRM of zebrafish with lateral/axial resolutions of 78 μm/500 μm (2D RARE multislice) within 5 min is reported,13 with much better contrast. Synchrotron x‐ray micro‐computed tomography (SR‐μCT)9 with submicrometer resolution (0.65 μm × 1.6 μm) outperforms MRM by an order of magnitude in terms of resolution, but has poor contrast, complex specimen preparation, and limited fields of view (FOVs) (1.7 mm × 1.4 mm). Also, contrast‐enhanced x‐ray micro‐computed tomography provides 3D images with superior resolution (8.7 μm/pxl within 25 min), but specimens must be soaked with iodine, providing modest contrast compared with MRM.8 Optoacoustic tomography provides 3D images with resolution and imaging time comparable to those of MRM (35 μm/pxl × 35 μm/pxl × 150 μm/pxl within 1 h), but contrast is rather poor.4 Finally, ultrasound biomicroscopy can image live zebrafish with a resolution of 38.5 μm/pxl × 38.5 μm/pxl × 68.2 μm/pxl within 30 min, but with modest to poor contrast.10 Overall, the main advantage of MRM compared with other modalities is very good control over the image contrast and ability to image specimens under very different conditions, including in vivo.11–16
We have shown that high resolution 3D MRM of zebrafish specimens in several common preparations (formalin fixed, formalin fixed paraffin embedded, and fresh after euthanasia) is quite useful for anatomic characterization. The main advantage of working with FF specimens is their long term stability, which enables a relaxed scanning schedule, specimen shipping for scanning, prolonged scanning time (hours, days), and mechanical firmness, which simplifies the specimen mounting. We were successful in delineating and segmenting different anatomical regions within the zebrafish specimens. This will facilitate future research where morphological characterization of changes associated with disease models is needed.
Supplementary Material
ACKNOWLEDGEMENT
This work is supported by the Mayo Clinic Robert M. and Billie Kelley Pirnie Translational PKD Center and the NIDDK grants P30DK090728 and K01DK110136.
Funding information
Mayo Clinic Robert M. and Billie Kelley Pirnie Translational PKD Center; NIDD, Grant/ Award Numbers: P30DK090728 and K01DK110136
Abbreviations used:
- Enc
Mtx encoding matrix, raw data size (pixels)
- FA
flip angle
- FF
formalin fixed
- FFPE
formalin fixed paraffin embedded
- FISP
fast imaging with steady state precession
- FLASH
fast low angle shot
- FOV
field of view (mm)
- IR
inversion recovery
- M0
spin density (a.u.)
- MGE
multi‐gradient echo
- MRM
(nuclear) magnetic resonance microscopy
- MSME
multi‐slice multi‐echo
- Mtx
matrix, image size (pixels)
- NAV
number of averages
- PFA
paraformaldehyde
- RARE
rapid acquisition with refocused echoes
- RARE‐VTR
variable repetition time RARE
- Resol
resolution (μm/pxl)
- ROI
region of interest
- SNR
signal to noise ratio
- T1W
T1 weighted
- T2*
observed (effective) transverse relaxation time (ms)
- T2W
T2 weighted
- TE
echo time (ms)
- TI
inversion recovery time (ms)
- TR
repetition time (ms)
- tt
total (acquisition) time
- tTC
thermo‐couple temperature
Footnotes
SUPPORTING INFORMATION
Additional supporting information may be found online in the Supporting Information section at the end of the article.
REFERENCES
- 1.Bryson‐Richardson RJ, Berger S, Schilling TF, et al. FishNet: an online database of zebrafish anatomy. BMC Biol 2007;5(1):34 [DOI] [PMC free article] [PubMed] [Google Scholar]
- 2.Bryson-Richardson RJ, Currie PD. Optical projection tomography for spatio-temporal analysis in the zebrafish. In: Detrich HW III, Westerfield M, Zon LI, eds. The Zebrafish: Cellular and Developmental Biology, Volume 76 2nd ed. San Diego, CA: Academic; 2004:38–50. [DOI] [PubMed] [Google Scholar]
- 3.Liu YB, Li DL, Yuan Z. Photoacoustic tomography imaging of the adult zebrafish by using unfocused and focused high-frequency ultrasound transducers. Appl. Sci 2016;6:392 10.3390/app6120392 [DOI] [Google Scholar]
- 4.Ma R, Distel M, Dean-Ben XL, Ntziachristos V, Razansky D. Non-invasive whole-body imaging of adult zebrafish with optoacoustic tomography. Phys Med Biol 2012;57(22):7227–7237. [DOI] [PubMed] [Google Scholar]
- 5.Huang N, Gu H, Qi WZ, et al. Whole-body multispectral photoacoustic imaging of adult zebrafish. Biomed Opt Express 2016;7(9):3543–3550. [DOI] [PMC free article] [PubMed] [Google Scholar]
- 6.Fieramonti L, Bassi A, Foglia EA, et al. Time-gated optical projection tomography allows visualization of adult zebrafish internal structures. PLoS One 2012;7(11):e50744 10.1371/journal.pone.0050744 [DOI] [PMC free article] [PubMed] [Google Scholar]
- 7.Rao KD, Alex A, Verma Y, Thampi S, Gupta PK. Real-time in vivo imaging of adult Zebrafish brain using optical coherence tomography. J Biophotonics 2009;2(5):288–291. [DOI] [PubMed] [Google Scholar]
- 8.Babaei F, Hong TLC, Yeung K, Cheng SH, Lam YW. Contrast-enhanced X-ray micro-computed tomography as a versatile method for anatomical studies of adult zebrafish. Zebrafish 2016;13(4):310–316. [DOI] [PubMed] [Google Scholar]
- 9.Seo E, Lim JH, Seo SJ, Lee SJ. whole-body imaging of a hypercholesterolemic female zebrafish by using synchrotron X-ray micro-CT. Zebrafish 2015;12(1):11–20. [DOI] [PMC free article] [PubMed] [Google Scholar]
- 10.Goessling W, North TE, Zon LI. Ultrasound biomicroscopy permits in vivo characterization of zebrafish liver tumors. Nat Methods 2007;4(7):551–553. [DOI] [PubMed] [Google Scholar]
- 11.Kabli S, Alia A, Spaink HP, Verbeek FJ, De Groot HJM. Magnetic resonance microscopy of the adult zebrafish. Zebrafish 2006;3(4):431–439. [DOI] [PubMed] [Google Scholar]
- 12.Kabli S, Spaink HP, De Groot HJM, Alia A. In vivo metabolite profile of adult zebrafish brain obtained by high-resolution localized magnetic resonance spectroscopy. J Magn Reson Imaging 2009;29(2):275–281. [DOI] [PubMed] [Google Scholar]
- 13.Kabli S, He SN, Spaink HP, et al. In vivo magnetic resonance imaging to detect malignant melanoma in adult zebrafish. Zebrafish 2010;7(2):143–148. [DOI] [PubMed] [Google Scholar]
- 14.Merrifield GD, Mullin J, Gallagher L, et al. Developing cardiac magnetic resonance imaging in the live zebrafish. Heart 2015;101:A6–A6. [Google Scholar]
- 15.Koth J, Maguire ML, McClymont D, et al. High-resolution magnetic resonance imaging of the regenerating adult zebrafish heart. Sci Rep 2017;7:2917 ARTN 2917. 10.1038/s41598-017-03050-y [DOI] [PMC free article] [PubMed] [Google Scholar]
- 16.Merrifield G, Mullin J, Gallagher L, et al. In vivo cardiac magnetic resonance imaging of adult zebrafish. Heart 2015;101:A96–A97. [DOI] [PMC free article] [PubMed] [Google Scholar]
- 17.Callaghan PT. Principles of Nuclear Magnetic Resonance Microscopy Oxford, UK: Oxford University Press; 1991. [Google Scholar]
- 18.Ullmann JFP, Cowin G, Kurniawan ND, Collin SP. A three-dimensional digital atlas of the zebrafish brain. Neuroimage 2010;51(1):76–82. [DOI] [PubMed] [Google Scholar]
- 19.Ullmann JFP, Cowin G, Kurniawan ND, Collin SP. Magnetic resonance histology of the adult zebrafish brain: optimization of fixation and gadolinium contrast enhancement. NMR Biomed 2010;23(4):341–346. [DOI] [PubMed] [Google Scholar]
- 20.Hagedorn M, Hsu EW, Pilatus U, Wildt DE, Rall WF, Blackband SJ. Magnetic resonance microscopy and spectroscopy reveal kinetics of cryoprotectant permeation in a multicompartmental biological system. Proc Natl Acad Sci USA 1996;93(15):7454–7459. [DOI] [PMC free article] [PubMed] [Google Scholar]
- 21.Canaple L, Beuf O, Armenean M, Hasserodt J, Samarut J, Janier M. Fast screening of paramagnetic molecules in zebrafish embryos by MRI. NMR Biomed 2008;21(2):129–137. [DOI] [PubMed] [Google Scholar]
- 22.Irazabal MV, Mishra PK, Torres VE, Macura SI. Use of ultra-high field MRI in small rodent models of polycystic kidney disease for in vivo phenotyping and drug monitoring. JoVE 2015;100:e52757. [DOI] [PMC free article] [PubMed] [Google Scholar]
- 23.Kline TL, Irazabal MV, Ebrahimi B, et al. Utilizing magnetization transfer imaging to investigate tissue remodeling in a murine model of autosomal dominant polycystic kidney disease. Magn Reson Med 2016;75(4):1466–1473. [DOI] [PMC free article] [PubMed] [Google Scholar]
- 24.Haase A, Frahm J, Matthaei D, Hanicke W, Merboldt KD. Flash imaging—rapid NMR imaging using low flip-angle pulses. J Magn Reson 1986;67(2):258–266. [DOI] [PubMed] [Google Scholar]
- 25.Hennig J, Nauerth A, Friedburg H. RARE imaging—a fast imaging method for clinical MR. Magn Reson Med 1986;3(6):823–833. [DOI] [PubMed] [Google Scholar]
- 26.Oppelt A, Graumann R, Barfuss H, Fischer H, Hartl W, Schajor W. FISP—a new fast MRI sequence. Electromedica 1986;54:15–18. [Google Scholar]
- 27.Harris PC, Torres VE. Polycystic kidney disease. Annu Rev Med 2009;60:321–337. [DOI] [PMC free article] [PubMed] [Google Scholar]
- 28.Mangos S, Lam PY, Zhao A, et al. The ADPKD genes pkd1a/b and pkd2 regulate extracellular matrix formation. Dis Model Mech 2010;3(5–6):354–365. [DOI] [PMC free article] [PubMed] [Google Scholar]
- 29.Obara T, Mangos S, Liu Y, et al. Polycystin-2 immunolocalization and function in zebrafish. J Am Soc Nephrol 2006;17(10):2706–2718. [DOI] [PMC free article] [PubMed] [Google Scholar]
- 30.Brand M, Heisenberg CP, Jiang YJ, et al. Mutations in zebrafish genes affecting the formation of the boundary between midbrain and hindbrain. Development 1996;123:179–190. [DOI] [PubMed] [Google Scholar]
- 31.Haffter P, Granato M, Brand M, et al. The identification of genes with unique and essential functions in the development of the zebrafish. Danio rerio Development 1996;123:1–36. [DOI] [PubMed] [Google Scholar]
- 32.Sun Z, Amsterdam A, Pazour GJ, Cole DG, Miller MS, Hopkins N. A genetic screen in zebrafish identifies cilia genes as a principal cause of cystic kidney. Development 2004;131(16):4085–4093. [DOI] [PubMed] [Google Scholar]
- 33.Sussman CR, Ward CJ, Leightner AC, et al. Phosphodiesterase 1A modulates cystogenesis in zebrafish. J Am Soc Nephrol 2014;25(10):2222–2230. [DOI] [PMC free article] [PubMed] [Google Scholar]
- 34.Cao Y, Semanchik N, Lee SH, et al. Chemical modifier screen identifies HDAC inhibitors as suppressors of PKD models. Proc Natl Acad Sci U S A 2009;106(51):21819–21824. [DOI] [PMC free article] [PubMed] [Google Scholar]
- 35.Macura S, Mishra P, Gamez J, Lucchinetti C, Pirko I. Magnetic resonance microscopy of paraffin embedded histology specimens. Virchows Arch 2015;467:S212–S212. [DOI] [PubMed] [Google Scholar]
- 36.Macura S, Mishra PK, Gamez JD, Pirko I. MR microscopy of formalin fixed paraffin embedded histology specimens. Magn Reson Med 2014;71(6):1989–1994. [DOI] [PubMed] [Google Scholar]
- 37.Macura S, Mishra PK, Gamez JD, Pirko I. NMR microscopy of tissue in organic and mixed solvents. J Serb Chem Soc 2013;78(11):1641–1654. [Google Scholar]
- 38.Westerfield M The Zebrafish Book. A Guide for the Laboratory Use of Zebrafish (Danio rerio) 4th ed. Eugene, OR: University of Oregon Press; 2000. [Google Scholar]
- 39.Raman MR, Shu YH, Lesnick TG, Jack CR, Kantarci K. Regional T1 relaxation time constants in ex vivo human brain: longitudinal effects of formalin exposure. Magn Reson Med 2017;77(2):774–778. [DOI] [PMC free article] [PubMed] [Google Scholar]
- 40.Birkl C, Soellradl M, Toeglhofer AM, et al. Effects of concentration and vendor specific composition of formalin on postmortem MRI of the human brain. Magn Reson Med 2018;79(2):1111–1115. [DOI] [PubMed] [Google Scholar]
- 41.Mishra PK, Vuckovic I, Nayfeh T, et al. Influence of fixative composition on the relaxation properties of fixed tissue. Paper presented at: 59th ENC (Experimental NMR Conference); April 29-May 4, 2018; Orlando, FL [Google Scholar]
- 42.Kline TL, Edwards ME, Korfiatis P, Akkus Z, Torres VE, Erickson BJ. Semiautomated segmentation of polycystic kidneys in T2-weighted MR images. Am J Roentgenol 2016;207(3):605–613. [DOI] [PMC free article] [PubMed] [Google Scholar]
- 43.Brown RW, Cheng Y-CN, Haacke EM, Thompson MR, Venkatesan R. Magnetic Resonance Imaging: Physical Principles and Sequence Design 2nd ed. Hoboken, NJ: Wiley; 2014. [Google Scholar]
- 44.Haacke EM, Frahm J. A guide to understanding key aspects of fast gradient-echo imaging. J Magn Reson Imaging 1991;1(6):621–624. [DOI] [PubMed] [Google Scholar]
- 45.Vincent DE, Wang TH, Magyar TAK, Jacob PI, Buist R, Martin M. Birdcage volume coils and magnetic resonance imaging: a simple experiment for students. J Biol Eng 2017;11:41 10.1186/s13036-017-0084-1 [DOI] [PMC free article] [PubMed] [Google Scholar]
- 46.Johnson GA, Ali-Sharief A, Badea A, et al. High-throughput morphologic phenotyping of the mouse brain with magnetic resonance histology. Neuroimage 2007;37(1):82–89. [DOI] [PMC free article] [PubMed] [Google Scholar]
- 47.Spencer RG, Fishbein KW, Cheng AW, Mattson MP. Compatibility of Gd-DTPA perfusion and histologic studies of the brain. Magn Reson Imaging 2006;24(1):27–31. [DOI] [PubMed] [Google Scholar]
- 48.Kim S, Pickup S, Hsu O, Poptani H. Enhanced delineation of white matter structures of the fixed mouse brain using Gd-DTPA in microscopic MRI. NMR Biomed 2009;22(3):303–309. [DOI] [PubMed] [Google Scholar]
- 49.Birkl C, Langkammer C, Golob-Schwarzl N, et al. Effects of formalin fixation and temperature on MR relaxation times in the human brain. NMR Biomed 2016;29(4):458–465. [DOI] [PubMed] [Google Scholar]
- 50.Rivlin M, Eliav U, Navon G. NMR studies of proton exchange kinetics in aqueous formaldehyde solutions. J Magn Reson 2014;242:107–112. [DOI] [PubMed] [Google Scholar]
- 51.Kline TL, Korfiatis P, Edwards ME, et al. Automatic total kidney volume measurement on follow-up magnetic resonance images to facilitate monitoring of autosomal dominant polycystic kidney disease progression. Nephrol Dial Transplant 2016;31(2):241–248. [DOI] [PMC free article] [PubMed] [Google Scholar]
Associated Data
This section collects any data citations, data availability statements, or supplementary materials included in this article.


