

Abstract
Objective
To study if the thalamic lateral geniculate nucleus (LGN) is affected in multiple sclerosis (MS) due to anterograde degeneration from optic neuritis (ON) or retrograde degeneration from optic radiation (OR) pathology, and if this is relevant for visual function.
Methods
In this cross-sectional study, LGN volume of 34 patients with relapsing-remitting MS and 33 matched healthy controls (HC) was assessed on MRI using atlas-based automated segmentation (MAGeT). ON history, thickness of the ganglion cell–inner plexiform layer (GC-IPL), OR lesion volume, and fractional anisotropy (FA) of normal-appearing OR (NAOR-FA) were assessed as measures of afferent visual pathway damage. Visual function was tested, including low-contrast letter acuity (LCLA) and Hardy-Rand-Rittler (HRR) plates for color vision.
Results
LGN volume was reduced in patients vs HC (165.5 ± 45.5 vs 191.4 ± 47.7 mm3, B = −25.89, SE = 5.83, p < 0.001). It was associated with GC-IPL thickness (B = 0.95, SE = 0.33, p = 0.006) and correlated with OR lesion volume (Spearman ρ = −0.53, p = 0.001), and these relationships remained after adjustment for normalized brain volume. There was no association between NAOR-FA and LGN volume (B = −133.28, SE = 88.47, p = 0.137). LGN volume was not associated with LCLA (B = 5.5 × 10⁻⁵, SE = 0.03, p = 0.998), but it correlated with HRR color vision (ρ = 0.39, p = 0.032).
Conclusions
LGN volume loss in MS indicates structural damage with potential functional relevance. Our results suggest both anterograde degeneration from the retina and retrograde degeneration from the OR lesions as underlying causes. LGN volume is a promising marker reflecting damage of the visual pathway in MS, with the advantage of individual measurement per patient on conventional MRI.
In multiple sclerosis (MS), the visual pathway represents a promising model to study neurodegenerative mechanisms, due to its frequent affection and its well-defined structure.1 This structure involves retinal ganglion cells, whose axons (after forming the optic nerves, partially crossing in the optic chiasm, and forming the optic tracts) synapse with neurons of the lateral geniculate nucleus (LGN). Axons of the LGN neurons merge into the optic radiations (OR) and project to the primary visual cortex (V1).
According to the transsynaptic axonal degeneration model,2,3 damaged axons in the visual pathway (for example, in the optic nerve after optic neuritis [ON] or in the OR due to lesions) can cause further neuroaxonal damage in other structures, with which they are connected through the LGN synapses. This model can explain why a history of ON is associated with mictrostructural damage in the OR2–4 and the visual cortex2,5 (anterograde degeneration from the optic nerve) and why OR lesions correlate with neuroaxonal damage in the retina (retrograde degeneration from the OR).6–8
Although anterograde and retrograde neurodegenerative cascades are proposed to occur through synapses in the LGN, the LGN itself was not part of previous studies of the visual pathway in MS, due to the technical difficulty of its measurement.2
Thus, the aim of this study was a reliable assessment of the LGN using atlas-based automated segmentation,9 to study whether its volume is reduced in MS and whether this is related to anterograde degeneration due to ON or retrograde degeneration due to OR pathology. Moreover, we aimed at assessing the associations of LGN volume with measurable visual dysfunction (low-contrast and color vision).
Methods
Study participants
In this cross-sectional study, we included patients with relapsing-remitting MS (RRMS) and healthy controls (HC), matched for age and sex. During a recruitment period of 18 months, we enrolled 34 patients from our neurology outpatient clinic at University Hospital Basel, fitting the following inclusion criteria: (1) diagnosis of RRMS according to the 2010 revised McDonald criteria,10 (2) disease duration less than 15 years, (3) age 18–45 years, (4) Expanded Disability Status Scale score below 6.0, and (5) relapse-free period of at least 6 months. The inclusion of only patients with relatively early RRMS was to focus on relapse- and lesion-associated damage of the LGN, thus limiting the effects of global neurodegeneration, as in secondary progressive/late disease stages. The assessment of positive ON history was made clinically, based on established, phenotypic diagnostic criteria.11
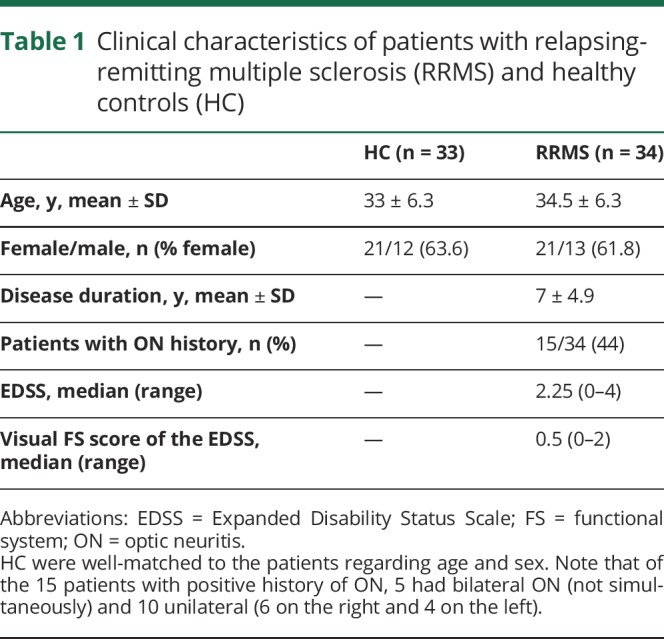
HC between 18 and 45 years old, without a history of neurologic, ophthalmologic, or psychiatric diseases and no refractive errors >6 diopters, were included in the study (n = 33). The characteristics of the study participants are presented in table 1.
Table 1.
Clinical characteristics of patients with relapsing-remitting multiple sclerosis (RRMS) and healthy controls (HC)
Standard protocol approvals, registrations, and patient consents
The study was approved by the local ethics committee (Ethikkommission Nordwest und Zentralschweiz, number 171/13) and conducted in accordance with the declaration of Helsinki. All participants gave written informed consent before inclusion in the study.
Assessment of the LGN
MRI was performed for all study participants on a 3T scanner (Prisma; Siemens, Erlangen, Germany). To estimate the volume of the LGN, the Multiple Automatically Generated Templates (MAGeT) Brain algorithm9 was used on 3D magnetization-prepared rapid gradient echo (MPRAGE) T1-weighted (T1W) images (repetition time [TR] = 1,570 ms, echo time [TE] = 2.48 ms, flip angle = 8°, 176 sagittal slices, isotropic, voxel size = 1 mm isotropic).
MAGeT uses an atlas12 derived from manually segmented serial histologic data, containing definitions of the thalamic nuclei, as per Hirai and Jones.13 It first customizes the atlas to a subset of participants, representative of the entire study population, using a nonlinear registration scheme.14 In our study this representative subset consisted of 11 patients and 10 HC, selected in a manner consistent with best practices for the algorithm,15,16 that is, according to age, sex, and, for patients, history of ON. The characteristics of these participants were very similar to the respective study groups: (1) for the 11 patients: 7 women/4 men, mean age 33.7 ± 6.8 years, 5/11 with ON and (2) for the 10 HC: 6 women/4 men, mean age 33.9 ± 7 years. This segmented subset acted as a template library for the remaining participants. This had the benefit of accounting for the neuroanatomical variability of our study population and averaging different sources of random error prior to the final segmentation.9,14 A visual quality assessment of the segmentation of all the thalamic nuclei produced by the pipeline was performed and the volumes of the LGN of each participant were extracted. Moreover, the volumes of the medial geniculate nucleus (MGN; also assessed through MAGeT) were used in a control analysis, to ensure that the findings regarding the LGN are specific for the visual pathway. An example of the LGN segmentation using MAGeT is depicted in figure 1.
Figure 1. Assessment of the lateral geniculate nucleus (LGN) and the other nodes of the visual pathway.

As shown on the left, the LGN is the central node of the visual pathway: its neurons receive input from the retinal ganglion cells and send their axons as optic radiations (OR) towards the primary visual cortex. To investigate structural damage of the LGN and how this is related to anterograde degeneration (from the retina) and retrograde degeneration (from the OR), the following nodes of the visual pathway were assessed. (A) The integrity of the retinal ganglion cells was assessed using optical coherence tomography (OCT). The mean ganglion cell–inner plexiform layer (GC-IPL) thickness refers to the composite of the macular ganglion cell and inner plexiform layers, shown between the green and blue lines on the OCT image. (B) The volume of the LGN was measured per individual on 3D magnetization-prepared rapid gradient echo (MPRAGE) T1-weighted MRI, using the Multiple Automatically Generated Templates algorithm (MAGeT) Brain algorithm.9 In this coronal MPRAGE image, the segmentation of thalamic nuclei is shown, including the LGN in red. Note also the medial geniculate nucleus in green, directly medial to the LGN, which was used as a control nucleus in our analysis. (C, D) In the OR, lesional and nonlesional damage were assessed separately. Diffusion-weighted MRI was used to assess the OR bundles (C) and the mean fractional anisotropy (FA). The white matter lesion mask (shown in yellow in D) was combined with the OR bundles to assess the volume of lesions located inside the OR (OR lesion volume, shown in green due to overlap of blue and yellow). The OR lesion volume and the mean FA in normal-appearing OR (NAOR-FA) were used in the analysis. The schematic figure of the afferent visual system (on the left) is adapted from the website of the Neurodiagnostics Laboratory @ Charité-Universitätsmedizin Berlin, Germany (neurodial.de/2017/08/25/schematic-figure-the-afferent-visual-system-creative-commons-license).
Assessment of the other nodes of the afferent visual pathway
Ganglion cells
The integrity of the ganglion cells in the retina was assessed using spectral-domain optical coherence tomography (OCT) on a Heidelberg Engineering Spectralis device (Heidelberg, Germany), in a dark room, without pupil dilation. Both eyes of one patient were excluded of the analysis due to incidental findings. OCT quality control was performed applying the OSCAR-IB criteria, and all other images passed quality assessment.17 We report the OCT acquisition settings and scanning protocol according to the Advised Protocol for OCT Study Terminology and Elements (APOSTEL) recommendations.18
Macular data were obtained with a macular volume scan, with eye-tracking (scan details: 25° × 30°, 61 vertical B-scans, 768 A-scans per B-scan, ART = 15). Intraretinal segmentation of the macula was done semi-automatically with the software provided by Heidelberg Engineering (Eye Explorer 1.9.13.0). Segmentation results were checked and corrected where needed by one rater and the final segmentation was approved by a second experienced OCT rater. For analysis, the mean composite of ganglion cell and inner plexiform layers (GC-IPL) thickness of the inner macular region (3-mm-diameter cylinder of the 1, 3, 6-mm ring adjacent to the fovea) was used, since it contains the highest proportion of ganglion cells.19
Optic radiations
OR integrity was assessed through diffusion-weighted imaging processing (64-gradient directions, TR = 6,300 ms, TE = 77 ms, b = 1,000, voxel size = 2 × 2 × 2.4 mm, 55 slices) and tractography. The OR was extracted from the whole brain tractogram using the RecoBundles algorithm.20 Once extracted, the white matter bundles were processed through an additional tractometry pipeline21 for computation of the fractional anisotropy (FA). The extracted OR of each participant was observed with MI-Brain software22 for quality assurance. The following MRI metrics were used: (1) FA of the normal-appearing OR (NAOR-FA), that is, not including the OR lesions, and (2) OR lesion volume.
To calculate the OR lesion volume, first, all white matter lesions (WML) were segmented on 3D fluid-attenuated inversion recovery images (TR = 5,000 ms, TE = 393 ms, flip angle = 120°, 176 slices, isotropic, voxel size = 1 mm) using a semi-automatic procedure based on AMIRA 3.1.1 software (Mercury Computer Systems, Andover, MA). Then, the WML mask and the OR mask were combined to identify the overlaps, that is, the OR lesion volume (figure 1).
Primary visual cortex
The binary WML mask created as explained above was also used to fill the WML in the T1W images,23 to reduce biases in white/gray matter classification and image registration. The T1W filled images were used to estimate the cortical thickness by the FreeSurfer pipeline (version 5.3, surfer.nmr.mgh.harvard.edu/). The mean thickness of V1 (labeled by FreeSurfer as V1) was extracted.
Total brain volume
Normalized brain volume (NBV) was calculated for each participant from the T1W images using SIENAX,24 to adjust the analysis for metrics of global neurodegeneration.
Assessment of visual function
All tests of visual function were performed monocularly using habitual correction (glasses/contact lenses). Visual acuity was assessed by Sloan Letter Charts with 100% (high) contrast, as well as 2.5% and 1.25% contrast (low-contrast letter acuity [LCLA])25 and the number of correct letters per eye was recorded. Three eyes of 3 patients with MS were excluded due to amblyopia affecting their vision.
Color vision was assessed by the Ishihara test and the Hardy-Rand-Rittler (HRR) pseudoisochromatic test. The HRR was used since it may be more accurate than Ishihara for acquired dyschromatopsia.26 The number of correctly identified Ishihara plates (maximum of 13) and HRR symbols in the 20 scored plates (maximum of 36)26 per eye were recorded. To define abnormal results, we used the cutoff point of 1 error for Ishihara (as suggested by the official Ishihara instructions) and 2 errors for HRR (as previously suggested26). Participants who had Ishihara results suggesting an inherited red/green deficiency (strong deuteranomaly) were excluded from the analysis of color vision (2 patients and 1 HC). One additional patient with missing Ishihara and 4 participants (2 patients, 2 HC) with missing HRR results were also excluded from color vision analysis.
Statistical analysis
For measures that were not normally distributed (HRR, OR lesion volume) Spearman correlation tests were used. The Spearman correlations were always performed at a patient level; that is, we used the average (or for volumes, the sum) of the 2 measurements per patient.
If not stated otherwise, group comparisons and structural–structural associations were performed using linear mixed effect models (LMM), to account for intrapatient interside dependencies.18 Age and sex were included as fixed effects, apart from the LMM comparing patients and HC, since these 2 groups were well-matched for age and sex. Random effects in the LMM were always the participant and, for LGN volume, also the brain side, since this was associated with LGN volume and showed an interaction with group (patients vs HC).
To study anterograde degeneration in patients from the optic nerve/retina to the LGN, LMM including each time ON history in any eye or mean GC-IPL thickness were performed. For GC-IPL thickness, we used the mean of temporal quadrant of ipsilateral (to the LGN) eye and nasal quadrant of contralateral eye to specifically include the ganglion cells giving afferences to each LGN. To adjust for global neurodegeneration, we performed 2 additional LMM: one including NBV and one including entire thalamic volume (sum of all thalamic nuclei excluding the LGN). Moreover, we performed an additional sensitivity analysis after exclusion of 6 influential cases identified by the Cook distance analysis. The association of mean GC-IPL thickness and LGN volume was also studied separately in patients with ON (MS-ON) and patients without ON in any eye (MS-NON).
To study retrograde degeneration in patients with RRMS from the OR to the LGN, Spearman correlation test was used for OR lesion volume (due to the non-normal distribution) and LMM for NAOR-FA. Moreover, 3 partial correlation analyses (Spearman) were performed between OR lesion volume and LGN, each correcting for mean GC-IPL thickness, NBV, and total lesion volume.
To compare visual tests between patients and HC we used LMM for 100%, 2.5% and 1.25% contrast letter acuity [LA] and Fisher exact test for Ishihara and HRR (comparison of proportions of abnormal results). Finally, we studied the associations of LGN (and the other nodes of the visual pathway) with LCLA (1.25%) and color vision (HRR) using LMM and Spearman correlation test, respectively. Although the LMM for 1.25% LCLA were performed at eye level, we used both sides of the postchiasmatic MRI measures (LGN volume sum, mean NAOR-FA of both sides, etc.), since both hemispheres could influence the vision of each eye, due to the partial crossing of the optic nerves.
The same analysis as for the LGN volume was performed with MGN volume, as a control nucleus, to ensure that our findings are specific for the visual pathway.
For all models, statistical significance was achieved at p < 0.05. We report effect sizes from LMM as marginal R2 (mR2), representing the variance explained by the fixed effects alone, and as conditional R2 (cR2), representing the variance explained by both fixed and random effects. The statistical analysis was performed using R (version 3.4.3 with packages pastecs, lme4, lmerTest, MuMIn, ppcor, and influence.ME). Graphical representations were created using the ggplot2 package.
Data availability statement
All anonymized data not published within this article will be shared by request from any qualified investigator.
Results
Patients with RRMS and HC were well-matched regarding age and sex (table 1).
Fifteen patients had positive ON history (MS-ON) and 19 patients did not have ON in any eye (MS-NON).
Patients performed worse in 2.5% and 1.25% LCLA compared to HC, while no difference was observed for high-contrast letter acuity (table 2).
Table 2.
Differences between patients with relapsing-remitting multiple sclerosis (RRMS) and healthy controls (HC) in measures of visual function

Regarding color vision, we saw higher proportions of abnormal results in patients than HC (e.g., for HRR: 23.3% vs 3.3%), but this did not reach statistical significance (for HRR: p = 0.052, table 2).
LGN volume is smaller in patients with RRMS vs HC
In HC, LGN volume was associated with sex (B = 20.16, SE = 7.60, p = 0.013, with men having higher volumes than women) and brain side (B = −82.42, SE = 2.92, p < 0.001), with the left LGN being smaller than the right.
LGN volume was smaller in patients with RRMS vs HC (mean volume in patients: 165.5 ± 45.5 mm3 vs 191.4 ± 47.7 in HC, B = −25.89, SE = 5.83, p < 0.001, mR2 = 0.04, cR2 = 0.95). The mR2 indicates that 4% of the variance in LGN volume was explained by group (RRMS vs HC). The high cR2 was due to the effects of brain side and participants (individual variability) on LGN volume.
LGN volume and anterograde degeneration: Associations with ON and GC-IPL thickness
Mean LGN volume in MS-ON patients was 163.4 ± 40.4 mm3 vs 167.2 ± 49.7 in MS-NON patients. Patients with bilateral ON (n = 5) had mean LGN volume of 149 ± 38.7 mm3. History of ON (in any eye) was not associated with LGN volume in the LMM accounting for age, sex, and brain side (B = −3.71, SE = 9.77, p = 0.707).
However, there was an association between GC-IPL thickness (mean of temporal ipsilateral and nasal contralateral eye) and corresponding LGN volume (B = 0.95, SE = 0.33, p = 0.006), with 5% of the variance in LGN volume being explained by GC-IPL thickness (mR2 = 0.05, cR2 = 0.93; figure 2). This association remained after adjustment for NBV (B = 0.84, SE = 0.35, p = 0.022, mR2 = 0.06, cR2 = 0.93), as well as in the sensitivity analysis after exclusion of 6 influential cases (B = 1.03, SE = 0.20, p < 0.001, mR2 = 0.07, cR2 = 0.92).
Figure 2. Relationship of lateral geniculate nucleus (LGN) with mean ganglion cell–inner plexiform layer (GC-IPL) thickness and optic radiations (OR) lesion volume.
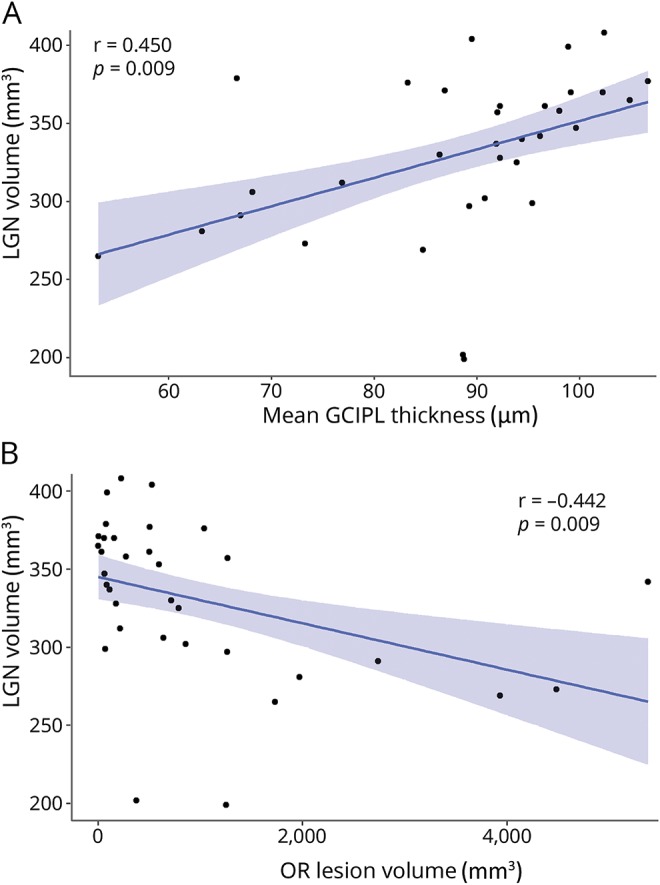
The relationship between LGN volume (sum of both hemispheres) and (A) GC-IPL thickness (mean of both eyes) and (B) OR lesion volume (sum of both hemispheres) is shown. LGN volume was associated with mean GC-IPL thickness in a linear mixed effect model (B = 0.95, SE = 0.33, p = 0.006), also after adjustment for normalized brain volume and correlated with OR lesion volume (ρ = −0.53, p = 0.001), also after adjustment for total lesion volume. The Pearson r for both correlations is shown.
In the subgroup analysis, an association of GC-IPL with LGN was found only in patients with ON history (n = 15, B = 1.15, SE = 0.25, p < 0.001, mR2 = 0.08, cR2 = 0.93) and not in MS-NON patients (n = 19, B = 1.19, SE = 0.69, p = 0.096). In the MS-ON subgroup, GC-IPL was associated with LGN, also after adjustment for NBV (B = 1.13, SE = 0.28, p = 0.002, mR2 = 0.08, cR2 = 0.93).
In an analysis adjusted for entire thalamic volume, GC-IPL did not remain associated with LGN in the entire patient group (B = 0.23, SE = 0.27, p = 0.389), but only in the MS-ON subgroup (B = 0.95, SE = 0.42, p = 0.037, mR2 = 0.09, cR2 = 0.93).
LGN volume and retrograde degeneration: Associations with OR lesions and NAOR-FA
There was a correlation between LGN volume and OR lesion volume (for both measures: analysis per patient, i.e., with sum of both hemispheres; ρ = −0.53, p = 0.001; figure 2). Partial correlation analysis revealed that LGN volume was still associated with OR lesion volume when controlling for GC-IPL thickness (mean of both eyes; ρ = −0.35, p = 0.049), suggesting an independent effect of both anterior and posterior visual pathway damage on LGN volume. Moreover, the correlation of OR lesion volume with LGN remained after controlling for NBV (ρ = −0.47, p = 0.007) and for total lesion volume (ρ = −0.42, p = 0.018).
In contrast to OR lesions, NAOR-FA was not associated with LGN volume (B = −133.28, SE = 88.47, p = 0.137).
LGN volume and visual function: 1.25% LCLA
There was no association between LGN volume (sum of both hemispheres) and 1.25% LCLA in the LMM (B = 5.5 × 10⁻⁵, SE = 0.03, p = 0.998). To elucidate this further, we also studied the relationship of 1.25% LCLA with the other nodes of the visual pathway and found an association with ipsilateral GC-IPL thickness (B = 0.25, SE = 0.08, p = 0.002, mR2 = 0.17, cR2 = 0.72) and mean NAOR-FA of both hemispheres (B = 64.61, SE = 31.87, p = 0.050, mR2 = 0.10, cR2 = 0.72). OR lesion volume (ρ = −0.09, p = 0.608) and mean V1 cortical thickness (B = −7.14, SE = 11.52, p = 0.540) were not related to 1.25% LCLA.
LGN volume and visual function: HRR color vision
LGN volume (sum of both hemispheres) correlated with HRR color vision (mean of both eyes; ρ = 0.39, p = 0.032; table 3). Among the other nodes of the visual pathway, only GC-IPL thickness (mean of both eyes) showed a correlation with the HRR (ρ = 0.48, p = 0.008; table 3).
Table 3.
Associations of lateral geniculate nucleus (LGN) volume and the other nodes of the afferent visual pathway with Hardy-Rand-Rittler (HRR) color vision in patients with relapsing-remitting multiple sclerosis

Control analysis with the medial geniculate nucleus
To ensure that the associations found for the LGN reflect degeneration along the visual pathway and not merely global neurodegeneration in the MS brain, next to adjusting for NBV and for entire thalamic volume, we also performed a similar analysis with a control nucleus. We used the MGN, because it is located near the LGN (figure 1), has a similar size, but is involved only in the auditory and not the visual pathway.27
Mean MGN volume was not smaller in patients with RRMS (187.4 ± 27.9 mm3) vs HC (195.8 ± 32.4; B = −8.40, SE = 6.14, p = 0.176).
MGN was not associated with GC-IPL in the LMM including age, sex, and brain side (B = 0.32, SE = 0.27, p = 0.242), nor was it correlated with OR lesion volume (ρ = −0.29, p = 0.093). Moreover, it did not show associations with visual function (for 1.25% LCLA: B = −0.02, SE = 0.03, p = 0.514; for HRR: ρ = 0.13, p = 0.479).
Discussion
We found reduced LGN volumes in patients vs matched HC, suggesting structural LGN damage in RRMS. The LGN is the central node connecting the anterior with the posterior visual pathway. The concept of transsynaptic axonal degeneration in MS is based on the propagation of neuroaxonal damage through the LGN synapses.2–4,6,7,28,29 However, the LGN has not been previously assessed and studied in this context.
Instead, the volume of the entire thalamus was associated with retinal damage in 2 previous studies: one of them used voxel-based morphometry (VBM) and showed that retinal axonal loss (measured as thinning of the retinal nerve fiber layer [RNFL]) was associated with a decrease in the volume of thalamus and the visual cortex.2 The other study showed a cross-sectional correlation between RNFL and thalamic volume in MS.30
However, the thalamus has multiple nuclei with many different functions and shows structural changes early in the course of MS.31 Moreover, neuroaxonal loss in the retina correlates with brain atrophy32 and is thought to generally reflect neurodegenerative processes in MS.33 Thus, a specific assessment of the LGN is crucial to investigate neurodegeneration occurring specifically in the visual pathway.
The reason for the lack of studies assessing specifically the LGN in MS is probably its small size, which makes its measurement technically challenging.2 Some studies in glaucoma34–36 and one study in neuromyelitis optica spectrum disorders37 assessed the LGN using manual segmentation, but this method is highly prone to bias, for such a small gray matter structure as the LGN.15
In the present study, the LGN volume was assessed using an atlas-based tool of automated segmentation of all thalamic nuclei, the MAGeT Brain algorithm.9 The MAGeT algorithm was validated against manual segmentations,14 intraoperative recordings,38 and functional MRI.39 It was previously used to investigate deep gray matter volume in HC and patients with neurologic disorders.15,39,40 The MAGeT Brain algorithm for the assessment of the LGN volume has all the advantages of automated (vs manual) segmentation with reduction of random errors. The latter is achieved through the generation of a template library from a representative subset of the study population (see also under Methods for more details). Moreover, it enables the measurement of the LGN volume at an individual level, in contrast to techniques like VBM, which can only be used to compare groups.
Next to showing that LGN volume is reduced in RRMS, we found that it is associated with retinal damage (mean GC-IPL thickness) and OR lesion volume. Although the effect size of the GC-IPL–LGN association was not large (most LGN variance being explained by brain side and individual variability among patients) and the OR lesion volume–LGN correlation was moderate, the results remained after adjustment for global neurodegeneration (NBV) and total lesion volume, respectively. These findings suggest that both anterograde degeneration from the anterior visual pathway and retrograde (Wallerian) degeneration from OR lesions are mechanisms contributing to LGN volume loss in MS.
The association between LGN and damage in the anterior visual pathway is in line with histologic data showing a strong correlation between axonal loss in the optic nerves and dispersions of neuronal sizes in the LGN of 8 postmortem MS brains.41 In this regard, it was surprising that we did not find history of ON to be associated with LGN volume, despite the association of GC-IPL thickness with LGN volume in the entire cohort and in the MS-ON subgroup. A possible explanation is that ON is based on clinical criteria and has heterogeneous course and severity, resulting in a variable degree of retinal damage.42 Thus, the GC-IPL thickness, which quantifies this damage, is probably a better measure than ON history to study structural associations in the visual pathway.
It has to be noted, that the association between mean GC-IPL thickness and LGN volume in our study survived adjustment for entire thalamic volume only in the subgroup of patients with ON history. This suggests that in these patients with more severe retinal damage, anterograde degeneration specifically to the LGN is probably independent of more global associations between retinal damage and thalamic volume loss. However, in the entire patient group, including patients without ON history, the relationship between damage in the retina and in the entire thalamus masks a more specific association with the LGN. This could be due to parallel neurodegenerative processes in the CNS (retina, thalamus) in MS, but also due to the fact that other thalamic nuclei, such as the pulvinar and the lateral posterior nucleus, are known to be involved in visual processing.
The correlation between OR lesions and LGN is in line with a previous study,43 which found an association between presence of OR lesions and LGN atrophy in 61 patients with MS. However, this study43 used VBM on 1.5T MRI and lesion probability maps to assess atrophy in the LGN area and presence of OR lesions, respectively, at a group level. Our study confirms the link between LGN and OR lesions through an assessment at an individual level.
Interestingly, the anterograde (from the retina) and retrograde (from OR lesions) degenerative processes seem to have independent and thus likely additive effects on LGN volume, since the association between LGN and OR lesions remained in partial correlation analysis correcting for GC-IPL. This, together with the correlation between LGN volume and HRR color vision, underlines the role of the LGN as a central node of the visual pathway, which reflects neurodegenerative processes and has functional relevance. Thus, the LGN volume assessed by MAGeT can be a useful marker in the study of damage along the visual pathway, with the advantages of individual measurement per patient on widely available MRI sequences, such as high-resolution 3D T1W. The latter is important, since most of the currently used measures of the visual pathway (GC-IPL, RNFL, FA of the optic nerve, FA of the OR) require either OCT or diffusion-weighted imaging, which are often not available in clinical practice.
The LGN volume was smaller in the left vs right brain hemisphere of the HC in our study. Such a right–left asymmetry was not previously described for the LGN, but this can be due to the small number of studies directly measuring this small structure and the previous use of only manual segmentation.34,36,37 A previous study using MAGeT in MS14 only reported the combined LGN volume of both hemispheres (343 ± 53 mm3, which is similar to our cohort: 331 ± 50.7), without examining interhemisphere differences. However, asymmetries of thalamic regions were described before and seem to be more pronounced for nuclei that project to a few, clearly defined cortical fields.44 Thus, it seems possible that the LGN asymmetry in our study is at least partly a physiologic phenomenon, although further studies in larger populations are needed to confirm this.
Regarding functional relevance of LGN damage, we found a correlation between LGN volume and HRR color vision. Besides the LGN, mean GC-IPL thickness also strongly correlated with HRR, which is in line with a previous study.45 However, LGN volume was not associated with low-contrast vision (1.25% LCLA) in our study. On the contrary, GC-IPL thickness and NAOR-FA were related to 1.25% LCLA, in line with previous findings.46–48
The relatively low number of patients and the cross-sectional design are the main limitations of our study. The lack of longitudinal data does not allow us to definitively conclude whether the relationships of LGN with GC-IPL and OR lesion volume are truly causal. To increase the specificity of our findings, we conducted a similar analysis with a control nucleus: the MGN. For this nucleus, which is not related to the visual pathway, we did not find associations with GC-IPL, OR lesion volume, or visual function. Moreover, we adjusted our analysis for a measure of global neurodegeneration (NBV) and for total lesion volume, and the associations of LGN with GC-IPL thickness and OR lesion volume, respectively, remained.
A further limitation may be that we did not include measures of the optic tract (OT) in our analysis. However, OT lesions are rare in MS49 and it is unlikely that they would interfere substantially with our results. Moreover, we included only patients with RRMS with relatively short disease duration (7 ± 4.9 years). This may also explain the lack of association between GC-IPL thickness and LGN volume in patients without ON, since retinal damage in absence of ON in early RRMS is less pronounced than in late RRMS and progressive MS.50 A larger study, including also patients with longer disease duration and progressive forms of MS, may be useful to confirm our findings and further investigate the neurodegenerative mechanisms leading to LGN damage in patients with and without ON.
Glossary
- cR2
conditional R2
- FA
fractional anisotropy
- GC-IPL
ganglion cell and inner plexiform layers
- HC
healthy controls
- HRR
Hardy-Rand-Rittler
- LA
letter acuity
- LCLA
low-contrast letter acuity
- LGN
lateral geniculate nucleus
- LMM
linear mixed effect models
- MAGeT
Multiple Automatically Generated Templates algorithm
- MGN
medial geniculate nucleus
- MPRAGE
magnetization-prepared rapid gradient echo
- mR2
marginal R2
- MS
multiple sclerosis
- MS-NON
multiple sclerosis without optic neuritis
- MS-ON
multiple sclerosis with optic neuritis
- NAOR-FA
fractional anisotropy of the normal-appearing optic radiations
- NBV
normalized brain volume
- OCT
optical coherence tomography
- ON
optic neuritis
- OR
optic radiations
- OT
optic tract
- RNFL
retinal nerve fiber layer
- RRMS
relapsing-remitting multiple sclerosis
- T1W
T1-weighted
- TE
echo time
- TR
repetition time
- V1
primary visual cortex
- VBM
voxel-based morphometry
- WML
white matter lesions
Appendix. Authors

Study funding
This study was partly funded by the Swiss Multiple Sclerosis Society and the University of Basel.
Disclosure
A. Papadopoulou has consulted for Teva and received speaker fees from Sanofi-Genzyme and travel support from Bayer AG, Teva, UCB-Pharma AG, and F. Hoffmann-La Roche. Her research was/is being supported by the University of Basel, the Swiss Multiple Sclerosis Society, the Swiss National Science Foundation (project number P300PB_174480), and the “Stiftung zur Förderung der gastroenterologischen und allgemeinen klinischen Forschung sowieder medizinischen Bildauswertung.” L. Gaetano was a temporary employee of Novartis AG and is currently an employee of F. Hoffmann-La Roche, although her contribution to the manuscript was prior to that. A. Pfister, A. Altermatt, and C. Tsagkas report no disclosures relevant to the manuscript. F. Morency is the chief technical officer at Imeka Solutions Inc. A. Brandt is cofounder and shareholder of technology startups Motognosis and Nocturne. He is named as inventor on several patent applications describing MS serum biomarkers, perceptive visual computing-based motor diagnostics, and retinal image analysis. M. Hardmeier’s institution has received fees from industry for consultancy services (Roche, Basel, Switzerland) and an unconditional grant (Biogen Inc., Massachusetts); his research is or was supported by the Swiss Multiple Sclerosis Society and the Swiss National Science Foundation (SPUM 33CM30_124115 and 33CM30_140338). M. Mallar Chakravarty reports no disclosures relevant to the manuscript. M. Descoteaux is the chief scientific officer at Imeka Solutions Inc. L. Kappos' institution (University Hospital Basel) has received research support and payments that were used exclusively for research support for Dr. Kappos' activities as principal investigator and member or chair of planning and steering committees or advisory boards in trials sponsored by Actelion, Addex, Almirall, Bayer HealthCare, Celgene, CLC Behring, Genentech, GeNeuro, Genzyme, Merck Serono, Mitsubishi Pharma, Novartis, Octapharma, Ono, Pfizer, Receptos, F. Hoffmann-La Roche, Sanofi-Aventis, Santhera, Siemens, Teva, UCB, and XenoPort; license fees for Neurostatus products; and research grants from the Swiss Multiple Sclerosis Society, the Swiss National Research Foundation, the European Union, and the Roche Research Foundation. The current (DKD Helios Klinik Wiesbaden) or previous (University Hospital Basel) institutions of Till Sprenger have received payments for speaking or consultation from Biogen Idec, Eli Lilly, Allergan, Actelion, ATI, Mitsubishi Pharma, Novartis, Genzyme, and Teva. Dr. Sprenger received research grants from the Swiss MS Society, Novartis Pharmaceuticals Switzerland, EFIC-Grünenthal grant, and Swiss National Science foundation. S. Magon has received research support from the Swiss MS Society, Swiss National Science Foundation, University of Basel, and “Stiftung zur Förderung der gastroenterologischen und allgemeinen klinischen Forschung sowieder medizinischen Bildauswertung,” University Hospital Basel. He also received travel support from Biogen and Genzyme. Go to Neurology.org/N for full disclosures.
References
- 1.Costello F. The afferent visual pathway: designing a structural-functional paradigm of multiple sclerosis. ISRN Neurol 2013;2013:134858. [DOI] [PMC free article] [PubMed] [Google Scholar]
- 2.Gabilondo I, Martínez-Lapiscina EH, Martínez-Heras E, et al. Trans-synaptic axonal degeneration in the visual pathway in multiple sclerosis. Ann Neurol 2014;75:98–107. [DOI] [PubMed] [Google Scholar]
- 3.Balk LJ, Steenwijk MD, Tewarie P, et al. Bidirectional trans-synaptic axonal degeneration in the visual pathway in multiple sclerosis. J Neurol Neurosurg Psychiatry 2015;86:419–424. [DOI] [PubMed] [Google Scholar]
- 4.Rocca MA, Mesaros S, Preziosa P, et al. Wallerian and trans-synaptic degeneration contribute to optic radiation damage in multiple sclerosis: a diffusion tensor MRI study. Mult Scler 2013;19:1610–1617. [DOI] [PubMed] [Google Scholar]
- 5.Pfueller CF, Brandt AU, Schubert F, et al. Metabolic changes in the visual cortex are linked to retinal nerve fiber layer thinning in multiple sclerosis. PLoS One 2011;6:e18019. [DOI] [PMC free article] [PubMed] [Google Scholar]
- 6.Klistorner A, Sriram P, Vootakuru N, et al. Axonal loss of retinal neurons in multiple sclerosis associated with optic radiation lesions. Neurology 2014;82:2165–2172. [DOI] [PMC free article] [PubMed] [Google Scholar]
- 7.Sinnecker T, Oberwahrenbrock T, Metz I, et al. Optic radiation damage in multiple sclerosis is associated with visual dysfunction and retinal thinning: an ultrahigh-field MR pilot study. Eur Radiol 2015;25:122–131. [DOI] [PubMed] [Google Scholar]
- 8.Klistorner A, Graham EC, Yiannikas C, et al. Progression of retinal ganglion cell loss in multiple sclerosis is associated with new lesions in the optic radiations. Eur J Neurol 2017;24:1392–1398. [DOI] [PubMed] [Google Scholar]
- 9.Chakravarty MM, Steadman P, van Eede MC, et al. Performing label-fusion-based segmentation using multiple automatically generated templates. Hum Brain Mapp 2013;34:2635–2654. [DOI] [PMC free article] [PubMed] [Google Scholar]
- 10.Polman CH, Reingold SC, Banwell B, et al. Diagnostic criteria for multiple sclerosis: 2010 revisions to the McDonald criteria. Ann Neurol 2011;69:292–302. [DOI] [PMC free article] [PubMed] [Google Scholar]
- 11.Petzold A, Plant GT. Diagnosis and classification of autoimmune optic neuropathy. Autoimmun Rev 2014;13:539–545. [DOI] [PubMed] [Google Scholar]
- 12.Chakravarty MM, Bertrand G, Hodge CP, Sadikot AF, Collins DL. The creation of a brain atlas for image guided neurosurgery using serial histological data. Neuroimage 2006;30:359–376. [DOI] [PubMed] [Google Scholar]
- 13.Hirai T, Jones EG. A new parcellation of the human thalamus on the basis of histochemical staining. Brain Res Brain Res Rev 1989;14:1–34. [DOI] [PubMed] [Google Scholar]
- 14.Chakravarty MM, Sadikot AF, Germann J, Hellier P, Bertrand G, Collins DL. Comparison of piece-wise linear, linear, and nonlinear atlas-to-patient warping techniques: analysis of the labeling of subcortical nuclei for functional neurosurgical applications. Hum Brain Mapp 2009;30:3574–3595. [DOI] [PMC free article] [PubMed] [Google Scholar]
- 15.Magon S, Chakravarty MM, Amann M, et al. Label-fusion-segmentation and deformation-based shape analysis of deep gray matter in multiple sclerosis: the impact of thalamic subnuclei on disability. Hum Brain Mapp 2014;35:4193–4203. [DOI] [PMC free article] [PubMed] [Google Scholar]
- 16.Pipitone J, Park MTM, Winterburn J, et al. Multi-atlas segmentation of the whole hippocampus and subfields using multiple automatically generated templates. NeuroImage 2014;101:494–512. [DOI] [PubMed] [Google Scholar]
- 17.Schippling S, Balk LJ, Costello F, et al. Quality control for retinal OCT in multiple sclerosis: validation of the OSCAR-IB criteria. Mult Scler 2015;21:163–170. [DOI] [PubMed] [Google Scholar]
- 18.Cruz-Herranz A, Balk LJ, Oberwahrenbrock T, et al. The APOSTEL recommendations for reporting quantitative optical coherence tomography studies. Neurology 2016;86:2303–2309. [DOI] [PMC free article] [PubMed] [Google Scholar]
- 19.Burkholder BM, Osborne B, Loguidice MJ, et al. Macular volume determined by optical coherence tomography as a measure of neuronal loss in multiple sclerosis. Arch Neurol 2009;66:1366–1372. [DOI] [PubMed] [Google Scholar]
- 20.Garyfallidis E, Côté M-A, Rheault F, et al. Recognition of white matter bundles using local and global streamline-based registration and clustering. Neuroimage 2018;170:283–295. [DOI] [PubMed] [Google Scholar]
- 21.Cousineau M, Jodoin PM, Morency FC, et al. A test-retest study on Parkinson's PPMI dataset yields statistically significant white matter fascicles. Neuroimage Clin 2017;16:222–233. [DOI] [PMC free article] [PubMed] [Google Scholar]
- 22.Rheault F, Houde JC, Goyette N, Morency FC, Descoteaux M. MI-Brain, a software to handle tractograms and perform interactive virtual dissection. Proceeding Break Barriers Diffus MRI; Lisbon, Portugal; 2016.
- 23.Magon S, Gaetano L, Chakravarty MM, et al. White matter lesion filling improves the accuracy of cortical thickness measurements in multiple sclerosis patients: a longitudinal study. BMC Neurosci 2014;15:106. [DOI] [PMC free article] [PubMed] [Google Scholar]
- 24.Smith SM, Zhang Y, Jenkinson M, et al. Accurate, robust, and automated longitudinal and cross-sectional brain change analysis. Neuroimage 2002;17:479–489. [DOI] [PubMed] [Google Scholar]
- 25.Balcer LJ, Baier ML, Cohen JA, et al. Contrast letter acuity as a visual component for the multiple sclerosis functional composite. Neurology 2003;61:1367–1373. [DOI] [PubMed] [Google Scholar]
- 26.Martínez-Lapiscina EH, Ortiz-Pérez S, Fraga-Pumar E, et al. Colour vision impairment is associated with disease severity in multiple sclerosis. Mult Scler 2014;20:1207–1216. [DOI] [PubMed] [Google Scholar]
- 27.Keifer OP, Gutman DA, Hecht EE, Keilholz SD, Ressler KJ. A comparative analysis of mouse and human medial geniculate nucleus connectivity: a DTI and anterograde tracing study. Neuroimage 2015;105:53–66. [DOI] [PMC free article] [PubMed] [Google Scholar]
- 28.Tur C, Goodkin O, Altmann DR, et al. Longitudinal evidence for anterograde trans-synaptic degeneration after optic neuritis. Brain J Neurol 2016;139:816–828. [DOI] [PMC free article] [PubMed] [Google Scholar]
- 29.Puthenparampil M, Federle L, Poggiali D, et al. Trans-synaptic degeneration in the optic pathway: a study in clinically isolated syndrome and early relapsing-remitting multiple sclerosis with or without optic neuritis. PLoS One 2017;12:e0183957. [DOI] [PMC free article] [PubMed] [Google Scholar]
- 30.Zivadinov R, Bergsland N, Cappellani R, et al. Retinal nerve fiber layer thickness and thalamus pathology in multiple sclerosis patients. Eur J Neurol 2014;21:1137–e61. [DOI] [PubMed] [Google Scholar]
- 31.Zivadinov R, Bergsland N, Dolezal O, et al. Evolution of cortical and thalamus atrophy and disability progression in early relapsing-remitting MS during 5 years. AJNR Am J Neuroradiol 2013;34:1931–1939. [DOI] [PMC free article] [PubMed] [Google Scholar]
- 32.Gordon-Lipkin E, Chodkowski B, Reich DS, et al. Retinal nerve fiber layer is associated with brain atrophy in multiple sclerosis. Neurology 2007;69:1603–1609. [DOI] [PubMed] [Google Scholar]
- 33.Martinez-Lapiscina EH, Arnow S, Wilson JA, et al. Retinal thickness measured with optical coherence tomography and risk of disability worsening in multiple sclerosis: a cohort study. Lancet Neurol 2016;15:574–584. [DOI] [PubMed] [Google Scholar]
- 34.Dai H, Mu KT, Qi JP, et al. Assessment of lateral geniculate nucleus atrophy with 3T MR imaging and correlation with clinical stage of glaucoma. AJNR Am J Neuroradiol 2011;32:1347–1353. [DOI] [PMC free article] [PubMed] [Google Scholar]
- 35.Chen Z, Wang J, Lin F, Dai H, Mu K, Zhang H. Correlation between lateral geniculate nucleus atrophy and damage to the optic disc in glaucoma. J Neuroradiol J Neuroradiol 2013;40:281–287. [DOI] [PubMed] [Google Scholar]
- 36.Furlanetto RL, Teixeira SH, Gracitelli CPB, et al. Structural and functional analyses of the optic nerve and lateral geniculate nucleus in glaucoma. PLoS One 2018;13:e0194038. [DOI] [PMC free article] [PubMed] [Google Scholar]
- 37.Tian D-C, Su L, Fan M, et al. Bidirectional degeneration in the visual pathway in neuromyelitis optica spectrum disorder (NMOSD). Mult Scler 2018;24:1585–1593. [DOI] [PubMed] [Google Scholar]
- 38.Chakravarty MM, Sadikot AF, Germann J, Bertrand G, Collins DL. Towards a validation of atlas warping techniques. Med Image Anal 2008;12:713–726. [DOI] [PubMed] [Google Scholar]
- 39.Chakravarty MM, Rosa-Neto P, Broadbent S, Evans AC, Collins DL. Robust S1, S2, and thalamic activations in individual subjects with vibrotactile stimulation at 1.5 and 3.0 T. Hum Brain Mapp 2009;30:1328–1337. [DOI] [PMC free article] [PubMed] [Google Scholar]
- 40.Magon S, May A, Stankewitz A, et al. Morphological abnormalities of thalamic subnuclei in migraine: a multicenter MRI study at 3 Tesla. J Neurosci 2015;35:13800–13806. [DOI] [PMC free article] [PubMed] [Google Scholar]
- 41.Evangelou N, Konz D, Esiri MM, Smith S, Palace J, Matthews PM. Size-selective neuronal changes in the anterior optic pathways suggest a differential susceptibility to injury in multiple sclerosis. Brain J Neurol 2001;124:1813–1820. [DOI] [PubMed] [Google Scholar]
- 42.Costello F, Coupland S, Hodge W, et al. Quantifying axonal loss after optic neuritis with optical coherence tomography. Ann Neurol 2006;59:963–969. [DOI] [PubMed] [Google Scholar]
- 43.Sepulcre J, Goñi J, Masdeu JC, et al. Contribution of white matter lesions to gray matter atrophy in multiple sclerosis: evidence from voxel-based analysis of T1 lesions in the visual pathway. Arch Neurol 2009;66:173–179. [DOI] [PubMed] [Google Scholar]
- 44.Eidelberg D, Galaburda AM. Symmetry and asymmetry in the human posterior thalamus: I: cytoarchitectonic analysis in normal persons. Arch Neurol 1982;39:325–332. [DOI] [PubMed] [Google Scholar]
- 45.Lampert EJ, Andorra M, Torres-Torres R, et al. Color vision impairment in multiple sclerosis points to retinal ganglion cell damage. J Neurol 2015;262:2491–2497. [DOI] [PubMed] [Google Scholar]
- 46.Walter SD, Ishikawa H, Galetta KM, et al. Ganglion cell loss in relation to visual disability in multiple sclerosis. Ophthalmology 2012;119:1250–1257. [DOI] [PMC free article] [PubMed] [Google Scholar]
- 47.Petzold A, de Boer JF, Schippling S, et al. Optical coherence tomography in multiple sclerosis: a systematic review and meta-analysis. Lancet Neurol 2010;9:921–932. [DOI] [PubMed] [Google Scholar]
- 48.Reich DS, Smith SA, Gordon-Lipkin EM, et al. Damage to the optic radiation in multiple sclerosis is associated with retinal injury and visual disability. Arch Neurol 2009;66:998–1006. [DOI] [PMC free article] [PubMed] [Google Scholar]
- 49.Graham SL, Klistorner A. Afferent visual pathways in multiple sclerosis: a review. Clin Exp Ophthalmol 2017;45:62–72. [DOI] [PubMed] [Google Scholar]
- 50.Costello F, Hodge W, Pan YI, Freedman M, DeMeulemeester C. Differences in retinal nerve fiber layer atrophy between multiple sclerosis subtypes. J Neurol Sci 2009;281:74–79. [DOI] [PubMed] [Google Scholar]
Associated Data
This section collects any data citations, data availability statements, or supplementary materials included in this article.
Data Availability Statement
All anonymized data not published within this article will be shared by request from any qualified investigator.