Abstract
Objective
To determine whether free water (FW) content, initially developed to correct metrics derived from diffusion tensor imaging and recently found to be strongly associated with vascular risk factors, may constitute a sensitive biomarker of white matter (WM) microstructural differences associated with cognitive performance but remains unknown.
Methods
Five hundred thirty-six cognitively diverse individuals, aged 77 ± 8 years, received yearly comprehensive clinical evaluations and a baseline MRI examination of whom 224 underwent follow-up MRI. WM microstructural measures, including FW, fractional anisotropy, and mean diffusivity corrected for FW and WM hyperintensity burden were computed within WM voxels of each individual. Baseline and change in MRI metrics were then used as independent variables to explain baseline and change in episodic memory (EM), executive function (EF), and Clinical Dementia Rating (CDR) scores using linear, logistic, and Cox proportional-hazards regressions.
Results
Higher baseline FW and WM hyperintensity were associated with lower baseline EM and EF, higher baseline CDR, accelerated EF and EM decline, and higher probability to transition to a more severe CDR stage (p values <0.01). Annual change in FW was also found to be associated with concomitant change in cognitive and functional performance (p values <0.01).
Conclusions
This study finds cross-sectional and longitudinal associations between FW content and trajectory of cognitive and functional performance in a large sample of cognitively diverse individuals. It supports the need to investigate the pathophysiologic process that manifests increased FW, potentially leading to more severe WM territory injury and promoting cognitive and functional decline.
Cerebrovascular disease (CeVD), along with neurodegeneration and mixed pathologies, are predominant contributors to cognitive decline and risk of dementia.1,2 Nonetheless, while major efforts have been deployed to characterize the cascade of cerebral events associated with neurodegeneration,3 pathophysiologic mechanisms associated with vascular disease and their chronology have received less attention.
Recent diffusion tensor imaging (DTI) studies suggest that DTI-derived fractional anisotropy (FA) and mean diffusivity (MD) constitute biomarkers of subtle white matter (WM) injury in association with vascular risk factors,4 even among younger adults, decades before white matter hyperintensity (WMH) appear or cognition declines.5,6 These DTI-derived metrics, however, are likely contaminated by extracellular water, and a method to correct DTI data for extracellular water contamination has been proposed.7 The “extracted” extracellular water content, which reflects the amount of water molecules that are relatively unrestricted by their local microenvironment referred to as free water (FW), are not only shown to improve specificity of DTI-derived metrics8,9 but also to significantly reduce their test-retest reproducibility error.10
Of interest, FW has received recent attention as a measure of interest itself for its sensitivity to reflect cerebral injury in association with cognition11,12 but also with vascular risk factors in relatively healthy adult individuals.13 Given this evidence, we examined the potential of FW to predict change in cognitive and functional performance that is not fully explained by neurodegeneration as measured by hippocampal atrophy in a community-based population.
Methods
Study population
Individuals included in this study are a subgroup of the University of California, Davis, Alzheimer's Disease Center cohort. Approximately 74% of the participants were recruited through community-based recruitment protocols designed to enhance racial and ethnic diversity and the spectrum of cognitive dysfunction with an emphasis on normal cognition and mild cognitive impairment (MCI).14 The other 26% of the sample initially sought a clinical evaluation at the University of California, Davis, Alzheimer's Disease Center. Exclusion criteria included unstable major medical illness, major primary psychiatric disorder, and substance abuse or dependence in the last 5 years.
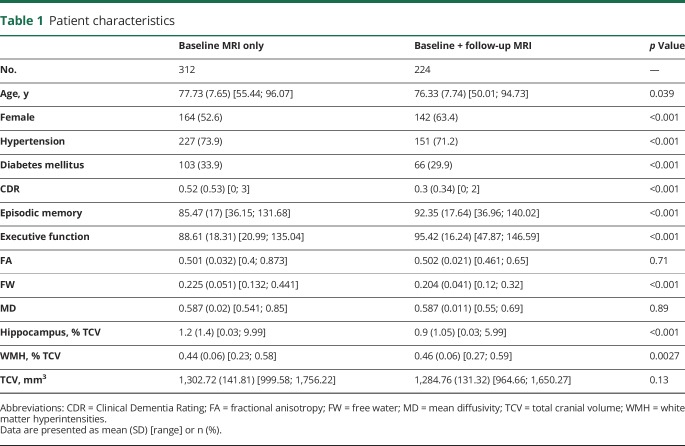
The baseline MRI sample included 536 individuals who received a standardized MRI scan of the brain including a DTI acquisition (table 1) close in time to initial clinical examination. Yearly clinical and cognitive assessments were completed for nearly all subjects. A subsample of 224 individuals from the baseline sample also underwent one or more repeated MRI examinations.
Table 1.
Patient characteristics
Standard protocol approvals, registrations, and patient consents
The institutional review boards at all participating institutions approved this study, and individuals or their legal representatives gave written informed consent.
Cognitive and functional outcomes
All participants received a comprehensive clinical evaluation and neuropsychological testing from a standardized test battery on a yearly basis. The primary cognitive outcome measures in this study were executive function (EF) and episodic memory (EM) from the Spanish and English Neuropsychological Assessment Scales designed specifically to measure cognition across a broad range of cognitive abilities and language preference.15 Mixed-model random-effects regression analyses were used to model rate of change of the cognitive outcome measures.16
The second outcome included the Clinical Dementia Rating (CDR) scale. The CDR characterizes cognitive and functional performance applicable to Alzheimer disease (AD) and related dementias and is one of the most widely used measures for determining dementia severity.17 Individuals were divided into 3 groups according to their baseline CDR stage: 199 persons with CDR = 0 (normal elderly without dementia), 259 with CDR = 0.5 (questionable dementia or mild cognitive impairment), and 78 with CDR ≥1 (mild to severe dementia) and into 2 groups according to their CDR trajectory dissociating those who transitioned between baseline and any of the follow-up examinations to a more severe CDR state from those who did not. Time of event was defined as the time difference between the baseline examination date and either the examination date at which an increase of CDR was first recorded, or, if no CDR increase occurred, the most recent examination date available for the individual.
Image processing
All brain imaging was performed at the University of California, Davis, Imaging Research Center on a 1.5T GE Signa Horizon LX-Echospeed system (GE Healthcare, Waukesha, WI). Three sequences were used: a 3-dimensional T1-weighted coronal spoiled gradient-recalled echo acquisition (inversion recovery–prepped, echo time [TE] = 1.9 milliseconds [ms], flip angle = 20°, field of view [FOV] = 24 cm, matrix = 256 × 256, 124 contiguous slices, slice thickness = 1.6 mm), an axial-oblique 2-dimensional fluid-attenuated inversion recovery (FLAIR) fast spin echo sequence (TE = 144 ms, repetition time = 11,000 ms, TI = 2,250 ms, flip angle = 90°, FOV = 22 cm, matrix = 256 × 192, contiguous slices, slice thickness = 3 mm), and DTI using the diffusion-weighted echo-planar sequence (TE = 94 ms, repetition time = 8,000 ms, flip angle = 90°, FOV = 22 cm, matrix = 128 × 128, slice thickness = 5 mm). Diffusion-weighted images were generated using gradients applied in 6 directions, repeated 4 times, given by (Gx,Gy,Gz) = (1,1,0), (1,−1,0), (1,0,1), (1,0,−1), (0,1,1) (0,1,−1) with total gradient diffusion sensitivity measured at b = 1,000 s/mm2.
We used DTI measures of FW content, of FW-corrected fractional anisotropy (FACOR), and FW-corrected mean diffusivity (MDCOR). Briefly, DTIs were first preprocessed using FMRIB's Software Library (FSL) software tools,18 including correction for eddy current–induced distortions and participant head movements. Individual uncorrected FA maps were coregistered to the FSL FA DTI template using linear and nonlinear transformations. Resulting transformation parameters were inversed and applied to the FSL WM labels atlas to provide a mask of WM region in the native DTI space of the individual. For each individual, overall measures of mean FW, FACOR, and MDCOR were computed by superimposing individual WM masks onto the respective individual DTI-derived maps and averaging values within these WM voxels.
In addition, we included hippocampal volume as a measure of neurodegeneration. Segmentation of WMH, hippocampus, and total cranial volume (TCV) were performed from FLAIR designed to enhance WMH segmentation19 and T1-weighted images by automated procedures previously described and which demonstrates high interrater reliability.14,20,21 For each individual, overall WMH burden and hippocampus volume were computed and normalized by TCV to account for differences in head volume. Resulting WMH burden was also log-transformed to normalize population variance. WMH maps were finally coregistered onto the native DTI space of the individual and subtracted from the WM mask to generate a mask of normal-appearing WM (NAWM).
Baseline FW, FACOR, MDCOR, and WMH were defined as the mean FW, FACOR, and MDCOR and WMH burden available at the first MRI date. Individual annual change in FW, FACOR, MDCOR, and WMH was computed using mixed-model random-effects regressions.
Statistical analysis
The goal of this study was to explore the sensitivity of FW, FACOR, and MDCOR and WMH burden to predict variability in cognitive and functional performance, as well as to predict longitudinal trajectory of these measures. We addressed this objective by investigating associations described below. All models were adjusted for baseline age, sex, education level, hypertension, diabetes mellitus status, and TCV. Hippocampus volume was also used as an additional covariate to control for variability in cognitive and functional performance associated with neurodegeneration.22 Continuous measures were standardized to facilitate regression coefficient comparisons.
Baseline associations between MRI measures and cognitive and functional performances
Model 1 used linear regression for continuous measures (EM and EF) and multinomial logistic regression for categorical variables (i.e., CDR stage) using baseline scores of EM and EF and CDR stage as dependent variables and, in separate models, each of baseline mean FW, FACOR, MDCOR, and WMH burden as independent variables.
Baseline MRI measures as predictor of change in cognitive and functional performances
Model 2 used linear regression models for continuous measures (EM and EF) and Cox proportional-hazards regression models for categorical variables (i.e., CDR increase status). Annual change in EM and EF as well as time to event of CDR increase constituted the dependent variables. Each of the 4 MRI metrics was used in a separate model as the independent variable.
Concomitant change in MRI measures and cognitive and functional performances
Model 3 consisted of model 2's design but with the addition of annual change in each MRI metric as an independent variable, along with the corresponding baseline MRI metric.
Replication in individuals free of dementia
To ensure that associations between MRI measures and EM and EFs were not overestimated by inclusion of individuals with dementia in the analysis, we replicated models 1, 2, and 3 including only individuals with a baseline CDR ≤0.5.
Mediation analyses
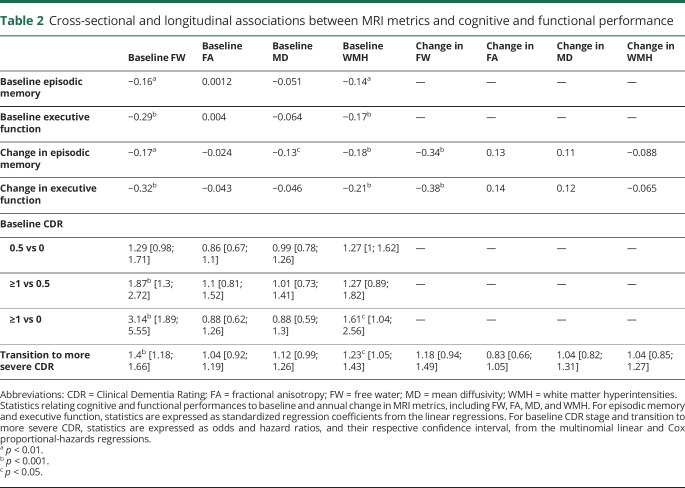
Because FW appeared to be a more sensitive measure of cognitive and functional performance than WMH (table 2), we conducted mediation analyses23 to investigate whether the independent associations between measures of cognitive and functional performance and WMH were still significant after including FW as a mediator. Finally, we also investigated whether the associations between measures of cognitive and functional performance with FW persisted when mean FW was computed within NAWM voxels only.
Table 2.
Cross-sectional and longitudinal associations between MRI metrics and cognitive and functional performance
Data availability
The data from this Alzheimer's Disease Center, University of California, Davis, used in the present study are made publicly available through request via the study’s website (ucdmc.ucdavis.edu/alzheimers/).
Results
Demographics
As compared with individuals who underwent at least 2 MRI examinations, individuals who underwent a baseline MRI examination only were older, had higher baseline CDR, lower EM and EF scores, larger WMH burden, larger hippocampus, and higher mean FW (table 1). The proportion of males and of individuals with hypertension and diabetes was lower in the longitudinal sample.
Baseline associations between MRI measures and cognitive and functional performances
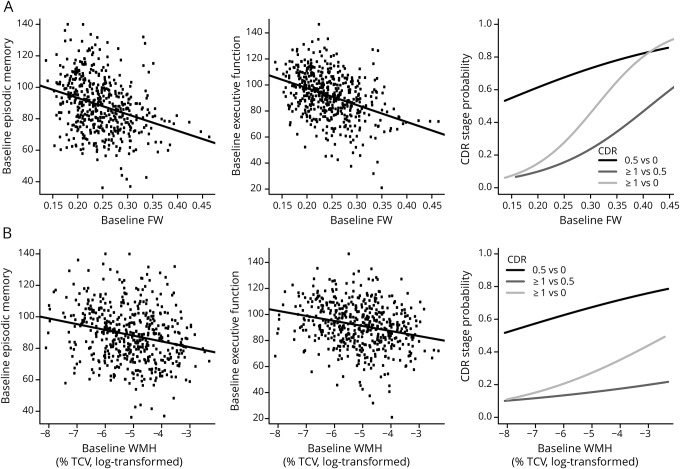
Larger baseline FW and WMH were found to be associated with worse concomitant baseline EM (β = −0.16, p = 0.0014, and β = −0.14, p = 0.0012, respectively; table 2) and EF (β = −0.29, p < 0.001, and β = −0.17, p < 0.001, respectively).
Multinomial logistic regressions revealed a strong effect of baseline FW and a weaker effect of WMH on baseline CDR severity (χ = 20.22, p < 0.001, and χ = 6.98, p = 0.030, respectively). CDR stage-by-stage comparisons indicated that an increase in 1 SD of baseline FW almost doubled the risk of having a CDR of ≥1 rather than 0.5 (odds ratio [OR] = 1.87, p < 0.001, 95% CI 1.30–2.72; table 2) and tripled the risk of having a CDR of ≥1 rather than 0 (OR = 3.14, p < 0.001, 95% CI 1.89–5.55). An increase in 1 SD baseline WMH was found to increase by 61% the risk of having a CDR of ≥1 rather than 0 (OR = 1.61, p = 0.035, 95% CI 1.04–2.56). Figure 1 illustrates these associations.
Figure 1. Association between baseline MRI-derived metrics and cognitive and functional performance.
Association between baseline mean (A) FW and (B) WMH burden and baseline episodic memory, executive function, and CDR scale. CDR = Clinical Dementia Rating; FW = free water; TCV = total cranial volume; WMH = white matter hyperintensity.
Baseline MRI measures as predictor of change in cognitive and functional performance
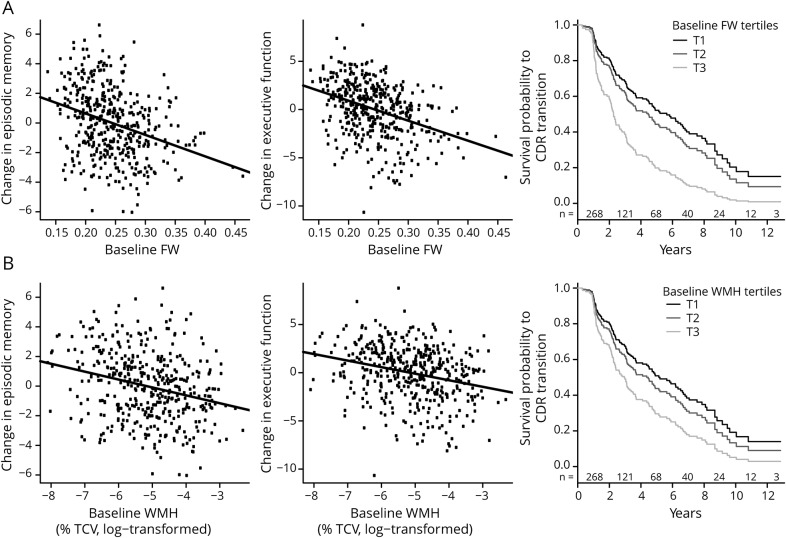
Larger baseline FW and WMH burden were found to predict accelerated decline in EM (β = −0.17, p = 0.0012, and β = −0.18, p < 0.001, respectively; table 2) and EF (β = −0.33, p < 0.001, and β = −0.21, p < 0.001, respectively). Larger baseline MDCOR was found to be associated with accelerated decline in EM (β = −0.13, p = 0.035).
Cox proportional-hazards regression revealed that larger baseline FW and WMH burden increased the risk of shifting to a more severe CDR state over time (hazard ratio = 1.40, p < 0.001, 95% CI 1.18–1.66, and hazard ratio = 1.23, p = 0.011, 95% CI 1.05–1.43; table 2). Figure 2 illustrates the associations between baseline FW and WMH burden and trajectory of cognitive and functional performance.
Figure 2. Association between baseline MRI-derived metrics and change in cognitive and functional performance.
Association between baseline mean (A) FW and (B) WMH burden and annual changes in episodic memory and executive function and survival function to transition in the CDR stage. Survival probability to CDR increase is displayed for different levels of baseline FW and WMH using tertiles. Because survival time is a continuous measure, the number of individuals at risk is reported on a 2-year interval basis and indicated, for each corresponding interval, above the x-axis. CDR = Clinical Dementia Rating; FW = free water; TCV = total cranial volume; WMH = white matter hyperintensity.
Concomitant change in MRI measures and cognitive and functional performance
Among the 4 MRI metrics, only change in FW was related to change in cognitive performance (table 2) with a larger increase in FW being associated with concomitant accelerated decline in EM and EF (β = −0.34, p < 0.001, and β = −0.38, p < 0.001, respectively).
Among the 4 MRI metrics, none was found to be related to an increased risk of shift to a more severe CDR state over time (table 2).
Effect of hippocampal volume on cognition
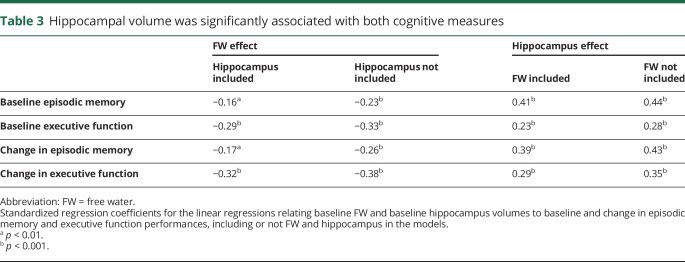
As described in the methods section, all analyses were performed adjusting for age, sex, education, diabetes, hypertension, TCV, and hippocampal volume to account for effect of degeneration on cognitive and functional measures. Although the present study did not aim to investigate these specific associations, we performed preliminary models that did not include WM microstructure measures. Hippocampal volume was significantly associated with both cognitive measures (table 3). Including FW in the models with hippocampal measures neither altered the significance nor the regression coefficient for hippocampus substantially. For example, the relationship between hippocampal volume and baseline EM was β = 0.44, p < 0.001, with only hippocampus in the model and β = 0.41, p < 0.001, with the addition of FW. Similarly, omitting hippocampal volume did not significantly change association strength between FW and cognitive outcomes. These results suggest that these 2 variables are measuring relatively independent processes.
Table 3.
Hippocampal volume was significantly associated with both cognitive measures
Additional analyses
Excluding individuals with advanced stage of cognitive impairment did not significantly alter associations between MRI metrics and cognitive performance described above (data not shown).
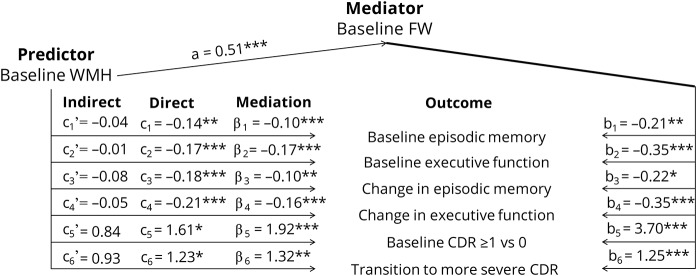
Figure 3 summarizes results of the mediation analyses investigating whether significant direct effects of baseline WMH on cognition and CDR in models 1 and 2 may be mediated by FW. After including FW as a mediator, effects of WMH were no longer significant. Mediation effects, as well as mediator's direct effects were found to be strongly significant (p values <0.01). These results suggest that effect of WMH burden on cognitive and functional performance and on their rate of change, as shown in models 1 and 2, are fully mediated by FW content. Reversed mediation using baseline FW as the predictor and WMH as the mediator did not reveal mediation effect of baseline WMH on associations between baseline FW and cognitive and functional output (data not shown).
Figure 3. Mediation analyses.
For each model, i, ci, and ci' indicate the direct and indirect effects of the predictor (i.e., baseline WMH), βi the mediation effect by the mediator (i.e., baseline FW), bi the effect of the mediator, and ai the effect of the predictor on the mediator. Outcomes included baseline episodic memory and executive functions (i = 1 and i = 2, respectively), change in episodic memory and executive functions (i = 3 and i = 4, respectively), baseline risk of having a CDR of ≥1 rather than 0 (i = 5), and survival time linked to an increase in CDR (i = 6). Coefficients for models 1 to 4, 5, and 6 represent standardized regression, odds and hazard ratio coefficients, respectively. *p < 0.05; **p < 0.01; ***p < 0.001. CDR = Clinical Dementia Rating; FW = free water; WMH = white matter hyperintensity.
Similarly, computing mean FW in NAWM voxels did not affect the associations reported above. Baseline FW remained significantly associated with EM and EF (β = −0.87, p = 0.37, and β = −0.21, p < 0.001, respectively). FW also remained significantly associated with accelerated decline in EM and EF (β = −0.13, p = 0.0046, and β = −0.23, p < 0.001, respectively), baseline CDR severity (χ = 16.23, p < 0.001), and increased risk of shifting to a more severe CDR state over time (OR = 1.2, p = 0.0089, 95% CI 1.05–1.38).
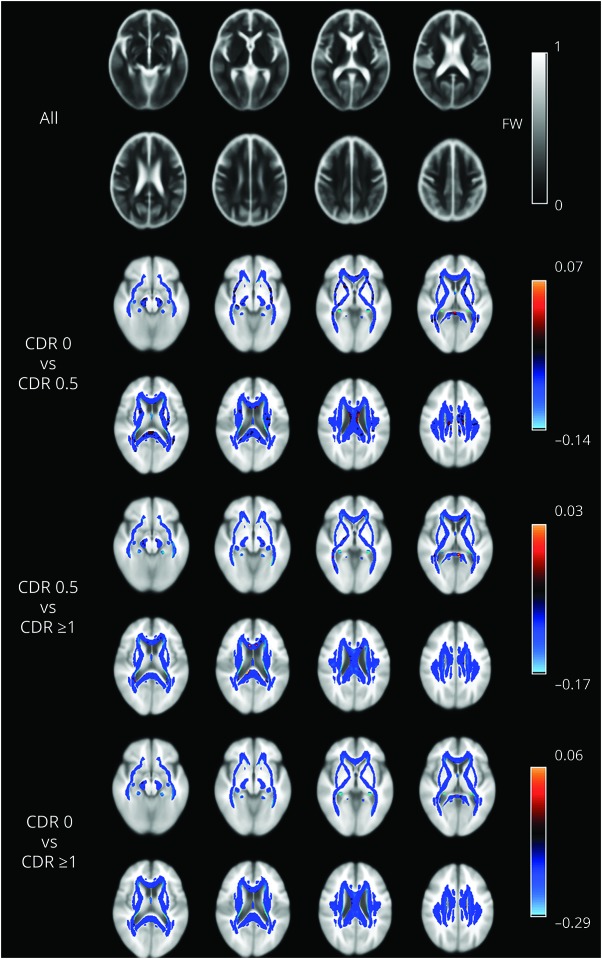
For illustration only, maps of mean FW computed across all individuals, as well as mean FW difference according to CDR stage, are shown in figure 4.
Figure 4. FW spatial distribution maps.
Average map of FW values across all individuals (gray scale) within white matter voxels and differences in FW values between CDR group stages (colored scale). CDR = Clinical Dementia Rating; FW = free water.
Discussion
The main finding of this large longitudinal DTI study is that, among the 4 MRI metrics of overall WM microstructure, including FACOR and MDCOR, FW and WMH, FW content in WM features as the strongest predictor of cognitive and functional trajectories among older individuals, even when accounting for the effect of hippocampal volume, a frequently used measure of neurodegeneration.22 A second important finding is that the effect of FW on cognitive and functional performance prevails over that of WMH, to the extent that FW measures fully mediate WMH associations with cognition. Third, WM FW and WMH appear to measure pathologic processes different from conventional measures of neurodegeneration (i.e., hippocampus). Finally, our analyses did not reveal associations between overall measures of FACOR and MDCOR, cognitive and functional performance. We discuss the significance of these findings below.
Increasing numbers of DTI studies have reported that correcting for extracellular water content improves sensitivity of conventional FA and MD and thus shows that correction for extracellular water content is a promising method to identify more subtle changes in WM microstructure.7,10 Of interest, however, the resulting extracted water content, referred to as FW, has only recently received attention as an independent measure of cerebral injury, with preliminary studies of individuals with Parkinson disease, schizophrenia, or genetic and sporadic small vessel disease.12,24,25 The underlying pathologic process by which extracellular water occurs, however, is unknown, and no study to date has explicitly investigated whether increased FW may result from processes linked to neurodegeneration, vascular disease, or both. Although extracellular water may originate from different physiologic mechanisms, CSF diffusion, perfusion effects (signal coming from plasma), atrophy (signal coming from CSF), edema, neuroinflammation, and microscopic degradation/cellular density, MRI and histologic studies support its interpretation as mainly age-dependent interstitial water fraction.26,27 Although this question did not constitute the objective of our study, previous findings from our laboratory support the hypothesis of vascular disease involvement in association with increased WM FW. For example, we recently showed that, among healthy adults, FW was strongly associated with perturbed hemodynamic function, as expressed by elevated blood pressure and increased arterial stiffness,13 which, in addition to advancing age, rank as the top-2 risk factors for vascular brain injury. This finding among a group of relatively young individuals (51 years of age on average) in whom cerebral atrophy and WMH likely have a less significant effect on WM microstructure led us to postulate a biomechanical model of brain injury wherein increasing arterial stiffness results in transmitted pressure waves to high-resistance cerebral vessels resulting in endothelial injury, subtle breakdown of the blood-brain barrier, transudation of FW that either introduces toxic serum cytokines or reduces the clearance of interstitial toxins that lead to breakdown of WM microstructure, eventually leading to WMH and increased risk of MCI and dementia.28 Further longitudinal studies are needed to test this hypothesis.
Our study also showed that baseline FW content and WMH burden were both associated with concomitant measures of cognition and function in this large sample of older individuals. Associations between WMH and cognitive performance have been widely reported in cognitively normal individuals,29,30 as well as in individuals with MCI or AD.31–34 Our results support the hypothesis that, in older individuals, larger baseline WMH burden is associated with worse cognitive and functional performance as well as accelerated decline in cognition and functional status. We did not find an association between the rate of change in WMH and cognitive and functional trajectory, confirming previous findings35 and contrasting with others,36 emphasizing the need to identify new biomarkers sensitive to early and subtle change in WM microstructure.
Of note, FW was found to fully mediate the effects of WMH, which feature as a common biomarker of vascular disease. The mediating effect of FW on WMH, while not biological proof, does suggest that the 2 measures may reflect similar physiologic processes. Again, further study is needed to confirm such a hypothesis.
In addition to various DTI measures, we included hippocampal volume as a covariate to account for neurodegeneration in all of the models.22 A deleterious effect of FW on cognition and function persisted, supporting our hypothesis that FW indicates a pathologic change in WM microstructure and suggesting an independent and additive role of FW as a mediator of cognitive ability.
The present study suggests that FW may constitute a new and promising candidate to quantify WM territory injury in association with cognitive and functional outcomes. Reports using the FW metric as a marker of WM territory injury to study AD and other dementias are rare. This cross-sectional study found that FW was associated with dementia severity in a sample of 115 individuals with mixed vascular and neurodegenerative dementia,11 including patients with AD, with AD + CeVD, and vascular dementia (VaD). Their findings indicated that patients with AD + CeVD and VaD had higher FW content than patients with AD, who in turn had higher FW than controls. In addition, among individuals with AD + CeVD, VaD, and AD, increased FW was also found to be associated with a more severe CDR stage and poorer executive functioning, visual construction, and visuomotor performance. These results indicate that FW measures, while generally differing from cognitively normal individuals, also may be capable of distinguishing vascular disease from neurodegenerative processes and they also reinforce the notion that extracellular water in the WM is a sensitive measure of pathophysiologic processes. Our study confirmed this hypothesis by extending these findings to cognitively normal individuals and those at very early stages of cognitive and functional impairment. Indeed, even in the subsample of 224 individuals with longitudinal MRI data, increased FW was associated with reduced performance in EM and EF, but also with more severe CDR. Our longitudinal analyses also highlight that measures of FW predict future cognitive decline. In addition to the clinical implication of these findings, our findings call for immediate efforts to determine factors that, besides hemodynamic alteration,13 promote extracellular water within WM territories among normal individuals.
Another important finding is that conventional DTI metrics corrected for extracellular water, including FACOR and MDCOR, did not appear as significant predictors of cognitive and functional performance. Previous studies reported associations between cognitive and functional performance with localized measures (i.e., at voxel- or ROI-based level) of FA or MD with mixed results.11,37–42 It should be noted that most studies used DTI metrics that were not corrected for extracellular water. A large, recent study including individuals with genetic and sporadic small vessel disease showed that (1) reductions and increases in conventional FA and MD, that is, FW-uncorrected FA and MD, were mostly driven by increased FW, (2) compared with FW, alterations in the tissue compartment, that is, FACOR and MDCOR, were relatively mild, and (3) among all imaging markers, FW showed the strongest association with clinical deficits.12 The objective of our study was not to investigate the legitimacy of FW-corrected over that of FW-uncorrected FA and MD, as the multisite longitudinal study described above provides strong evidence of the improved test-retest reproducibility of FACOR and MDCOR as compared to conventional FA and MD.11 We believe that rather than invalidating results from previous DTI studies, the concept of correcting for extracellular water offers a deeper understanding of the underlying pathologic process. It suggests that WM microstructure, including myelin membranes and sheaths of axons as expressed by FACOR and MDCOR, may be less damaged than initially hypothesized, and that the interstitial environment may actually be preferentially affected. Although not yet fully understood, increases in the interstitial fluid compartment are likely to be part of the cascade of events associated with vascular disease,13 leading to cognitive decline and dementia later in life. Furthermore, while WMH development is one of the last pathophysiologic manifestations of this cascade and is likely to reflect permanent damage,43–45 it is unknown whether increased FW content might be potentially modifiable.
The strengths of this study include the large cross-sectional and longitudinal samples of mostly community-based individuals, with quantitative and sensitive measurements of WM microstructure and cognitive and functional performance. However, there are limitations including our focus on global associations between cognitive and functional outcomes with overall MRI measures, sidelining potential localized associations, notably with FACOR or MDCOR, at the voxel-based level. Second, the design of the present study does not enable identification of the components within FW that may be implicated in the degenerative process leading to cognitive and functional decline. Studies with acquisition sequences dedicated to address this issue are needed. Finally, we reported findings using mean FW, FACOR, and MDCOR measures computed within voxels covering the entire WM mask, independently of the presence of WMH. Additional analyses were performed by computing these measures within voxels of the normal-appearing WM only, that is, after excluding regions of WMH, and the results did not differ from those reported in the present work (data not shown). Third, misregistration and failure to account for variable ventricle sizes may cause deviation of voxels within individual WM masks into CSF-filled regions, in which case the amount of CSF in the brain rather than changes in interstitial water may affect the results. Finally, we did not fully investigate the effect of neurodegeneration on cognitive and functional performance. We only used hippocampal volume to account for neurodegeneration effect and found it too had an important but independent effect on cognitive and functional performance, as widely reported in the literature.46 Although hippocampus volume and FW content were independent of one another in this study, additional studies are needed to better characterize the degree of interactions between these 2 measures.
This study found cross-sectional and longitudinal associations between cerebral FW content and trajectory of cognitive and functional performance, including EM, EF, and CDR scores in a large sample of cognitively diverse individuals. Our work supports the need for DTI studies to correct DTI metrics for extracellular content and investigate the pathophysiologic process that manifests through increased FW within the WM, potentially leading to more severe WM injury and possibly resulting in subsequent accelerated cognitive and functional decline.
Glossary
- AD
Alzheimer disease
- CDR
Clinical Dementia Rating
- CeVD
cerebrovascular disease
- EF
executive function
- EM
episodic memory
- FA
fractional anisotropy
- FACOR
corrected fractional anisotropy
- FLAIR
fluid-attenuated inversion recovery
- FOV
field of view
- FSL
FMRIB's Software Library
- FW
free water
- MCI
mild cognitive impairment
- MD
mean diffusivity
- MDCOR
corrected mean diffusivity
- NAWM
normal-appearing white matter
- OR
odds ratio
- TCV
total cranial volume
- TE
echo time
- VaD
vascular dementia
- WM
white matter
- WMH
white matter hyperintensity
Author contributions
P. Maillard drafted the manuscript, participated in study concept and design, analyzed and interpreted the data. E. Fletcher revised the manuscript, participated in study concept and design, analyzed and interpreted data. B. Singh analyzed the data. O. Martinez analyzed the data. D.K. Johnson participated in study concept and design. J.M. Olichney participated in study concept and design. S.T. Farias participated in study concept and design. C. DeCarli revised the manuscript, participated in study concept and design, analyzed and interpreted the data.
Study funding
Supported by grants P30 AG010129 and R01 AG047827.
Disclosure
The authors report no disclosures relevant to the manuscript. Go to Neurology.org/N for full disclosures.
References
- 1.Kapasi A, DeCarli C, Schneider JA. Impact of multiple pathologies on the threshold for clinically overt dementia. Acta Neuropathol 2017;134:171–186. [DOI] [PMC free article] [PubMed] [Google Scholar]
- 2.DeCarli C. Vascular factors in dementia: an overview. J Neurol Sci 2004;226:19–23. [DOI] [PubMed] [Google Scholar]
- 3.Jack CR Jr, Knopman DS, Jagust WJ, et al. Hypothetical model of dynamic biomarkers of the Alzheimer's pathological cascade. Lancet Neurol 2010;9:119–128. [DOI] [PMC free article] [PubMed] [Google Scholar]
- 4.Maillard P, Carmichael OT, Reed B, Mungas D, DeCarli C. Cooccurrence of vascular risk factors and late-life white-matter integrity changes. Neurobiol Aging 2015;36:1670–1677. [DOI] [PMC free article] [PubMed] [Google Scholar]
- 5.Weinstein G, Maillard P, Himali JJ, et al. Glucose indices are associated with cognitive and structural brain measures in young adults. Neurology 2015;84:2329–2337. [DOI] [PMC free article] [PubMed] [Google Scholar]
- 6.Maillard P, Seshadri S, Beiser A, et al. Effects of systolic blood pressure on white-matter integrity in young adults in the Framingham Heart Study: a cross-sectional study. Lancet Neurol 2012;11:1039–1047. [DOI] [PMC free article] [PubMed] [Google Scholar]
- 7.Pasternak O, Sochen N, Gur Y, Intrator N, Assaf Y. Free water elimination and mapping from diffusion MRI. Magn Reson Med 2009;62:717–730. [DOI] [PubMed] [Google Scholar]
- 8.Bergamino M, Pasternak O, Farmer M, Shenton ME, Hamilton JP. Applying a free-water correction to diffusion imaging data uncovers stress-related neural pathology in depression. Neuroimage Clin 2016;10:336–342. [DOI] [PMC free article] [PubMed] [Google Scholar]
- 9.Mandl RC, Pasternak O, Cahn W, et al. Comparing free water imaging and magnetization transfer measurements in schizophrenia. Schizophr Res 2015;161:126–132. [DOI] [PMC free article] [PubMed] [Google Scholar]
- 10.Albi A, Pasternak O, Minati L, et al. Free water elimination improves test-retest reproducibility of diffusion tensor imaging indices in the brain: a longitudinal multisite study of healthy elderly subjects. Hum Brain Mapp 2017;38:12–26. [DOI] [PMC free article] [PubMed] [Google Scholar]
- 11.Ji F, Pasternak O, Liu S, et al. Distinct white matter microstructural abnormalities and extracellular water increases relate to cognitive impairment in Alzheimer's disease with and without cerebrovascular disease. Alzheimers Res Ther 2017;9:63. [DOI] [PMC free article] [PubMed] [Google Scholar]
- 12.Duering M, Finsterwalder S, Baykara E, et al. Free water determines diffusion alterations and clinical status in cerebral small vessel disease. Alzheimers Dement 2018;14:764–774. [DOI] [PMC free article] [PubMed] [Google Scholar]
- 13.Maillard P, Mitchell GF, Himali JJ, et al. Aortic stiffness, increased white matter free water, and altered microstructural integrity: a continuum of injury. Stroke 2017;48:1567–1573. [DOI] [PMC free article] [PubMed] [Google Scholar]
- 14.Carmichael O, Mungas D, Beckett L, et al. MRI predictors of cognitive change in a diverse and carefully characterized elderly population. Neurobiol Aging 2012;33:83–95. [DOI] [PMC free article] [PubMed] [Google Scholar]
- 15.Mungas D, Reed BR, Marshall SC, González HM. Development of psychometrically matched English and Spanish language neuropsychological tests for older persons. Neuropsychology 2000;14:209–223. [DOI] [PubMed] [Google Scholar]
- 16.Early DR, Widaman KF, Harvey D, et al. Demographic predictors of cognitive change in ethnically diverse older persons. Psychol Aging 2013;28:633–645. [DOI] [PMC free article] [PubMed] [Google Scholar]
- 17.Hughes CP, Berg L, Danziger WL, Coben LA, Martin RL. A new clinical scale for the staging of dementia. Br J Psychiatry 1982;140:566–572. [DOI] [PubMed] [Google Scholar]
- 18.Jenkinson M, Beckmann CF, Behrens TE, Woolrich MW, Smith SM. FSL. Neuroimage 2012;62:782–790. [DOI] [PubMed] [Google Scholar]
- 19.Jack CR Jr, O'Brien PC, Rettman DW, et al. FLAIR histogram segmentation for measurement of leukoaraiosis volume. J Magn Reson Imaging 2001;14:668–676. [DOI] [PMC free article] [PubMed] [Google Scholar]
- 20.DeCarli C, Fletcher E, Ramey V, Harvey D, Jagust WJ. Anatomical mapping of white matter hyperintensities (WMH): exploring the relationships between periventricular WMH, deep WMH, and total WMH burden. Stroke 2005;36:50–55. [DOI] [PMC free article] [PubMed] [Google Scholar]
- 21.Fletcher E, Singh B, Harvey D, Carmichael O, DeCarli C. Adaptive image segmentation for robust measurement of longitudinal brain tissue change. Conf Proc IEEE Eng Med Biol Soc 2012;2012:5319–5322. [DOI] [PMC free article] [PubMed] [Google Scholar]
- 22.Wirth M, Villeneuve S, Haase CM, et al. Associations between Alzheimer disease biomarkers, neurodegeneration, and cognition in cognitively normal older people. JAMA Neurol 2013;70:1512–1519. [DOI] [PMC free article] [PubMed] [Google Scholar]
- 23.Imai K, Keele L, Tingley D. A general approach to causal mediation analysis. Psychol Methods 2010;15:309–334. [DOI] [PubMed] [Google Scholar]
- 24.Ofori E, Pasternak O, Planetta PJ, et al. Longitudinal changes in free-water within the substantia nigra of Parkinson's disease. Brain 2015;138:2322–2331. [DOI] [PMC free article] [PubMed] [Google Scholar]
- 25.Burciu RG, Ofori E, Shukla P, et al. Free-water and BOLD imaging changes in Parkinson's disease patients chronically treated with a MAO-B inhibitor. Hum Brain Mapp 2016;37:2894–2903. [DOI] [PMC free article] [PubMed] [Google Scholar]
- 26.Chad JA, Pasternak O, Salat DH, Chen JJ. Re-examining age-related differences in white matter microstructure with free-water corrected diffusion tensor imaging. Neurobiol Aging 2018;71:161–170. [DOI] [PMC free article] [PubMed] [Google Scholar]
- 27.Meier-Ruge W, Ulrich J, Brühlmann M, Meier E. Age-related white matter atrophy in the human brain. Ann NY Acad Sci 1992;673:260–269. [DOI] [PubMed] [Google Scholar]
- 28.Debette S, Beiser A, DeCarli C, et al. Association of MRI markers of vascular brain injury with incident stroke, mild cognitive impairment, dementia, and mortality: the Framingham Offspring Study. Stroke 2010;41:600–606. [DOI] [PMC free article] [PubMed] [Google Scholar]
- 29.Lockhart SN, Mayda AB, Roach AE, et al. Episodic memory function is associated with multiple measures of white matter integrity in cognitive aging. Front Hum Neurosci 2012;6:56. [DOI] [PMC free article] [PubMed] [Google Scholar]
- 30.Söderlund H, Nilsson LG, Berger K, et al. Cerebral changes on MRI and cognitive function: the CASCADE study. Neurobiol Aging 2006;27:16–23. [DOI] [PubMed] [Google Scholar]
- 31.Holz MR, Kochhann R, Ferreira P, Tarrasconi M, Chaves MLF, Fonseca RP. Cognitive performance in patients with mild cognitive impairment and Alzheimer's disease with white matter hyperintensities: an exploratory analysis. Dement Neuropsychol 2017;11:426–433. [DOI] [PMC free article] [PubMed] [Google Scholar]
- 32.Boyle PA, Yu L, Fleischman DA, et al. White matter hyperintensities, incident mild cognitive impairment, and cognitive decline in old age. Ann Clin Transl Neurol 2016;3:791–800. [DOI] [PMC free article] [PubMed] [Google Scholar]
- 33.Gunning-Dixon FM, Brickman AM, Cheng JC, Alexopoulos GS. Aging of cerebral white matter: a review of MRI findings. Int J Geriatr Psychiatry 2009;24:109–117. [DOI] [PMC free article] [PubMed] [Google Scholar]
- 34.Heo JH, Lee ST, Kon C, Park HJ, Shim JY, Kim M. White matter hyperintensities and cognitive dysfunction in Alzheimer disease. J Geriatr Psychiatry Neurol 2009;22:207–212. [DOI] [PubMed] [Google Scholar]
- 35.Burton EJ, McKeith IG, Burn DJ, Firbank MJ, O'Brien JT. Progression of white matter hyperintensities in Alzheimer disease, dementia with lewy bodies, and Parkinson disease dementia: a comparison with normal aging. Am J Geriatr Psychiatry 2006;14:842–849. [DOI] [PubMed] [Google Scholar]
- 36.Zeestraten EA, Lawrence AJ, Lambert C, et al. Change in multimodal MRI markers predicts dementia risk in cerebral small vessel disease. Neurology 2017;89:1869–1876. [DOI] [PMC free article] [PubMed] [Google Scholar]
- 37.Shim G, Choi KY, Kim D, et al. Predicting neurocognitive function with hippocampal volumes and DTI metrics in patients with Alzheimer's dementia and mild cognitive impairment. Brain Behav 2017;7:e00766. [DOI] [PMC free article] [PubMed] [Google Scholar]
- 38.Nowrangi MA, Okonkwo O, Lyketsos C, et al. Atlas-based diffusion tensor imaging correlates of executive function. J Alzheimers Dis 2015;44:585–598. [DOI] [PMC free article] [PubMed] [Google Scholar]
- 39.Nir TM, Jahanshad N, Villalon-Reina JE, et al. Effectiveness of regional DTI measures in distinguishing Alzheimer's disease, MCI, and normal aging. Neuroimage Clin 2013;3:180–195. [DOI] [PMC free article] [PubMed] [Google Scholar]
- 40.Hui ES, Russell Glenn G, Helpern JA, Jensen JH. Kurtosis analysis of neural diffusion organization. Neuroimage 2015;106:391–403. [DOI] [PMC free article] [PubMed] [Google Scholar]
- 41.Bosch B, Arenaza-Urquijo EM, Rami L, et al. Multiple DTI index analysis in normal aging, amnestic MCI and AD: relationship with neuropsychological performance. Neurobiol Aging 2012;33:61–74. [DOI] [PubMed] [Google Scholar]
- 42.Rabin JS, Perea RD, Buckley RF, et al. Global white matter diffusion characteristics predict longitudinal cognitive change independently of amyloid status in clinically normal older adults. Cereb Cortex 2019;29:1251–1262. [DOI] [PMC free article] [PubMed] [Google Scholar]
- 43.Fernando MS, Simpson JE, Matthews F, et al. White matter lesions in an unselected cohort of the elderly: molecular pathology suggests origin from chronic hypoperfusion injury. Stroke 2006;37:1391–1398. [DOI] [PubMed] [Google Scholar]
- 44.Maillard P, Carmichael O, Fletcher E, Reed B, Mungas D, DeCarli C. Coevolution of white matter hyperintensities and cognition in the elderly. Neurology 2012;79:442–448. [DOI] [PMC free article] [PubMed] [Google Scholar]
- 45.Maillard P, Crivello F, Dufouil C, Tzourio-Mazoyer N, Tzourio C, Mazoyer B. Longitudinal follow-up of individual white matter hyperintensities in a large cohort of elderly. Neuroradiology 2009;51:209–220. [DOI] [PubMed] [Google Scholar]
- 46.Wang Z. Characterizing early Alzheimer's disease and disease progression using hippocampal volume and arterial spin labeling perfusion MRI. J Alzheimers Dis 2014;42(suppl 4):S495–S502. [DOI] [PubMed] [Google Scholar]
Associated Data
This section collects any data citations, data availability statements, or supplementary materials included in this article.
Data Availability Statement
The data from this Alzheimer's Disease Center, University of California, Davis, used in the present study are made publicly available through request via the study’s website (ucdmc.ucdavis.edu/alzheimers/).


