

Abstract
Background
Management of severe acute malnutrition (SAM) in children comprises two potential phases: stabilisation and rehabilitation. During the initial stabilisation phase, children receive treatment for dehydration, electrolyte imbalances, intercurrent infections and other complications. In the rehabilitation phase (applicable to children presenting with uncomplicated SAM or those with complicated SAM after complications have been resolved), catch‐up growth is the main focus and the recommended energy and protein requirements are much higher. In‐hospital rehabilitation of children with SAM is not always desirable or practical ‐ especially in rural settings ‐ and home‐based care can offer a better solution. Ready‐to‐use therapeutic food (RUTF) is a widely used option for home‐based rehabilitation, but the findings of our previous review were inconclusive.
Objectives
To assess the effects of home‐based RUTF used during the rehabilitation phase of SAM in children aged between six months and five years on recovery, relapse, mortality and rate of weight gain.
Search methods
We searched the following databases in October 2018: CENTRAL, MEDLINE, Embase, six other databases and three trials registers. We ran separate searches for cost‐effectiveness studies, contacted researchers and healthcare professionals in the field, and checked bibliographies of included studies and relevant reviews.
Selection criteria
Randomised controlled trials (RCTs) and quasi‐RCTs, where children aged between six months and five years with SAM were, during the rehabilitation phase, treated at home with RUTF compared to an alternative dietary approach, or with different regimens and formulations of RUTF compared to each other. We assessed recovery, deterioration or relapse and mortality as primary outcomes; and rate of weight gain, time to recovery, anthropometrical changes, cognitive development and function, adverse outcomes and acceptability as secondary outcomes.
Data collection and analysis
We screened for eligible studies, extracted data and assessed risk of bias of those included, independently and in duplicate. Where data allowed, we performed a random‐effects meta‐analysis using Review Manager 5, and investigated substantial heterogeneity through subgroup and sensitivity analyses. For the main outcomes, we evaluated the quality of the evidence using GRADE, and presented results in a 'Summary of findings' table per comparison.
Main results
We included 15 eligible studies (n = 7976; effective sample size = 6630), four of which were cluster trials. Eight studies were conducted in Malawi, four in India, and one apiece in Kenya, Zambia, and Cambodia. Six studies received funding or donations from industry whereas eight did not, and one study did not report the funding source.
The overall risk of bias was high for six studies, unclear for three studies, and low for six studies. Among the 14 studies that contributed to meta‐analyses, none (n = 5), some (n = 5) or all (n = 4) children were stabilised in hospital prior to commencement of the study. One small study included only children known to be HIV‐infected, another study stratified the analysis for 'recovery' according to HIV status, while the remaining studies included HIV‐uninfected or untested children. Across all studies, the intervention lasted between 8 and 16 weeks. Only five studies followed up children postintervention (maximum of six months), and generally reported on a limited number of outcomes.
We found seven studies with 2261 children comparing home‐based RUTF meeting the World Health Organization (WHO) recommendations for nutritional composition (referred to in this review as standard RUTF) with an alternative dietary approach (effective sample size = 1964). RUTF probably improves recovery (risk ratio (RR) 1.33; 95% confidence interval (CI) 1.16 to 1.54; 6 studies, 1852 children; moderate‐quality evidence), and may increase the rate of weight gain slightly (mean difference (MD) 1.12 g/kg/day, 95% CI 0.27 to 1.96; 4 studies, 1450 children; low‐quality evidence), but we do not know the effects on relapse (RR 0.55, 95% CI 0.30 to 1.01; 4 studies, 1505 children; very low‐quality evidence) and mortality (RR 1.05, 95% CI 0.51 to 2.16; 4 studies, 1505 children; very low‐quality evidence).
Two quasi‐randomised cluster trials compared standard, home‐based RUTF meeting total daily nutritional requirements with a similar RUTF but given as a supplement to the usual diet (213 children; effective sample size = 210). Meta‐analysis showed that standard RUTF meeting total daily nutritional requirements may improve recovery (RR 1.41, 95% CI 1.19 to 1.68; low‐quality evidence) and reduce relapse (RR 0.11, 95% CI 0.01 to 0.85; low‐quality evidence), but the effects are unknown for mortality (RR 1.36, 95% CI 0.46 to 4.04; very low‐quality evidence) and rate of weight gain (MD 1.21 g/kg/day, 95% CI ‐ 0.74 to 3.16; very low‐quality evidence).
Eight studies randomised 5502 children (effective sample size = 4456) and compared standard home‐based RUTF with RUTFs of alternative formulations (e.g. using locally available ingredients, containing less or no milk powder, containing specific fatty acids, or with added pre‐ and probiotics). For recovery, it made little or no difference whether standard or alternative formulation RUTF was used (RR 1.03, 95% CI 0.99 to 1.08; 6 studies, 4188 children; high‐quality evidence). Standard RUTF decreases relapse (RR 0.84, 95% CI 0.72 to 0.98; 6 studies, 4188 children; high‐quality evidence). However, it probably makes little or no difference to mortality (RR 1.00, 95% CI 0.80 to 1.24; 7 studies, 4309 children; moderate‐quality evidence) and may make little or no difference to the rate of weight gain (MD 0.11 g/kg/day, 95% CI −0.32 to 0.54; 6 studies, 3807 children; low‐quality evidence) whether standard or alternative formulation RUTF is used.
Authors' conclusions
Compared to alternative dietary approaches, standard RUTF probably improves recovery and may increase rate of weight gain slightly, but the effects on relapse and mortality are unknown. Standard RUTF meeting total daily nutritional requirements may improve recovery and relapse compared to a similar RUTF given as a supplement to the usual diet, but the effects on mortality and rate of weight gain are not clear. When comparing RUTFs with different formulations, the current evidence does not favour a particular formulation, except for relapse, which is reduced with standard RUTF. Well‐designed, adequately powered, pragmatic RCTs with standardised outcome measures, stratified by HIV status, and that include diarrhoea as an outcome, are needed.
Plain language summary
Ready‐to‐use therapeutic food (RUTF) as home‐based treatment for severely malnourished children between six months and five years
Background
Malnourished children usually look very thin or wasted and they have a high risk of death and illness. Treating severely malnourished children in hospitals is not always desirable or practical in rural settings, and home‐based treatment may be better. Home‐based treatment can be food prepared by a caregiver (such as flour porridge or energy‐ and nutrient‐dense locally available foods), or ready‐to‐use therapeutic food (RUTF) provided by a clinic. RUTF is usually made according to a standard, energy‐rich composition defined by the World Health Organization (WHO). Typically, the ingredients for standard RUTF include milk powder, sugar, peanut butter, vegetable oil, vitamins and minerals; but ingredients vary depending on local availability, cost and acceptability. Benefits of RUTF include a long shelf life without refrigeration and they require no preparation. This is an update of our previous review, where definite conclusions about the effects of RUTF could not be drawn from the four studies that were available at that time.
Review question
We assessed standard RUTF compared to an alternative dietary approach (e.g. flour porridge or locally available foods) and examined whether smaller amounts and different formulations of RUTF can achieve similar health outcomes in severely malnourished children aged between six months and five years. The main health outcomes that we investigated were recovery from severe malnutrition, deterioration or relapse, death and the rate of weight gain.
Included study characteristics
We searched databases for studies up to the October 2018, and found 15 studies with 7976 children. Eight studies were conducted in Malawi, four in India, and one apiece in Kenya, Zambia, and Cambodia. One small study included only children infected with HIV, another study analysed children with and without HIV separately for the main outcome (recovery), while the other studies included children who were not infected with HIV or who were untested. Overall, we judged six studies to be at high risk of bias, three studies to be at unclear risk of bias, and six studies to be at low risk of bias. (With 'risk of bias', we mean the extent to which the methods used in a study enable it to determine the truth.) All the studies lasted between 8 and 16 weeks. Only five studies followed up children after the study (for a maximum of six months), and generally reported on a limited number of outcomes.
Of our 15 included studies, six were linked to funding or donations from industry, one did not report the source of funding, and eight studies reported funding where sponsors did not include industry.
Key findings
Compared to alternative dietary approaches, standard RUTF probably improves recovery (moderate‐quality evidence) and may increase the rate of weight gain slightly (low‐quality evidence), but the effects on relapse and death are unknown (very low‐quality evidence). With 'quality of evidence' we mean how confident we are that the particular finding represents the true effect. For example, 'very low‐quality' means we are very uncertain about the finding, 'low‐quality evidence' means the future research is very likely to change the finding, 'moderate‐quality evidence' means that future studies may change this finding, and 'high‐quality evidence' means that it is unlikely that future studies will change the finding.
Standard RUTF meeting total daily nutritional requirements may improve recovery and relapse compared to a similar RUTF given supplementary to the usual diet (low‐quality evidence), but for death and the rate of weight gain, the effects are not known (very low‐quality evidence).
When comparing RUTFs of different formulations, it makes little or no difference for recovery whether a standard or alternative formulation RUTF is used (high‐quality evidence). For relapse, using standard RUTF decreases relapse (high‐quality evidence). It probably makes little or no difference to death (moderate‐quality evidence) and to the rate of weight gain (low‐quality evidence) whether standard or alternative formulation RUTF is used.
Well‐designed, randomised controlled trials (experimental studies where participants meeting the inclusion criteria have an equal chance of being allocated to any of the intervention or control groups) in which analyses have been performed separately for children with and without HIV, and that also measure and report on diarrhoea occurrence, are needed.
Summary of findings
Background
Description of the condition
Malnutrition occurs when the quantity of one or more macronutrients available to the body is inadequate to sustain optimal bodily functions (undernutrition) or when an excessive amount of energy is consumed (overnutrition); this is often accompanied by micronutrient deficiencies (Manary 2008). Malnutrition in infants and young children may present as stunting, wasting, overweight or obesity (UNICEF/WHO/WBG 2017). Stunting and wasting refer to undernutrition, while overweight and obesity are manifestations of overnutrition.
Stunting is a chronic form of malnutrition resulting in linear growth deficits relative to well‐nourished children of the same age (UNICEF/WHO/WBG 2017). A child is defined as stunted if his or her length or height is more than two standard deviations (SD) below the median value for his or her age and sex, based on the World Health Organization (WHO) Child Growth Standards (WHO 2008). Children whose length or height for age falls below this cut‐off point may never achieve their full physical or cognitive potential (UNICEF/WHO/WBG 2017).
By contrast, wasting ‐ the form of malnutrition that is the focus of this review ‐ is an acute condition in which a child is too thin for his or her length or height (i.e. low weight for length or height). Acute malnutrition is classified according to severity as either moderate acute malnutrition (MAM) or severe acute malnutrition (SAM). The conceptual framework by the United Nations Children's Fund (UNICEF) shows the immediate, underlying and basic causes of child undernutrition, with its short‐ and long‐term consequences (UNICEF 2013a). Children diagnosed with MAM or SAM have an increased risk of infectious diseases, developmental delays, and death. SAM is a particularly life‐threatening condition, which requires early detection before the onset of complications, and prompt treatment (UNICEF 2013b). The initial treatment of SAM varies depending on whether it is complicated by infection, metabolic disturbances, severe oedema or poor appetite; or uncomplicated, where children are clinically well, alert and have an appetite (Figure 1).
1.
Diagram depicting our review question and main subgroup analysis
In children under five years of age, MAM is defined as a weight‐for‐height z score (WHZ) between three and two SD below the median or between 70% and 80% of the median, or mid‐upper arm circumference (MUAC) between 115 mm and 125 mm, and no oedema (Black 2008; Lazzerini 2013; WHO 2012). SAM is diagnosed when children have a combination of a WHZ of more than three SDs below the median, a MUAC of less than 115 mm, and the presence of nutritional oedema (Collins 2003; Manary 2008; WHO/UNICEF 2009). MAM or SAM without bilateral pitting oedema is referred to as marasmus, while kwashiorkor is the term used when bilateral pitting oedema is present (Manary 2008). See Table 4 for a more detailed classification system for MAM and SAM.
1. Classification of severe acute malnutrition in children under 60 months old by Collins and colleagues in 2006*.
| Severe acute malnutrition with complications | Severe acute malnutrition without complications |
| Bilateral pitting oedema grade 3a (severe oedema) OR |
MUAC < 115b mm OR |
| MUAC < 115b mm and bilateral pitting oedema grades 1a or 2a (marasmic kwashiorkor) OR |
Bilateral pitting oedema grades 1a or 2a with MUAC ≥ 115b mm AND
|
| MUAC < 110b mm or bilateral pitting oedema grades 1a or 2a AND 1 of the following
|
‐ |
| ↓ | ↓ |
| Inpatient care IMCI/WHO protocol | Outpatient therapeutic care protocols |
| IMCI: Integrated Management of Childhood Illness; MUAC: mid‐upper arm circumference; UNICEF: United Nations Children's Fund; WHO: World Health Organization | |
aGrade 1: mild oedema on both feet or both ankles; Grade 2: moderate oedema on both feet, and on lower legs, hands or lower arms; Grade 3: severe generalised oedema affecting feet, legs, hands, arms and face. bBoth the WHO and UNICEF recommend that the cut‐off value for the MUAC for severe acute malnutrition is 115 mm (WHO/UNICEF 2009). Previously it was 110 mm (Collins 2006a). The adoption of this higher cut‐off value will sharply increase the caseloads, which may influence the cost of nutrition programmes greatly (WHO/UNICEF 2009). However, detecting more children as severely malnourished earlier will lead to a shorter treatment period, which may bring down the cost per child (WHO/UNICEF 2009). cIMCI criteria: 60 respirations/min for children aged < 2 months; 50 respirations/min for children aged 2 to 12 months; 40 respirations/min for children aged 1 to 5 years; 30 respirations/min for children aged > 5 years.
Although some conditions, such as HIV/AIDS, tuberculosis (TB) and kidney failure, may contribute to the onset of undernutrition, poverty and food insecurity are by far the major causes. Undernutrition and infection often co‐exist and are mutually reinforcing: undernutrition increases susceptibility to infection while infection contributes to malnutrition (Kruger 2008; Naude 2008). Infections are associated with anorexia (loss of appetite), electrolyte and metabolic imbalances (WHO 2013); fever increases energy expenditure; and diarrhoea decreases nutrient absorption and can contribute to electrolyte imbalances (WHO 2013).
Despite sustained efforts to combat malnutrition (Hawkes 2015), rates are still alarmingly high. Worldwide, 155 million children under five years of age are stunted, 52 million suffer from wasting (with an additional 17 million suffering from severe wasting) and 41 million are overweight (UNICEF/WHO/WBG 2017). Africa and Asia have the greatest share of all forms of malnutrition. Although less than half of all children under five years old live in lower‐middle income countries, a disproportionate two‐thirds of all stunted children and about three‐quarters of all wasted children live in these countries (UNICEF/WHO/WBG 2017).
Description of the intervention
Addressing the underlying causes of economic deprivation and inequity is, undoubtedly, the only way to eradicate undernutrition in the long term. However, specific nutritional interventions can help ameliorate the health consequences of nutritional deprivation in the interim (Black 2008), and this review focuses on one such intervention for children with SAM.
Until about two decades ago, SAM was primarily managed in hospitals, which greatly limited treatment coverage and impact (WHO/WFP/UNSCN/UNICEF 2007). To reach more children, a community‐based approach, which involves timely detection and provision of treatment for those without medical complications, was developed (WHO/WFP/UNSCN/UNICEF 2007).
The treatment of SAM can be divided into two potential phases, namely stabilisation and rehabilitation. Stabilisation involves a range of clinical interventions, such as treatments for dehydration, electrolyte imbalances and infections (Ashworth 2003). In terms of nutritional support, the WHO recommends continuing breastfeeding (where applicable) along with oral or nasogastric feeds that provide 100 kCal/kg/day (418 kJ/kg/day) and a low protein intake of 1.0 to 1.5 g/kg/day. F‐75, a starter, milk‐based therapeutic formula with a relatively low energy (75 kCal (314 kJ)) and protein content (0.9 g per 100 mL), is typically used during the stabilisation phase (Action Against Hunger 2009; WHO/UNICEF 2009). F‐75 aids in initial metabolic recovery, helping to restore electrolyte imbalances (Action Against Hunger 2009). Oedema (if present) usually starts to disappear, leading to weight loss (fluid loss).
Once the child's appetite has improved and s/he is in a stable medical condition, the rehabilitation phase starts, with catch‐up growth becoming the main focus. In this phase, the recommended energy requirement is 150 to 220 kCal/kg/day (628 to 921 kJ/kg/day) and 2.0 to 6.0 g/kg/day of protein (Ashworth 2003). Traditionally, F‐100 (a milk‐based therapeutic diet, higher in energy (100 kCal/418 kJ) and much higher in protein (2.9 g per 100 mL) than F‐75) is given as part of inpatient care to initiate weight gain (WHO 2013).
Children with complicated SAM require stabilisation as inpatients while those with uncomplicated SAM often do not need inpatient stabilisation (WHO 2013; WHO 2017b; WHO/WFP/UNSCN/UNICEF 2007). Although the approach used can differ between countries and settings, children who are stabilised in hospital usually start rehabilitation as inpatients but complete most of the rehabilitation phase at home (with follow‐up in the outpatient department).
A challenge for treating children with SAM in low‐ and middle‐income countries (LMICs) is that prolonged hospital care of children with acute malnutrition may not always be possible. In these settings ready‐to‐use therapeutic food (RUTF) ‐ energy‐dense foods with a low moisture content that can be eaten directly from the packaging ‐ has been introduced for home‐based treatment during the rehabilitation phase. (Because of its high energy and protein content, RUTF is not suitable for the stabilisation phase.)
RUTF, a solid or semi‐solid product, was originally developed by Nutriset and the Institute for Research and Development in France, as a home‐based follow‐up treatment after F‐100 (Bazzano 2017). Table 5 shows the nutritional contents of RUTF as recommended by the WHO, referred to in this review as standard RUTF; for example, see Table 6 for a typical peanut‐based RUTF recipe.
2. Nutritional composition of ready‐to‐use therapeutic food, as recommended by the World Health Organizationa.
| Nutritional element | Amount |
| Moisture content | 2.5% maximum |
| Energy | 520‐550 kCal/100 g |
| Protein | 10%‐12% total energy |
| Lipids | 45%‐60% total energy |
| Sodium | 290 mg/100 g maximum |
| Potassium | 1110‐1400 mg/100 g |
| Calcium | 300‐600 mg/100 g |
| Phosphorus (excluding phytate) | 300‐600 mg/100 g |
| Magnesium | 80‐140 mg/100 g |
| Iron | 10‐14 mg/100 g |
| Zinc | 11‐14 mg/100 g |
| Copper | 1.4‐1.8 mg/100 g |
| Selenium | 20‐40 μg |
| Iodine | 70‐140 μg/100 g |
| Vitamin A | 0.8‐1.1 mg/100 g |
| Vitamin D | 15‐20 μg/100 g |
| Vitamin E | 20 mg/100 g minimum |
| Vitamin K | 15 to 30 μg/100 g |
| Vitamin B1 | 0.5 mg/100 g minimum |
| Vitamin B2 | 1.6 mg/100 g minimum |
| Vitamin C | 50 mg/100 g minimum |
| Vitamin B6 | 0.6 mg/100 g minimum |
| Vitamin B12 | 1.6 μg/100 g minimum |
| Folic acid | 200 μg/100 g minimum |
| Niacin | 5 mg/100 g minimum |
| Pantothenic acid | 3 mg/100 g minimum |
| Biotin | 60 μg/100 g minimum |
| n‐6 fatty acids | 3%‐10% of total energy |
| n‐3 fatty acids | 0.3%‐2.5% of total energy |
3. A typical recipe for a WHO‐recommended ready‐to‐use therapeutic fooda.
| Ingredient | % weight |
| Full‐fat milk | 30 |
| Sugar | 28 |
| Vegetable oil | 15 |
| Peanut butterb | 25 |
| Mineral‐vitamin mix | 1.6 |
aManary 2006 bStrict quality control is essential.
Where RUTF is used for home‐based rehabilitation, it can be provided to meet all of the nutritional requirements of a child recovering from SAM; for example, in low‐income settings where food security may be a significant issue. Alternatively, RUTF may be provided for SAM children as a supplement to the usual family diet.
RUTF can be formulated and produced in various ways. It can be cheaper to produce RUTF with less or no milk powder, or more acceptable if locally or indigenous ingredients are used. Furthermore, fatty acid composition (specifically, omega‐3 fatty acids) may play a role in infection and inflammation, and thus might be a beneficial ingredient in therapeutic food. Similarly, as children with SAM may have compromised gastrointestinal function, the addition of pre‐ and probiotics may be advantageous.
RUTF is often produced on a commercial scale, but can also be produced locally on a small scale (e.g. in an institution kitchen such as that of a research centre or clinic) with ingredients that may differ from commercially produced RUTF (Bazzano 2017). Two examples of commercially produced RUTF are a peanut‐based paste called Plumpy'nut® (Nutriset, France; Table 7), and a solid biscuit made from cooked wheat called BP100® (developed by Compact, Denmark) (Collins 2004; Navarro‐Colorado 2005). Both are fortified with micronutrients and have very low water activity, which discourages microbial growth (Brewster 2006; Kruger 2008; WHO/WFP/UNSCN/UNICEF 2007). Children as young as six months of age can consume RUTF with a homogenous paste texture (DFID 2009). Solid RUTF can also be soaked in clean, boiling water and eaten as porridge by young infants and as a biscuit by older children. Infants younger than six months should not be given RUTF (DFID 2009).
4. Nutritional information of Plumpy'nut® by Collins and Henry in 2004*.
| Nutrient | Unit | Plumpy'nut® (100 g) |
| Energya | kCal | 530 |
| Energy | kJ | 2218 |
| Protein | g | 14.5 (11% of product's energy) |
| Carbohydrateb | g | 43 (32% of product's energy) |
| Fat | g | 33.5 (57% of product's energy) |
| Ash | g | 4 |
| Moisture | g | < 5 |
| Water activity | aw | 0.241 |
| Copper | mg/kg | 1.7 |
| Zinc | mg/kg | 13 |
| Calcium | mg/kg | 310 |
| Sodium | mg/kg | < 290 |
| Magnesium | mg/kg | 86 |
| Iron | mg/kg | 12.45 |
aAtwater factors used to calculate energy. bCarbohydrate is by difference assuming protein to be nitrogen multiplied by 6.25.
A total of about 10 to 15 kg of RUTF over a period of six to eight weeks is considered necessary for recovery from SAM (UNICEF 2013b; WHO/WFP/UNSCN/UNICEF 2007). RUTF as home‐based rehabilitation is not recommended as stand‐alone care, but rather as part of a treatment protocol that provides full medical consultation in conjunction with nutritional counselling, routine medical care (such as immunisations, essential drugs, etc.) and referral to hospital‐based treatment where needed (UNICEF 2013b).
Challenges with the use of RUTF
RUTF, especially when made with disaccharide sucrose rather than polysaccharide dextromaltose, has a relatively high, renal solute load (a high load of substances that need to be eradicated in the urine) (Sandige 2004). Because excretion of these solutes requires water, there are concerns that RUTF might exacerbate dehydration and increase the risk of mortality in SAM (Grellety 2000; WHO 2013). It is therefore recommended that children consuming RUTF receive additional, free water (Greiner 2014). However, this increases the risk of bacterial contamination in some settings.
In 2010, when the Nutriset patent was made available in developing countries, UNICEF ‐ the largest international procurer of RUTF (Bazzano 2017) ‐ published manufacturing standards for RUTF production (Komrska 2010a; Komrska 2010b). UNICEF further launched competitive bidding to ensure that local suppliers were used. While this reduced the transportation time and cost, it introduced the need for additional quality assurance to ensure optimal products (UNICEF 2015a).
Recipes for RUTF do not necessarily include peanut or milk powder, although the WHO recommends that at least half of the proteins should come from a milk source (WHO/WFP/UNSCN/UNICEF 2007). Peanuts can cause allergic reactions in susceptible individuals, and are known be at high risk for aflatoxin contamination. Milk powder on the other hand, is expensive and often needs to be imported (Collins 2004). The cost of milk powder in Malawi constitutes more than half of the final cost of the RUTF (Collins 2004). Irena 2015 reported that the removal of milk powder and the inclusion of locally available grains and pulses can reduce the cost of ingredients by about a third.
For non‐commercial production of RUTF, the following basic ingredients are required (Collins 2004).
Staple food as the main ingredient (preferably a cereal).
Protein supplement from a plant or animal food (for example, beans, groundnuts, milk, meat, chicken, fish, egg). For economic reasons, legumes and oilseeds are mostly used.
Vitamin and mineral supplement (a vegetable or fruit, or both).
Energy supplement (a fat, oil or sugar) to increase the energy density.
The food safety of the production process is an important issue, with strict monitoring and careful attention needed to avoid contamination by microorganisms or other harmful substances (for example, heavy metals, pesticides, anti‐nutritional factors such as phytate or protease inhibitors) (WHO/WFP/UNSCN/UNICEF 2007).
For young children diagnosed with SAM for the first time and newly exposed to RUTF, acceptability may be a problem (Greiner 2014). However, progress has been made in terms of increasing the acceptability of RUTF; for example, by using locally grown ingredients (Weber 2016).
The demand for RUTF increased from less than 9000metric tonne in 2009, to over 30,000 metric tonne in 2014 (Bazzano 2017; UNICEF 2015b). Yet, despite the increased demand and growing competition amongst suppliers, the price is still high (UNICEF 2015a). According to UNICEF 2013b, the cost to rehabilitate one child with SAM is around USD 100. An Ethiopian case study conducted by UNICEF in 2013 found that the purchase of RUTF accounted for approximately half of the operating costs of a community‐based management programme for acute malnutrition (Bazzano 2017; UNICEF 2013c). Cost‐effectiveness, however, is related to factors such as SAM prevalence, population density and coverage (UNICEF 2015a). Producing RUTF locally presents a variety of challenges, including the cost of high‐quality ingredients, currency fluctuations, value‐added tax and quality control (Segré 2017; UNICEF 2015a). However, there are options to address some of these challenges. One example is a programming tool developed by Weber and Callaghan, to help facilitate the manufacturing of more cost‐effective, alternative RUFTs, without compromising on quality (Weber 2016). This tool also allows for incorporating cultural and religious preferences.
The use of RUTF, however, remains a controversial issue (Bazzano 2017; Greiner 2014; UNICEF 2013b). Apart from the cost of RUTF, as described above, there are concerns about commercial exploitation beyond SAM therapy (UNICEF 2013b). The increased demand for RUTF has led to expansion of the commercial product range, such as ready‐to‐use supplementary foods (RUSFs; for instance, lipid‐based nutritional supplements (LNS)) (Greiner 2014; Lazzerini 2013). RUSFs are used in treating MAM and stunting, as well as meeting nutritional needs and preventing malnutrition (Bazzano 2017). Conflict of interest issues, with supported examples from industry, have been extensively described in Bazzano 2017.
How the intervention might work
Recovery from SAM during the rehabilitation phase requires high energy intake accompanied by high‐quality protein and micronutrients. Locally available foods, if not fortified, often do not meet the requirements of children recovering from SAM and are prone to bacterial contamination. Infants and young children can eat limited amount of food at a time (Lin 2008). Lower energy‐density foods, together with a low frequency of feeding, can result in an energy intake that is insufficient to enable recovery.
RUTF, a nutrient‐dense feed, has been developed to meet these increased requirements and limits the probability of bacterial contamination. The following characteristics of RUTF may contribute to its possible beneficial effects in the rehabilitation of SAM (Bazzano 2017; Briend 1999).
Balanced, nutritious, home‐based therapy
Affordable, compared to facility‐based rehabilitation
Can be eaten safely at home, even where hygienic conditions are poor (WHO/WFP/UNSCN/UNICEF 2007)
Long shelf life (up to two years)
No special storage (for example, refrigeration) or preparation required
Due to these properties, RUTF has become pivotal to the implementation of community‐based programmes for the management of malnutrition.
Why it is important to do this review
Both the WHO and UNICEF recommend the use of RUTF in the community as therapeutic feeding for outpatient rehabilitation for children with uncomplicated SAM (WHO/UNICEF 2009; see Table 8). Furthermore, the WHO is committed to ensuring the inclusion of RUTF in the essential medicine lists (WHO 2017a).
5. Severe acute malnutrition management as recommended by the WHO and UNICEFa.
| Independent additional criteria |
|
|
| ↓ | ↓ | |
| Type of therapeutic feeding | Facility‐based feeding | Community‐based feeding |
| Intervention |
|
|
| Discharge criteria (transition criteria from facility‐ to community‐based care) |
|
|
| RUTF: ready‐to‐use therapeutic food; UNICEF: United Nations Children's Fund; WHO: World Health Organization | ||
aWHO/UNICEF 2009 bChildren who eat at least 75% of their calculated RUTF ration for the day.
RUTF and RUSFs may pose risks for undermining best nutrition practices for infants and young children, such as compromising breastfeeding after the age of six months, despite disclaimers provided by industry (Bazzano 2017; UNICEF 2013b). Furthermore, increased consumption of RUTF in a young child's diet may lead to alteration of the epigenome (which is involved in regulating gene expression and can be affected by changing environments), thereby potentially programming metabolic and physiological function throughout the life cycle (Bazzano 2017). Also, countries utilising RUTF are undergoing a nutrition transition, suffering a double burden of under‐ and overnutrition (Bazzano 2017). Careful consideration should therefore be given to programmes aimed at combating undernutrition, to prevent the undesirable long‐term effects of overweight and obesity.
In the previous version of our review (Schoonees 2013), the limited evidence‐base identified precluded definitive conclusions regarding differences in clinical outcomes in children with SAM who were given home‐based RUTF compared to other home‐based nutritional approaches, or who received RUTF in different daily amounts or formulations. A number of new studies have since been conducted and are included in this review update. The findings of this systematic review will be of special interest to people in LMICs where SAM is a particular challenge, as well as to organisations involved in the preparation of clinical guidelines for practitioners and policy makers dealing with SAM (for example, WHO, UNICEF and government health departments).
Objectives
To assess the effects of home‐based RUTF used during the rehabilitation phase of SAM in children aged between six months and five years on recovery, relapse, mortality and rate of weight gain.
Methods
Criteria for considering studies for this review
Types of studies
A randomised controlled trial (RCT) is the optimal study design for answering questions about intervention effects. Because there are a number of existing RCTs that address our primary outcomes we have, as in the earlier version of this review (Schoonees 2013), included only RCTs and studies defined as quasi‐randomised (that is, studies that used an inadequate method of randomisation, such as alternation or date of birth). We included studies regardless of whether the unit of randomisation was individuals or clusters (that is, studies randomised by groups such as clinics, villages or families).
Types of participants
Children aged between six months and five years with SAM, regardless of country, setting or disease status, and irrespective of the method of diagnosis employed.
Where a potentially eligible study included children with both SAM and MAM (or other types of malnutrition), we included studies where SAM children made up 50% or more of the randomised trial participants. Where results were not available separately for children with SAM and could not be obtained by contacting the study authors, we excluded the trial.
Types of interventions
Experimental
Home‐based rehabilitation with standard RUTF (meeting the WHO recommendations (WHO/WFP/UNSCN/UNICEF 2007) for nutritional composition; either commercially or non‐commercially produced) as total nutrition or supplement
In some settings, RUTF is provided in dosages that meet the child's full daily nutritional requirements (i.e. RUTF is the only food provided), while in other settings RUTF is given as a supplement only (i.e. caregivers are instructed that children should consume the RUTF in addition to the family's home diet). We considered both approaches in this review.
We included studies where children with SAM started F‐100 or RUTF treatment in the rehabilitation phase as inpatients, provided 50% or more of the rehabilitation phase and treatment with RUTF occurred at home.
Control
Dietary rehabilitation as usual (e.g. home‐based foods that are often energy dense and fortified, alternative dietary approach, etc.)
Similar RUTF to the experimental RUTF, but used as a supplement only
Alternative RUTF type (i.e. RUTF differs meaningfully in terms of ingredients, nutritional content, or both)
We excluded studies in which the effects of RUTF were potentially confounded by another intervention; that is, where multiple interventions were involved, comparison groups should have received the same rehabilitation apart from the experimental RUTF. Furthermore, we excluded studies where standard (i.e. WHO‐recommended), commercially produced RUTF was compared to a locally produced RUTF with similar ingredients and nutrition content.
Types of outcome measures
Primary outcomes
Recovery, during and beyond the intervention period, as defined by study authors
Deterioration or relapse, during and beyond the intervention period, as defined by study authors
Mortality, during and beyond the intervention period
Secondary outcomes
Rate of weight gain, during the intervention period (to standardise weight gain across different ages, baseline weight or lengths and heights)
Time to recovery, during the intervention period
Anthropometrical status, at the end of the intervention period and beyond (assessed with, for example, WHZ, weight‐for‐age z score (WAZ), height‐for‐age z score (HAZ), MUAC)
Cognitive function and development, at the end of the intervention period and beyond (assessed with, for example, the Denver II (Frankenburg 1992), Bayley Scales of Infant and Toddler Development (Hoskens 2018))
Adverse outcomes (such as allergic reactions and diarrhoea), during and beyond the intervention period, as reported by study authors
Acceptability of RUTF, during the intervention period, as defined by study authors
Economic commentary
In this update, we expanded our review by searching for studies that evaluated the cost‐effectiveness of home‐based RUTF as treatment for children (between six months and five years of age) with SAM. We included studies regardless of whether they had carried out a formal cost‐effectiveness assessment (i.e. whether or not the study included an effectiveness component). Furthermore, we included studies where RUTF was only one component of a community‐based treatment, but reported results separately for the RUTF component.
Search methods for identification of studies
We used a comprehensive search strategy to identify all relevant studies regardless of language or publication status. Searches for the first version of the review took place in April 2013 (Schoonees 2013). For this update, we ran searches in May and June 2017, and again in October 2018. We also expanded our search to find cost‐effectiveness studies.
Electronic searches
We searched the following databases and trials registers using the search strategies in Appendix 1.
Cochrane Central Register of Controlled Trials (CENTRAL; 2018, Issue 12) in the Cochrane Library (searched 9 October 2018)
MEDLINE(R), Epub Ahead of Print, In‐Process & Other Non‐Indexed Citations, Daily and Versions(R) Ovid (1946 to 8 October 2018)
Embase Ovid (1980 to 8 October 2018)
African Index Medicus (indexmedicus.afro.who.int; searched 9 October 2018)
CINAHL EBCSOhost (Cumlative Index to Nursing and Allied Health Literature; 1937 to 9 October 2018)
Science Citation Index Web of Science (1970 to 9 October 2018)
LILACS (Latin American and Caribbean Health Science Information database; lilacs.bvsalud.org/en; searched 9 October 2018)
ZETOC (zetoc.jisc.ac.uk; limited to conference search; searched 9 October 2018)
Epistemonikos (www.epistemonikos.org; last five years; searched 9 October 2018)
ClinicalTrials.gov (clinicaltrials.gov; searched 10 October 2018)
ISRCTN registry (www.isrctn.com; searched 9 October 2018)
WHO International Clinical Trials Registry Platform (ICTRP; apps.who.int/trialsearch; searched 10 October 2018)
We developed separate strategies to identify cost‐effectiveness studies and ran them in them in the following databases (Appendix 2).
MEDLINE OVID (1946 to 8 October 2018)
MEDLINE Epub Ahead of Print, In‐Process & Other Non‐Indexed Citations, Daily and Versions Ovid (1946 to 8 October 2018)
Embase Ovid (1947 to 8 October 2018)
NHS Economic Evaluation Database (NHS EED; 2015, Issue 2), part of the Cochrane Library (searched 12 June 2017; no new records added to NHS EED since March 2015)
ECONLIT EBSCOHost (1969 to 9 October 2018)
Appendix 3 shows the search strategies used in the previous version of this review (Schoonees 2013).
Searching other resources
We contacted researchers and healthcare professionals working in the field, sending them the list of our included and excluded studies, and asking whether they were aware of any additional studies. We also checked the reference lists of included studies, appropriate reviews and cost‐effectiveness studies to identify additional studies. Furthermore, we contacted the authors of each relevant study identified in the studies registries to establish whether the study had been completed (and if so, whether or not there was a published or unpublished manuscript they could share with us), and the authors of all included studies to determine if they were aware of additional studies (published, unpublished or ongoing) in the field.
Data collection and analysis
Selection of studies
Three review authors (AS, AM and ML) independently and in duplicate screened the titles and abstracts of all studies identified by the electronic searches and selected those that met the prespecified eligibility criteria (Criteria for considering studies for this review). We used the software Covidence for screening (titles and abstracts, and full‐text articles) and discussed disparate judgements until we reached consensus. For studies deemed potentially eligible, we obtained the full‐text reports and two review authors (AS and AM or ML) independently assessed these for eligibility. We contacted the authors of the primary studies where there was missing information or if clarification was needed. In the event of no response, or incomplete or irrelevant information being received, we categorised the study as awaiting classification (Characteristics of studies awaiting classification). We resolved any disagreements by discussion among the review authors. Two review authors (AS and AM or ML) also independently screened the results of the cost‐effectiveness searches. We have presented the results of the screening process in a PRISMA flow diagram (Moher 2009). We listed studies we initially thought to be relevant but that we later excluded in the Characteristics of excluded studies tables, with reasons for exclusion.
Data extraction and management
Three review authors (AS, ML and AM) extracted data from included studies in duplicate and independently, using a pre‐piloted electronic data extraction sheet. We resolved disagreements by discussion and reaching consensus. For each included trial, we extracted information on each of the following: general (for example, ethics approval, funding and study period); methods (for example, study design and number of participants randomised per group); participants (for example, country, setting, age and comorbidity); interventions (for example, description, dose, duration, and concomitant treatment); outcomes (for example, description and time point collected); results (for example, numerical results for prespecified outcomes); and miscellaneous information (for example, testing for peanut allergies and quality of anthropometrical measurements). In addition, EN, AS and ML extracted data (one review author per trial, with AS double‐checking data across studies for consistency) using the Template of Intervention Description and Replication (TIDieR) table in Hoffmann 2017.
We emailed the study authors where reported information was unclear or contradictory, or where important data were missing.
We entered the extracted data into one of the following tables:
With the exception of data from ongoing studies, we extracted data in duplicate at all times.
We used the Cochrane Review by Sinclair and colleagues to inform our approach to presenting the data from the included cost‐effectiveness studies (Sinclair 2012). One review author (EN for studies identified with the 2017 search, and AM for studies identified with the 2018 search), extracted and tabularised the data from the included studies on cost. AS double‐checked the extracted data across studies for consistency. We have provided further information about the economic commentary in the Discussion section.
Assessment of risk of bias in included studies
Two review authors (AS and ML) independently assessed each included study for risk of bias using the guidelines provided in the Cochrane Handbook for Systematic Reviews of Interventions (Higgins 2017), and the criteria set out in Appendix 4. They assessed studies for bias across the following domains: sequence generation, allocation concealment, blinding, incomplete outcome data, selective reporting and other potential sources of bias. For each domain, both review authors independently rated each included study at low risk of bias, high risk of bias or unclear risk of bias. They discussed any disagreements with a third review author (JV).
We evaluated cluster studies across the following, additional domains, using the specific criteria set out in Appendix 5: recruitment bias, baseline imbalance, loss of clusters, incorrect analysis and comparability with individually randomised studies (Higgins 2017).
We decided on overall risk of bias per study by taking into consideration the domains addressing selection bias, attrition bias (specifically large or differential attrition between groups) and 'other bias'.
Measures of treatment effect
We used Review Manager 5 (RevMan 5) to manage the data and to conduct the analyses (Review Manager 2014). We calculated risk ratios (RR) for dichotomous data and mean differences (MD) for continuous data, and presented all results with 95% confidence intervals (CI). In cases where we could not extract raw data to calculate treatment effects, we reported results according to study authors.
Unit of analysis issues
Cross‐over trials
Because of the nature of the condition involved (SAM), we did not find any cross‐over trials.
Cluster trials
For cluster trials, we followed the method of adjusting for clustering, described in the Cochrane Handbook for Systematic Reviews of Interventions (Higgins 2011). None of the four included cluster trials had properly accounted for the cluster design. Therefore, we used an 'approximate method', which entailed calculation of an 'effective sample size' for the comparison groups, by dividing the original sample size by the 'design effect', which is 1 + (c‐1)ICC, where c is the average cluster size and ICC is the intra‐cluster correlation coefficient. For dichotomous data, we divided both the number of participants and the number who experienced the event by the same design effect, while for continuous data, we adjusted only the sample size (we left means and SDs unchanged). The number of clusters was available for three of the four cluster trials and we contacted the study author of the fourth study to obtain the number of clusters (Ndekha 2005). We imputed a low ICC of 0.001 for two studies because we did not anticipate large between‐cluster variability (Manary 2004; Ndekha 2005). The clusters in these studies were either the number of weeks of discharge or the days of discharge in the month. In this way, children from the same community were assessed in the same facility. We imputed a higher ICC of 0.005 for Ciliberto 2005 because seven different facilities represented seven clusters. We, therefore, expected a certain degree of between‐cluster variability in this trial. Although these values might seem arbitrary, we preferred to use them to adjust the sample sizes as they are more plausible than an ICC of 0. The authors of Irena 2015 reported an ICC of 0.015, which we used to adjust the raw counts provided in the paper. We had initially intended to use the generic inverse variance method in RevMan 5, but since we had values for the totals, means and SDs per group from each study for continuous data, it became unnecessary to do so.
Multiple treatment groups
In three studies there were three arms that were all relevant to our review (Bhandari 2016 had two experimental RUTF arms compared to the same control; Manary 2004 and Ndekha 2005 had one experimental arm compared to two controls), and a fourth study had three arms that each included RUTF (Jones 2015). In Manary 2004 and Ndekha 2005 the experimental arm received standard RUTF in a dose that meets daily nutritional requirements whereas another arm received a similar RUTF but given as a supplement to the children's usual diet. Therefore, we could not combine these two arms into a single pair‐wise comparison (Higgins 2011), and, as they relate to different comparisons, we analysed them separately. In Comparison 1, we thus selected the arm that received standard RUTF in sufficient quantity to meet daily nutritional requirements compared to the arm that received a maize and soy flour blend as intervention (adjusted for clustering using the abovementioned design effects). In Comparison 2, we also selected the arm that received standard RUTF in sufficient quantity to meet daily nutritional requirements, but compared it to the arm that received a similar RUTF but given as a supplement (adjusted for clustering using the above‐mentioned design effects).
Bhandari 2016, which addresses our Comparison 1, had two experimental arms that are both relevant to our question and compared it to a control of home‐prepared locally available foods ("A‐HPF"). The experimental interventions were "RUTF‐C", which is standard RUTF prepared in a factory and "RUTF‐L", which is standard RUTF that trained research staff prepared in a local site kitchen. We used both these arms in the same meta‐analyses and compared it against the control group, where for dichotomous outcomes we divided the control group's number of events and sample size by two and for continuous outcomes divided the control group's sample size by two and left the means and SDs unchanged.
Jones 2015, which addresses our Comparison 3, had an arm that received standard RUTF ("S‐RUTF"), an arm that received a flax seed‐containing RUTF ("F‐RUTF") and an arm that received the flax seed‐containing RUTF plus fish oil capsules ("FFO‐RUTF"). Because we could not combine the two latter arms, we chose the most appropriate comparison, which is standard RUTF versus "F‐RUTF". We considered the FFO‐RUTF arm not relevant to our question as the fish oil capsules were not part of the RUTF formulation and thus a potential confounding intervention.
We reported data from the latest time point during or at the end of the intervention period, and at the latest time point after the intervention period (follow‐up), as stipulated in the Types of outcome measures section (unless otherwise stated). We could not group time points as planned in our protocol (Schoonees 2011), owing to the data available (one month or less of RUTF treatment, less than one to two or more months of RUTF treatment and more than two to six months of RUTF treatment). (In hindsight, these prespecified time points are not that practical, as treatment with RUTF lasting less than two months or more than four months seldom takes place in practice.) The primary outcomes in the included studies were either measured at the time of recovery (which varied between participants and such individual data were not reported unless time to recovery was an outcome in the trial), or at the end of a predetermined time period. We did not distinguish in the analyses between such studies; however, we reported what time points were used with each outcome in each trial.
Dealing with missing data
We attempted to obtain essential missing data (for example, standard deviations, units in which outcomes were measured, results for outcomes pre‐specified but not reported, whether or not participants were stabilised in hospital before the trial, intervention duration) by contacting the study authors via email. We classified attrition per study as (1) pre‐randomisation, (2) immediately post‐randomisation or (3) dropouts during the intervention phase, supplemented with reasons for the absence where these were reported in the article (Table 9). We imputed values for the ICC where we could not obtain them from published data.
6. Classification of attrition from included studies.
| Study ID | Participants recruited (n) | Pre‐randomisation attrition (n) | Immediate post‐randomisation attrition (n) | Dropouts during the intervention period (n) |
| Bahwere 2014 | 619 | 18 = allocated to an arm prior to randomisation 1 = re‐admission (had SAM before and return from defaulting) |
5 (all from the control group) = 3 had no baseline data and 2 were older than 59 months | 74 = dropped out; reasons not reported 7 = deaths; reasons not reported |
| Bhandari 2016 | 1190 | 193 = complicated SAM 3 = allergic to animal milk 29 = family moving away 35 = non‐consent 22 = siblings already enrolled 2 = incorrectly identified as SAM |
0 | 48 = withdrew consent 3 = moved away 3 = deaths; reasons not reported |
| Ciliberto 2005a | 1178 (includes children with MAM and SAM) | 0 | 41 = reasons not reported | 72 = reasons not reported |
| Hsieh 2015a | 141 | 0 | 0 | 3 = deaths; reasons not reported 8 = lost to follow‐up; reasons not reported |
| Hsieh 2015b | Unclear | Unclear | Unclear | Unlikely |
| Irena 2015a | 2462 | 265 = not meeting eligibility criteria 153 = required inpatient care 70 = relapsed 47 = refused |
0 | 251 = deaths; reasons not reported 543 = "defaulters"; 116 could be traced and 427 moved from the location |
| Jadhav 2016 | 1268 | 947 = reasons not reported | 106 = dropped out over first 2 weeks; reasons not reported | 183 = dropped out; reasons not reported; deaths not reported |
| Jones 2015 | 236 | 63 = not residing in area 33 = age not eligible 23 = HIV‐infected 19 = not SAM 6 = treated for TB 5 = already on lipid‐based supplements 6 = discharged/screened before screening was finalised 2 = previously enrolled in the study 18 = refused |
b4 = deaths b1 = ineligible b5 = voluntarily withdrew; reasons not reported |
b4 = deaths; reasons not reported b6 = voluntarily withdrew; reasons not reported |
| Kerac 2009 | 1024 (eligible age was 5 to 168 months) | 124 = deaths 21 = absconded from ward 13 = not SAM 67 = refused 4 = "other" |
Unclear |
b175 = deaths; reasons not reported b53 = dropped out; outpatient defaulters or ward absconders; reasons not reported b8 = "other"; transfers out or final outcome unknown |
| Manary 2004* | 452 | 77 = refused 93 = HIV infected |
0 | 37 = deaths; reasons not reported 47 = dropped out; reasons not reported |
| Ndekha 2005a | 93 | 0 | 0 | 11 = deaths; reasons not reported 17 = dropped outs; reasons not reported |
| Oakley 2010 | 1961 | 87 = reasons not reported | 0 | 64 = deaths; reasons not reported 51 = lost to follow‐up; no reasons reported other than "those lost were more likely to be younger and marasmic" (quote) |
| Shewade 2013 | 32 | 6 = refused | 0 | 0 |
| Sigh 2018 | 125 | 1 = Down Syndrome 1 = cerebral palsy 1 = had a stoma 1 = fever |
0 | 2 = deaths; 1 related to HIV and 1 related to TB 47 = dropped out, "mainly due to long traveling distances" (quote) |
| Thapa 2017 | 122 | 2 = sick 5 = migrants 3 = refused |
0 | 0 |
| MAM: moderate acute malnutrition; SAM: severe acute malnutrition; TB: tuberculosis | ||||
aFor cluster‐randomised trials: actual values reported here (not adjusted for design effect). bOnly data for relevant study arms/eligible study participants were reported here.
For dichotomous data (for example, recovery and mortality during the intervention period), we used the intention‐to‐treat (ITT) principle to calculate effect sizes for individual studies or to pool more than one trial. We assumed that the participants who were lost to follow‐up or dropped out of the study did not experience the event of interest. However, for the outcome of 'relapse', we assumed that those who dropped out did not receive any treatment (RUTF or the control diet) and therefore experienced the event. Furthermore, when assessing dichotomous outcomes (e.g. recovery) at follow‐up (e.g. six months after the children initially recovered), we employed the available‐case principle; that is, we assessed only those who recovered during the intervention period and came back for follow‐up, as opposed to all children who recovered. We did not consider it plausible to assume that those who did not come back deteriorated. For continuous data, we calculated MDs for studies based on the available‐case principle.
Assessment of heterogeneity
We assessed heterogeneity by visual inspection of forest plots and statistically by means of the Chi2 test for heterogeneity (significance level P value < 0.10). We quantified heterogeneity using the I2 test (Higgins 2002), where I2 values of 50% or more indicated a substantial level of heterogeneity (Higgins 2003).
We considered the following characteristics as possible sources of clinical heterogeneity (and therefore used these in subgroup analyses; Subgroup analysis and investigation of heterogeneity): whether or not participants were stabilised as inpatients before they received home‐based RUTF; differences in RUTF (e.g. commercially produced or not); differences in age across participants, and differences in comorbidity across participants.
Assessment of reporting biases
We had planned to assess the likelihood of reporting bias with funnel plots using at least 10 studies per comparison and outcome (Sterne 2017). However, we identified too few studies to allow for this.
Data synthesis
We anticipated a high degree of heterogeneity due to the inclusion of children across different settings, some of whom were hospitalised before enrolment into the study and others not; intervention periods across studies being of differing duration; and the use of different definitions (e.g. for recovery and the rate of weight gain). For this reason, we used a random‐effects model to combine the results per comparison and outcome across studies, with inverse‐variance weighting for continuous outcomes and Mantel‐Haenszel weighting for dichotomous outcomes. Where substantial statistical heterogeneity existed, we investigated the potential sources of heterogeneity through subgroup analysis as reported below (Subgroup analysis and investigation of heterogeneity).
Using the GRADE tool (Guyatt 2011), AS and ML evaluated the quality of evidence (high, moderate, low or very low) of the four most important outcomes (recovery, relapse, mortality and the rate of weight gain) for all three comparisons:
standard RUTF provided at a dose that meets total daily nutritional requirements versus an alternative dietary approach;
standard RUTF provided at a dose that meets total daily nutritional requirements versus as a supplement to the usual diet; and
standard RUTF versus RUTF using an alternative formulation.
We considered five reasons for possible downgrading of the quality of the evidence, namely limitations in study design or execution (risk of bias), inconsistency of results, indirectness of evidence, imprecision and publication bias. We have reported these ratings in 'Summary of findings' tables, which we created using GRADEPro GDT 2015 software.
Subgroup analysis and investigation of heterogeneity
We considered heterogeneity to be statistically significant when I2 was 50% or higher and P value was under 0.10. We performed subgroup analyses when we detected statistical heterogeneity, or, in the case of pre‐trial hospitalisation, regardless of statistical heterogeneity. We considered the following subgroups.
Pre‐trial hospital stabilisation versus no pre‐trial hospitalisation: clinical heterogeneity could exist between children diagnosed with complicated SAM (requiring stabilisation in hospital) compared to those with uncomplicated SAM (who usually do not require hospitalisation)
Commercial (i.e. factory) versus non‐commercial (i.e. institution kitchen) RUTF: it is generally cheaper to produce RUTF non‐commercially in a local site kitchen than in a food factory (commercially); however, there are concerns about batch consistency and microbiological safety in the case of non‐commercial production
Different types of RUTF products (for example, corn and soy‐based versus peanut‐based RUTF)
Age of children: 6 to 12 months, as this is the ideal period to start weaning from a milk‐based diet; 13 months to 5 years, as these children consume a mixed diet (mostly not breast milk although the child may still be taking some
Children with or without comorbid disease (for example, HIV/AIDS, tuberculosis, malaria)
Because subgroup analyses should be interpreted with caution, we applied the following criteria when interpreting the results: consideration of the direction of the point estimate per subgroup; overlap of the CIs of different subgroups; and statistical tests for differences between subgroups.
The available data did not allow subgroup analyses in relation to age (i.e. the individual studies included in our review did not stratify or report data in a way that allowed us to conduct such analyses). In Comparison 1, we assessed subgroups 1, 2 and 5, where data allowed. In Comparison 2, with only two studies, we could only apply subgroup 5; and in Comparison 3, we assessed subgroups 1, 3 and 5, where data allowed. More detail per comparison, as available data allowed, follows below (Included studies).
Sensitivity analysis
Where data allowed, we performed sensitivity analyses on the four outcomes reported in the 'Summary of findings' tables, to assess the influence of study quality (using low risk of bias in selection bias, attrition bias, and other bias as markers) and study design (cluster trials versus individually randomised controlled trials) on the findings.
Results
Description of studies
Results of the search
We recorded the results of the search and screening process in a PRISMA flow diagram; see Figure 2. Briefly, we screened 2830 search results in 2013 (Schoonees 2013), and, for this update, an additional 2729 records (of which 526 were from the searches for cost‐effectiveness studies) in 2017 and 2018. For this update, we scrutinised 39, new, full‐text reports that we identified as potentially eligible for the effects (main) part of our review, and of these, selected 12 new reports (11 new studies) for inclusion (Included studies); categorised two new reports (two studies) as Studies awaiting classification; identified 10 new reports (eight studies) of Ongoing studies; and excluded 15 reports with reasons (Excluded studies). We used Google Translate to conduct a preliminary assessment of non‐English abstracts, but did not need to obtain the full texts for any of these studies.
2.
PRISMA flow diagram of search for effectiveness section of the review
Included studies
This review includes 7976 children from a total of 15 studies: four from our 2013 review (Schoonees 2013) namely Ciliberto 2005, Manary 2004, Ndekha 2005 and Oakley 2010; and 11 that are new to this update (Bahwere 2014; Bhandari 2016; Hsieh 2015a; Hsieh 2015b; Irena 2015; Jadhav 2016; Jones 2015; Kerac 2009; Shewade 2013; Sigh 2018; Thapa 2017). Of these 15 studies, two were reported in the same article (Hsieh 2015a; Hsieh 2015b). We contacted the study authors and established that a detailed manuscript for Hsieh 2015b does not exist. In addition, we have included two reports of the same study as separate studies (Manary 2004; Ndekha 2005), as they involved different children, namely those with and without HIV. Four of the 15 included studies are cluster trials (Ciliberto 2005; Irena 2015; Manary 2004; Ndekha 2005). After calculating their respective effective sample sizes, the total number of children analysed in this review is 6630.
Our 2013 review, Schoonees 2013, included only studies conducted in Malawi (Ciliberto 2005; Manary 2004; Ndekha 2005; Oakley 2010). This review update includes an additional four studies from Malawi (Bahwere 2014; Hsieh 2015a; Hsieh 2015b; Kerac 2009), as well as four studies from India (Bhandari 2016; Jadhav 2016; Shewade 2013; Thapa 2017), and one study apiece from Zambia (Irena 2015), Kenya (Jones 2015), and Cambodia (Sigh 2018).
Overall, the duration of the intervention periods ranged from eight (Ciliberto 2005; Jadhav 2016; Oakley 2010; Sigh 2018; Thapa 2017) to 16 weeks (Bahwere 2014; Manary 2004). One trial, which only assessed acceptability, did not report the duration of the intervention (Hsieh 2015b), and two studies did not specify a maximum intervention duration (Irena 2015; Ndekha 2005). Only five studies followed up children after the intervention period (maximum of six months), and generally reported on a limited number of outcomes (Bhandari 2016; Ciliberto 2005; Jadhav 2016; Manary 2004; Ndekha 2005).
The section below provides a list of the included studies grouped according to the comparison assessed. Further details are given in the Characteristics of included studies tables, as well as in Table 10 (Comparison 1), Table 11 (Comparison 2) and Table 12 (Comparison 3), which are based on the TIDieR table in Hoffmann 2017.
7. TIDieR table: Comparison 1.
| Study ID | Bhandari 2016 | Ciliberto 2005 | Jadhav 2016 | Manary 2004 | Ndekha 2005 | Shewade 2013 | Thapa 2017 |
| Study period and brief comparison | October 2012 ‐ April 2015 Commercially‐ and non‐commercially produced S‐RUTF compared to energy‐dense, micronutrient‐enriched, locally available, home‐prepared foods. | December 2002 ‐ June 2003. S‐RUTF, commercially produced, versus maize/soy flour prepared by caregivers as a porridge. | March 2011‐June 2013. S‐RUTF, non‐commercially produced, versus locally available, home‐prepared foods high in energy and protein. | January‐October 2001. S‐RUTF, factory produced, compared to caregiver‐prepared flour porridge (made from a maize and soy flour blend). | January‐September 2001. S‐RUTF, factory produced, compared to caregiver‐prepared flour porridge (made from a maize and soy flour blend). | 2011. S‐RUTF, non‐commercially produced, "supplementary nutrition" (quote) and nutrition counselling versus "supplementary nutrition" (quote) and nutrition counselling. | August 2013‐March 2014. S‐RUTF, non‐commercially produced, versus locally available foods precooked and packaged non‐commercially and prepared at home by caregivers. |
| Why? | Non‐commercially produced RUTF may be less expensive and more sustainable in some countries. | To investigate whether home‐based therapy with RUTF results in higher rates of recovery and lower rates of relapse or death than the (then) standard therapy in Malawi. | There is a need in India for "indigenously" (quote) produced RUTF. To investigate the efficacy of such RUTF in children with SAM when compared to "standard nutritional therapy" (quote). |
At the time the study started, the WHO recommended inpatient therapy until recovery for the treatment of children with SAM. For many families this was not feasible. To investigate the effects of home‐based RUTF compared to ample amounts of the local staple food (porridge) in HIV‐uninfected children with SAM. |
At the time the study started, the WHO recommended inpatient therapy until recovery for the treatment of children with SAM. For many families this was not feasible. To investigate the effects of home‐based RUTF compared to ample amounts of the local staple food (porridge) in HIV‐infected children (not on ARV) with SAM. |
To investigate the effectiveness of RUTF in therapeutic doses in community‐based management of uncomplicated SAM. | There is a need in India for "indigenously" (quote) produced RUTF equivalent to the WHO RUTF recommendations. The study authors carried out a preliminary study to investigate the acceptance and efficacy of such a RUTF among SAM children in informal settlements in India. |
| What educational materials were provided to caregivers? | Government trained health educators and promoters visited families weekly, and used site‐specific counselling cards (of which the families received copies) in the local language to convey messages regarding frequency, amount and how to feed the study foods; as well as on continuing breastfeeding, good hygiene and advice on family meals. | Not reported. | All caregivers were counselled about nutritional requirements and good feeding practices. However, it is unclear who performed the counselling and whether caregivers received educational material. | Not reported. | Not reported. | Children in both groups received weekly feeding counselling at the OTP site. Unclear if caregivers received counselling material. Study staff were 2 medical doctors, 1 social worker and "anganwadi workers" (quote) (community health workers); it is unclear who performed the nutrition counselling. | All study staff (2 nutritionists, 2 anthropometrists, 3 technical assistants, 3 "lady health workers" (quote), and "4 other helpers" (quote)) were trained regarding all aspects of the study. They were also instructed to guide the caregivers (of children in both groups) regarding the schedule, method and hygienic conditions of feeding; and the cooking of the control intervention to the relevant caregivers. It is unclear whether caregivers were provided with educational material. |
| What procedures? | Children with SAM and without complications, or those with complications but who were stabilised first in hospital, were eligible. Follow‐up of those who dropped out of the study was not reported. However, health workers, peer supporters and community leaders were involved in the study and thus tracing of and motivating those who dropped out of the study was probably done. Health workers referred sick children, those whose WHZ did not improve in 4 weeks, and children who deteriorated for 2 consecutive weeks to physicians. Children with severe illness were admitted to hospital, and the study intervention was restarted after the child returned home. |
All children from the maize/soy flour group and less than half of children from the RUTF group were stabilised in hospital pre‐trial. Children who failed to attend their follow‐up visits (3 weeks after their previous visit) were sought through local village health workers, to determine whether the child had died or relapsed. Children who relapsed exited the study and were treated as in‐patients. |
All children were hospitalised for 2 weeks or longer based on their complications. Study staff did not carry out regular home visits, and it is not reported whether children who were lost to follow‐up were traced. It is also unclear whether children who deteriorated stayed in the study and were admitted to hospital. |
Children with SAM were eligible, after they were stabilised as inpatients. Study staff did not make home visits; children who were lost to follow‐up were not traced at home. Children who deteriorated were admitted to hospital. |
Children with SAM were eligible, after they were stabilised as inpatients. Study staff did not make home visits; children who got lost to follow‐up were not traced at home. Children who deteriorated were admitted to hospital. |
Children with SAM and without complications were eligible. Children who missed their weekly appointment at the OTP were followed up at their homes by Anganwadi workers. Children with complications were referred to inpatient care. | Children with SAM and without complications were eligible. It appears as if no children were lost to follow‐up, and that no children were admitted to hospital for complications. |
| Who provided the intervention? | Trained health educators dispensed RUTF, and families of children in the comparison group were given raw ingredients to prepare foods. Caregivers at home fed the children, but neighbourhood peer support workers visited homes (of children across all 3 groups) several times a day to help caregivers feed their children. |
It is unclear who dispensed the RUTF to caregivers. The maize/soy flour was given in one 50 kg bag to caregivers. The flour intervention was supplemented with micronutrients. Caregivers at home fed their children. |
Not explicitly reported, but it seems as if RUTF was dispensed at the NRU. It is not clear who dispensed the RUTF or who dispensed the ingredients for the control diet. After hospital discharge, caregivers fed their children at home. |
It is not reported who dispensed the study interventions to the caregivers. Caregivers of children in the maize and soy flour group also received a micronutrient supplement to give to their children daily. Caregivers fed their children at home. |
It is not reported who dispensed the study interventions to the caregivers. Caregivers of children in the maize and soy flour group also received a micronutrient supplement to give to their children daily. Caregivers fed their children at home. |
The RUTF dose per child was prescribed by a doctor and dispensed by study staff (including Anganwadi workers) at the OTP. Caregivers fed their children at home. |
Daily, caregivers fed their children at home under supervision of nutritionists and "lady health visitors" (quote). Mothers were asked to feed their child as much as they could eat over half an hour. In both groups, nutritionists weighed the amount of food children needed to take daily. |
| How was the intervention provided? | Weekly, an independent trained team measured children's weight, height, MUAC, skinfold thickness and assessed for oedema on feet. It is not explicitly reported, but it seems that these measurements were done at the children's homes and not at a health facility's outpatient department. | Every 2 weeks, children were assessed at the NRU. Weight, length and MUAC were measured. It is unclear who did the measurements. | It is unclear whether anthropometrical measurements (weight, length/height and MUAC) were done weekly or biweekly, and by whom. | Every 2 weeks, caregivers and children had to visit the outpatient department for anthropometrical measurements (weight, statural growth and MUAC) and "health assessment" (quote) ‐ it is unclear who performed these assessments. | Every 2 weeks, caregivers and children had to visit the outpatient department for anthropometrical measurements (weight, statural growth and MUAC) and "health assessment" (quote) ‐ it is unclear who performed these assessments. | Weekly, at the OTP, the social worker measured the children's weight, length/height and MUAC. | Weight was measured daily by "anthropometrists" (quote) at the children's homes. It is unclear how often measurements of length/height and MUAC were taken. |
| Intervention setting | 3 diverse geographical settings in India, with a mix of rural and urban areas. The study populations were low‐income households, and most study activities took place at the families' homes. | The participating NRUs were mission and public facilities in small towns and rural areas of southern Malawi. | The study was conducted at an urban health centre associated with a tertiary hospital in Mumbai, India. Most participants were from lower socio‐economic status backgrounds due to the centre's close proximity to a very large informal settlement. | Outpatients to NRU at the teaching hospital in Blantyre, Malawi. | Outpatients to NRU at the teaching hospital in Blantyre, Malawi. | OTP site at an urban health and training centre near a densely populated urban resettlement colony in Chandigarh, India. | 3 informal settlements in North India. Most study activities took place at the families' homes. |
| When and how much? | In all groups, 175 kCal/kg/day of the interventions were dispensed weekly until recovery or a maximum of 16 weeks. | RUTF provided as 175 kCal/kg/day and dispensed every 2 weeks until recovery or a maximum of 8 weeks. The control group were told to consume the flour porridge 7 times a day (portion sizes not reported). | Once weekly, children across groups received their dietary intervention at 175 kCal/kg/day for 8 weeks. | The interventions were dispensed every 2 weeks, with the RUTF at 733 kJ/kg/day and the maize and soy flour blend at 2400 g raw product/day. Caregivers were instructed to feed the RUTF over the course of the day, while those in the control group were instructed to feed their children porridge 7 times/day, with the aim of reaching 1500 g of cooked porridge (about 733 kJ/kg/day) daily. | The interventions were dispensed every 2 weeks, with the RUTF at 733 kJ/kg/day and the maize and soy flour blend at 2400 g raw product per day. Caregivers were instructed to feed the RUTF over the course of the day, while those in the control group were instructed to feed their children porridge 7 times a day, with the aim of reaching 1500 g of cooked porridge (about 733 kJ/kg/day) daily. | Children in the experimental group received RUTF at 200 kCal/kg/day weekly, in addition to "nutritional supplementation" (quote) of 500 kcal and 12‐15 g protein per day, which all children received. | Both diets were dispensed daily. The RUTF provided 2280 kJ/100 g, with protein 15.7% of product, while the control diet provided from 1556 kJ to 1887 kJ/100 g, with protein from 6.8% to 13.6% of product. Children from both groups could consume as much as they wanted, and were offered the foods 6 times/day. |
| Tailoring? | No adjustment of the RUTF dose reported. | No adjustment of the RUTF dose reported. | No adjustment of the RUTF dose reported. | No adjustment of the RUTF dose reported. | No adjustment of the RUTF dose reported. | No adjustment of the RUTF dose reported. | No adjustment of the RUTF dose reported. |
| Modifications of intervention throughout the trial? | In the original protocol, the intervention duration was set at 8 weeks. However, after 20 children were enrolled and an independent Data Safety Monitoring Board reviewed their results, they recommended that the intervention period be extended for another 8 weeks. | Not reported. | Not reported. | Not reported. | Not reported. | Not reported. | The intervention foods were continued for 6 weeks. Since these were liked by the children, these were extended for 2 weeks more" (quote). |
| Strategies to improve/maintain intervention fidelity | Consumption data for children in the 2 RUTF groups were collected weekly by trained health educators, as were the amounts of ingredients used for children in the control group. The total amount of calories consumed could only be estimated for the RUTF groups. Study authors reported that, in addition to providing the diets, extra support for feeding seems important in their setting. Enhanced engagement and sharing of skills of local, experienced women (peer supporters) seemed to improve children's food intake. |
Not reported. | The intake of RUTF, but not the control diet, was monitored. However, detail regarding this was not reported. | No measurements of home dietary intake were conducted. | No measurements of home dietary intake were conducted. | It is unclear what the children's adherence to the "nutritional supplementation" (quote) was, which both groups received. "Objective assessment of RUTF compliance was done by noting down the amount of RUTF consumed in previous week" (quote). However, it is unclear who of the study staff collected data on RUTF adherence. |
Daily, after the meals, study staff (presumably nutritionists as they weighed the portions for the meals) weighed the leftover food. The amount of food consumed daily was then estimated and recorded. Intake of energy and protein was calculated from the amount of food eaten daily, throughout the study period. |
| Extent of intervention fidelity | Quote: "The mean (SD) amount of RUTF‐L [con‐commercial] consumed was 193.27 (94.03) g/day and RUTF‐C [commercial] 172.83 (89.10). The mean (SD) kcal/kg/day consumed was 140.19 (65.41) and 129.69 (65.09), respectively. Consumption was not measured in the A‐HPF [control] group" | Adherence results not reported. | Adherence results not reported. | Not measured. | Not measured. | Adherence results not reported. | The study authors reported that children in the RUTF group consumed significantly more food, energy and protein in comparison to the control group (P < 0.001). |
A‐HPF: augmented energy‐dense home‐prepared foods; ARV: antiretroviral therapy; MUAC: mid‐upper arm circumference; NRU: Nutritional Rehabilitation Unit; OTP: outpatient therapeutic programme; RUTF: Ready‐to‐use therapeutic food; RUTF‐C: commercially produced ready‐to‐eat therapeutic food; RUTF‐L: locally produced ready‐to‐eat therapeutic food; S‐RUTF: standard ready‐to‐use therapeutic food; SAM: severe acute malnutrition; SD: standard deviation; WHO: World Health Organization; WHZ: weight‐for‐height z score
8. TIDieR table: Comparison 2.
| Study ID | Manary 2004 | Ndekha 2005 |
| Study period and brief comparison | January‐October 2001. S‐RUTF (factory‐produced), at a dose that met total daily nutritional requirements compared to a similar RUTF given as a supplement to the habitual diet. |
January‐September 2001. S‐RUTF (factory‐produced) compared to caregiver‐prepared flour porridge (made from a maize and soy flour blend). |
| Why? | At the time the study started, the WHO recommended inpatient therapy until recovery for the treatment of children with SAM. For many families this was not feasible. The study sought to investigate the effects of home‐based RUTF compared to a similar RUTF but given as a supplement in HIV‐uninfected children with SAM. |
At the time the study started, the WHO recommended inpatient therapy until recovery for the treatment of children with SAM. For many families this was not feasible. The study sought to investigate the effects of home‐based RUTF compared to a similar RUTF but given as a supplement in HIV‐infected children (who were not on ARV therapy) with SAM. |
| What educational materials were provided to caregivers? | Not reported. | Not reported. |
| What procedures? | Children with SAM were eligible for intervention after they were stabilised as inpatients. Study staff did not make home visits; children who were lost to follow‐up were not traced at home. Children who deteriorated during the study were admitted to hospital. |
Children with SAM were eligible for intervention after they were stabilised as inpatients. Study staff did not make home visits; children who got lost to follow‐up were not traced at home. Children who deteriorated during the study were admitted to hospital. |
| Who provided the intervention? | It is not reported who dispensed the study interventions to the caregivers. Caregivers fed their children at home. |
It is not reported who dispensed the study interventions to the caregivers. Caregivers fed their children at home. |
| How was the intervention provided? | Every 2 weeks, caregivers and their children had to visit the outpatient department for anthropometrical measurements (weight, statural growth and MUAC) and "health assessment" (quote) ‐ it is unclear who performed these assessments. | Every 2 weeks, caregivers and their children had to visit the outpatient department for anthropometrical measurements (weight, statural growth and MUAC) and "health assessment" (quote) ‐ it is unclear who performed these assessments. |
| Intervention setting | Outpatients of the NRU at the teaching hospital in Blantyre, Malawi. | Outpatients of the NRU, at the teaching hospital in Blantyre, Malawi. |
| When and how much? | The interventions were dispensed every 2 weeks, with the RUTF at 733 kJ/kg/day and the RUTF supplement at 2090 kJ/day (about 92 g per child). Caregivers in the RUTF group were instructed to feed the RUTF over the course of the day, while those in the RUTF supplement group were instructed to give their children the RUTF in addition to their usual diet daily. | The interventions were dispensed every 2 weeks, with the RUTF at 733 kJ/kg/day and the RUTF supplement at 2090 kJ/day (about 92 g per child). Caregivers in the RUTF group were instructed to feed the RUTF over the course of the day, while those in the RUTF supplement group were instructed to give their children the RUTF in addition to their usual diet daily. |
| Tailoring? | No adjustment of the RUTF dose reported. | No adjustment of the RUTF dose reported. |
| Modifications of intervention throughout the trial? | Not reported. | Not reported. |
| Strategies to improve/maintain intervention fidelity | No measurements of home dietary intake were conducted. | No measurements of home dietary intake were conducted. |
| Extent of intervention fidelity | Not measured. | Not measured. |
ARV: antiretroviral therapy; MUAC: mid‐upper arm circumference; NRU: Nutritional Rehabilitation Unit; RUTF: Ready‐to‐use therapeutic food; S‐RUTF: standard ready‐to‐use therapeutic food; SAM: severe acute malnutrition; WHO: World Health Organization
9. TIDieR table: Comparison 3.
| Study ID | Bahwere 2014 | Hsieh 2015a | Irena 2015 | Jones 2015 | Kerac 2009 | Oakley 2010 | Sigh 2018 |
| Study period and brief comparison | March 2010‐March 2011RUTF prepared from whey protein concentrate versus S‐RUTF (prepared from dried skimmed milk). | January‐May 2014RUTF with high oleic acid content versus S‐RUTF. | June 2009‐August 2010Milk‐free soy‐maize‐sorghum based RUTF versus S‐RUTF. | June 2012‐July 2013RUTF with elevated omega‐3 fatty acids versus S‐RUTF. | July 2006‐March 2007RUTF with added pre‐ and probiotics versus S‐RUTF. | July 2008‐April 2009RUTF containing 10% milk with soy versus S‐RUTF (25% milk). | September 2015‐January 2017Fish‐based RUTF versus S‐RUTF (BP100). |
| Why? | Dried skimmed milk is the most expensive component of RUTF. This study assessed the effectiveness of a RUTF using whey protein (a cheaper alternative) instead. | This study assessed the effect of a RUTF with high oleic acid content on plasma DHA and eicosapentaenoic acid status. | The milk content of S‐RUTF increases the cost. The use of alternative sources of protein will reduce the cost of RUTF. | Current RUTF formulations do not provide significant ALA or omega‐3 long chain polyunsaturated fatty acids. Previous studies have found low omega‐3 fatty acids levels in children recovering from SAM. | Probiotics and prebiotics may be of benefit in SAM by correcting dysbiosis and improving intestinal function. | Milk is the most expensive component of RUTF. Reducing the milk content will reduce the cost of the RUTF. | There is low acceptability in Cambodia for the S‐RUTF Plumpy'nut® ; therefore, this study assessed the effects of RUTF made with locally‐available fish. |
| What educational materials were provided to caregivers? | Health and nutrition advice was provided once after enrolment in the study; unclear by whom and if materials were provided. | “…focused nutritional counselling and instructions on therapeutic feeding were provided by the nurses” (quote). Nurses were “experienced pediatric nutrition nurses” (quote). It is unclear if materials were provided to caregivers. | Health and nutrition advice was provided as a one‐off after enrolment in the study; unclear by whom and if materials were provided. | Caregivers were told that no food should be consumed during the treatment period other than the RUTF or breast milk. It is unclear who conveyed this information to caregivers, and whether materials were provided. | Not reported. | Senior research nurses gave instruction on the administration and importance of RUTF, that no other foods were required and that the RUTF must not be mixed or diluted with porridge. It is unclear if this was done as a one off or regularly, and whether materials were provided. | Caregivers received general health and nutrition advice; unclear by whom and if materials were provided. |
| What procedures? | Children with SAM and without complications, or those with complications but who were stabilised first in hospital, were eligible. Defaulters (absent for 3 consecutive visits) were followed up by trained volunteers and invited back into the study. Children whose condition deteriorated as outpatients were referred to inpatient care. |
No children were stabilised in hospital before the study. Nothing reported on whether defaulters were traced or whether children with complications were referred to inpatient care. | No children were stabilised in hospital before the study. Defaulters (absent for 3 consecutive visits) were followed up and invited back into the programme by trained volunteers. SAM children with complications were referred to inpatient care. |
Children with SAM and without complications, or those with complications but who were stabilised first in hospital, were eligible. Participants’ homesteads were mapped and defaulters (definition not provided) were traced in the community. Participants who required ongoing inpatient care were reviewed by a member of the study team daily until discharge to the outpatient programme. |
All children were stabilised in hospital with F‐75 for 2‐4 days and started RUTF as rehabilitation in hospital. Upon easily finishing at least 75% of their daily RUTF, they were discharged to continue rehabilitation at home. Defaulters (having missed 2 consecutive outpatient visits) were followed up by a mobile team. | No children were stabilised in hospital before the study. Children who remained wasted after 4 visits, or clinically worsened during outpatient treatment, were referred for inpatient care. | Children with SAM and without complications, or those with complications but who were stabilised first in hospital, were eligible. Nothing reported on whether defaulters were traced. Participants who refused to eat the RUTF for > 4 days/week over 2 consecutive weeks or who lost weight during 2 consecutive visits were excluded from the trial. Participants received an incentive after finishing the trial. |
| Who provided the intervention? | Unclear who among the study staff (trained study nurses, nurses, CHW) dispensed the RUTF to caregivers. Caregivers fed their children at home. |
Unclear who dispensed the RUTF to caregivers. Caregivers fed their children at home. |
Unclear who among the study staff dispensed the RUTF to caregivers. Caregivers fed their children at home. |
Unclear who among the study staff dispensed the RUTF to caregivers. Caregivers fed their children at home. |
Unclear who among the study staff dispensed the RUTF to caregivers. Caregivers fed their children at home. |
RUTF was distributed by field assistants. Senior research nurses instructed caretakers on amount to feed. Caregivers fed their children at home. |
Study staff were a combination of trained doctors, nurses, midwives and Masters in nutrition students, but it is unclear who dispensed the RUTF to caregivers. Caregivers fed their children at home. |
| How was the intervention provided? | Weekly visits to the outpatient department. MUAC, oedema and weight were recorded and children were screened for medical problems, including appetite and RUTF side effects. | Fortnightly visits to the outpatient department. Anthropometrical measurements were taken, and caregivers were asked about their child’s health status. | Weekly visits to the outpatient department. MUAC, oedema and weight were recorded and children were screened for medical problems, including appetite and RUTF side effects. | Weekly visits to the outpatient department during the first month, and monthly visits for the second and third month of the intervention period. MUAC, weight and length/height were probably measured. Monitoring for side effects or adverse events was conducted at all scheduled and unscheduled visits. (No information on unscheduled visits was reported.) |
In hospital, trained staff used a pre‐piloted, standardised questionnaire to obtain caregiver‐reported clinical outcome indicators of children. During outpatient rehabilitation, this was collected at each 2‐weekly visit. | Fortnightly visits to the outpatient department. Weight, length/height and MUAC were measured, and children were assessed for oedema. Caregivers were asked how many days in the last 2 weeks the child had had fever, cough, and diarrhoea. | Fortnightly visits to the outpatient department; “all anthropometrical measures and oedema were assessed” (quote) and children were also screened for medical complications, including possible side effects of the RUTFs. |
| Intervention setting | Outpatient treatment programmes in central Malawi. | Outpatient treatment programme in rural, southern Malawi. | Outpatient treatment programmes around Lusaka, Zambia. | An outpatient treatment programme at a hospital in coastal Kenya, where the majority of the community is involved in rural subsistence farming. | Inpatient and outpatient programmes in a large, urban teaching and referral hospital in Malawi. | Outpatient treatment programme in rural, southern Malawi. | At the national paediatric hospital in Cambodia and its outpatient programme. |
| When and how much? | RUTF provided at 175 kCal/kg and dispensed weekly until recovery or maximum 4 months of intervention. | RUTF provided at 175 kCal/kg/day (735 kJ/kg/day) and dispensed every 2 weeks until recovery or a maximum of 12 weeks. | RUTF provided at 200 kCal/kg/day and dispensed every week until recovery (no maximum intervention period specified). | RUTF provided as per national Kenyan guidelines and dispensed once a week for the first month and then once a month for the other 2 months until recovery or a maximum of 84 days. Children who recovered before day 84 were given 50% of the therapeutic dose (to be taken alongside family foods) until day 84. | RUTF provided at 200 kCal/kg/day and dispensed every second week until recovery or a maximum of 5 visits (about 10 weeks). | RUTF provided as 175 kCal/kg/day and dispensed every 2 weeks until recovery or a maximum of 8 weeks. | RUTF provided at 160‐180 kCal/kg/day and dispensed every 2 weeks until recovery or a maximum of 8 weeks. |
| Tailoring? | No adjustment of the RUTF dose reported. | No adjustment of the RUTF dose reported. | No adjustment of the RUTF dose reported. | If the child was still hungry, additional RUTF was offered. | No adjustment of the RUTF dose reported. | No adjustment of the RUTF dose reported. | No adjustment of the RUTF dose reported. |
| Modifications of intervention throughout the trial? | None reported. | None reported. | None reported. | In May 2013, provision of all study RUTF was stopped due to peroxidation of the control group's F‐RUTF. The children who were still on RUTF at that time were switched to S‐RUTF supplied by Kenya's Ministry of Health. All of these participants were followed up for the full study duration and included in the intention‐to‐treat analyses. | None reported. | None reported. | If children did not eat the RUTF to which they were assigned, they were offered the alternative RUTF. This happened in both groups, with 2/61 children from the experimental group and 1/60 child from the control group. |
| Strategies to improve/maintain intervention fidelity | Caregivers were interviewed at each visit on the acceptability of the RUTF, and whether the child had eaten a RUTF formulation other than the one that they had been allocated. | Twins were given a RUTF ration to limit sharing. Also, where there were study participants from the same household, they received the same food to prevent contamination of the allocated RUTF. At every visit, caregivers were asked about their child’s feeding habits (no more detail provided). |
Caregivers were interviewed at each visit on the acceptability of the RUTF, and whether the child had eaten a RUTF formulation other than the one that they had been allocated. | Adherence was monitored by interviews with caregivers and counting full and empty sachets of RUTF. Adherence was calculated according to “'full ration’ taking account of the participant’s weight and stage of treatment” (quote). | Caregivers reported on adherence and non‐sharing to trained staff. | Twins were given a RUTF ration to limit sharing. Children with MAM from the same household were given the same food as the SAM child. Also, where there were study participants from the same household, they received the same food to prevent contamination of the allocated RUTF. It is unclear if information on participant adherence was collected. | Caregivers were asked to bring the remaining RUTF to each visit, to check for adherence. |
| Extent of intervention fidelity | Adherence results not reported. | Adherence results not reported. | 43 children switched from the SMS‐RUTF (control) to the P‐RUTF (S‐RUTF, experimental) arm. No children switched from P‐RUTF to SMS‐RUTF. The amount of RUTF consumed (adherence results) was not measured. | The median compliance on day 84 was 90% (range 80‐101) in the experimental arm and 96% (range 67‐100) in the control arm. | Adherence results not reported. | Adherence results not reported. | The mean utilisation of RUTF was 51.7% in the experimental arm and 48.1% in the control arm. Upon questioning, 41% of caregivers in the experimental arm versus 27% in the control arm reported they had either sold, given away, thrown away, lost the RUTF, or that it was eaten by animals. |
ALA: alpha‐linolenic acid; BP100: solid biscuit made from cooked wheat; CHW: community health workers; DHA: docosahexaenoic acid; F‐RUTF: flax‐seed containing ready‐to‐use therapeutic food; MAM: Moderate acute malnutrition; MUAC: mid‐upper arm circumference; P‐RUTF: standard peanut‐based ready‐to‐eat therapeutic food; RUTF: Ready‐to‐use therapeutic food; S‐RUTF: standard ready‐to‐use therapeutic food; SAM: severe acute malnutrition; SMS‐RUTF: milk‐free soy‐maize‐sorghum‐based ready‐to‐use therapeutic food
Comparison 1: standard RUTF provided at a dose that meets total daily nutritional requirements versus an alternative dietary approach
We included seven studies in this comparison (Bhandari 2016; Ciliberto 2005; Jadhav 2016; Manary 2004; Ndekha 2005; Shewade 2013; Thapa 2017).
Bhandari 2016: an individually randomised, controlled trial, with 906 children aged 6 to 59 months in India. The study compared a standard peanut‐ and milk‐based RUTF in two arms (one factory‐produced and one produced in an institution kitchen) to caregiver‐prepared, locally available foods (with energy‐dense and nutrient‐rich recipes).
Ciliberto 2005: a stepped‐wedge design (which we treated as a cluster, quasi‐randomised trial) with children aged between 10 and 60 months in Malawi. Of the 1178 children that were randomised, 645 had SAM, with an effective sample size of 352. The study compared a standard peanut‐ and milk‐based RUTF (factory‐produced) to F‐100 (start of rehabilitation as inpatients) and a caregiver‐prepared flour porridge (maize and soy flour blend) at home.
Jadhav 2016: an individually randomised, controlled trial with 321 children aged six months to five years in India. The study compared a standard peanut‐ and milk‐based RUTF (produced in an institution kitchen) to an energy‐dense and high protein diet from locally available foods (prepared in a hospital kitchen during admission, and by caregivers at home after discharge).
Manary 2004: a cluster, quasi‐randomised trial of 186 children (effective sample size = 182) older than 12 months of age who were not infected with HIV (HIV‐uninfected) in Malawi. The study compared a standard peanut‐ and milk‐based RUTF (factory‐produced) to a caregiver‐prepared flour porridge (maize and soy flour blend) at home.
Ndekha 2005: a cluster, quasi‐randomised trial of 65 children (effective sample size = 65) aged between 12 and 60 months who were infected with HIV (HIV‐infected) in Malawi. The study compared a standard peanut‐ and milk‐based RUTF (factory‐produced) to a caregiver‐prepared flour porridge (maize and soy flour blend) at home.
Shewade 2013: an individually randomised, controlled trial with 26 children aged six months to five years in India. Each of the two groups received the same care (anthropometry, case management, feeding counselling, supplementary nutrition), but the experimental group also received a standard peanut‐ and milk‐based RUTF produced in an institution kitchen.
Thapa 2017: an individually randomised, controlled trial with 112 children aged six months to five years in India. The study compared a standard peanut‐ and milk‐based RUTF (produced in an institution kitchen) to caregiver‐prepared, precooked, locally available foods.
Comparison 2: standard RUTF provided at a dose that meets total daily nutritional requirements versus as a supplement to the usual diet
We included two studies in this comparison (Manary 2004; Ndekha 2005).
Manary 2004 and Ndekha 2005: these are the same studies reported under Comparison 1, except for this Comparison, we used the RUTF and RUTF supplement groups in our analyses. The studies used similar RUTF products but in different portions.
Comparison 3: standard RUTF versus RUTF using an alternative formulation
We included eight studies in this comparison (Bahwere 2014; Hsieh 2015a; Hsieh 2015b; Irena 2015; Jones 2015; Kerac 2009; Oakley 2010; Sigh 2018).
Bahwere 2014: an individually randomised, controlled trial of 600 children aged 6 to 59 months in Malawi. The study compared a standard milk‐based RUTF (peanuts; factory‐produced) to a RUTF containing whey protein (factory‐produced).
Hsieh 2015a: an individually randomised, controlled trial of 141 children aged between six months and five years in Malawi. The study compared a standard milk‐based RUTF (peanuts; factory‐produced) to a RUTF containing high oleic fatty acids (factory‐produced).
Hsieh 2015b: an individually randomised, controlled trial of 148 children aged between six months and five years in Malawi. The study compared a standard milk‐based RUTF (peanuts; factory‐produced) to a RUTF containing high oleic fatty acids (factory‐produced).
Irena 2015: a cluster‐RCT of 1927 children (effective sample size = 881) across 12 clusters and aged between 6 and 60 months in Zambia. The study compared a standard milk‐based RUTF (peanuts; factory‐produced) to a RUTF containing soy, maize and sorghum (factory‐produced).
Jones 2015: an individually randomised, controlled trial of 61 children aged between 6 and 60 months in Kenya. The study compared a standard milk‐based RUTF (peanuts; factory‐produced) to a RUTF containing flax seed oil (factory‐produced).
Kerac 2009: an individually randomised, controlled trial with 795 children aged between 5 and 168 months in Malawi. The study compared a standard milk‐based RUTF (peanuts; factory‐produced) to a RUTF containing pre‐ and probiotics (factory‐produced).
Oakley 2010: an individually randomised, controlled trial of 1874 children aged between 6 and 59 months in Malawi. The study compared a standard milk‐based RUTF (peanuts; factory‐produced) to a RUTF containing only 10% milk and soy flour (factory‐produced).
Sigh 2018: an individually randomised, controlled trial of 121 children aged between 6 to 59 months in Cambodia. The study compared a standard milk‐based RUTF (cereal; factory‐produced) to a RUTF containing locally available fish, mung beans, rice, soybeans and rice flour (factory‐produced).
Although Kerac 2009 was published in 2009, and we identified it in our earlier search, we did not include it in the original review (Schoonees 2013), because the abstract specified that the study included children aged 5 to 168 months, and we rejected the study during the titles and abstracts screening stage. For this review update, we obtained the full‐text article for this study and determined that the majority of the children were in the six‐month‐to‐five‐year age group, and that the study authors had done a separate analysis for this group.
Subgroup analyses
With the exception of one study (Hsieh 2015b), we were able to use data from our included studies to conduct four of our five, preplanned subgroup analyses (Schoonees 2011).
Pre‐trial hospital stabilisation versus no pre‐trial hospitalisation
We conducted an analysis of the following subgroups for Comparisons 1 and 3 using data from 14 studies (Bahwere 2014; Bhandari 2016; Ciliberto 2005; Hsieh 2015a; Irena 2015; Jadhav 2016; Jones 2015; Kerac 2009; Manary 2004; Ndekha 2005; Oakley 2010; Shewade 2013; Sigh 2018; Thapa 2017).
-
All participants received in‐hospital stabilisation before study enrolment
Comparison 1: three studies (Jadhav 2016; Manary 2004; Ndekha 2005)
Comparison 3: one study (Kerac 2009)
-
Some of the participants received in‐hospital stabilisation before study enrolment
Comparison 1: two studies (Bhandari 2016; Ciliberto 2005)
Comparison 3: three studies (Bahwere 2014; Jones 2015; Sigh 2018)
-
No pre‐trial inpatient stabilisation occurred
Comparison 1: two studies (Shewade 2013; Thapa 2017)
Comparison 3: three studies (Hsieh 2015a; Irena 2015; Oakley 2010)
Commercial (i.e. factory) versus non‐commercial (i.e. institution kitchen) RUTF
We conducted an analysis of the following subgroups for Comparison 1 using data from six studies (Ciliberto 2005; Jadhav 2016; Manary 2004; Ndekha 2005; Shewade 2013; Thapa 2017).
-
Factory‐produced RUFT
Comparison 1: three studies (Ciliberto 2005; Manary 2004; Ndekha 2005)
-
Local site‐kitchen‐produced RUFT
Comparison 1: three studies (Jadhav 2016; Shewade 2013; Thapa 2017)
Different types of RUTF products (for example, corn and soy‐based versus peanut‐based RUTF)
We conducted an analysis of the following subgroups for Comparison 3 using data from seven studies (Bahwere 2014; Hsieh 2015a; Irena 2015; Jones 2015; Kerac 2009; Oakley 2010; Sigh 2018).
Studies where the control RUTF contained less or no milk powder: four studies (Bahwere 2014; Irena 2015; Oakley 2010; Sigh 2018)
Studies where the control RUTF contained specific fatty acids: two studies (Hsieh 2015a; Jones 2015)
Studies where the control RUTF contained pre‐ and probiotics: one study (Kerac 2009)
Age of children: 6 to 12 months
The data from the included studies did not allow subgroup analyses of age.
Children with or without comorbid disease (for example, HIV/AIDS, TB)
We conducted an analysis of the following subgroups for Comparisons 1 and 2 using the data from four studies (Bhandari 2016; Ciliberto 2005; Manary 2004; Ndekha 2005).
-
HIV‐uninfected or untested children
Comparison 1: three studies (Bhandari 2016; Ciliberto 2005; Manary 2004)
Comparison 2: one study (Manary 2004)
-
HIV‐infected children
Comparison 1: one study (Ndekha 2005)
Comparison 2: one study (Ndekha 2005)
Sensitivity analysis
With the exception of one study (Hsieh 2015b), we were able to use data from our included studies to conduct our preplanned sensitivity analyses (Schoonees 2011).
Study quality (using low risk of bias in selection bias, attrition bias, and other bias as marker of quality)
We conducted sensitivity analyses for Comparisons 1 and 3 using data from five studies (Bahwere 2014; Bhandari 2016; Jones 2015; Kerac 2009; Oakley 2010).
Comparison 1: one study (Bhandari 2016)
Comparison 3: four studies (Bahwere 2014; Jones 2015; Kerac 2009; Oakley 2010)
Study design (cluster trials versus individually randomised, controlled trials)
We conducted sensitivity analyses for Comparisons 1 and 2 using data from 14 studies (Bahwere 2014; Bhandari 2016; Ciliberto 2005; Hsieh 2015a; Irena 2015; Jadhav 2016; Jones 2015; Kerac 2009; Manary 2004; Ndekha 2005; Oakley 2010; Shewade 2013; Sigh 2018; Thapa 2017).
-
individually randomised, controlled trials
Comparison 1: four studies (Bhandari 2016; Jadhav 2016; Shewade 2013; Thapa 2017)
Comparison 3: six studies (Bahwere 2014; Hsieh 2015a; Jones 2015; Kerac 2009; Oakley 2010; Sigh 2018)
-
Cluster trials
Comparison 1: three studies (Ciliberto 2005; Manary 2004; Ndekha 2005)
Comparison 3: one study (Irena 2015)
Excluded studies
In total, we excluded 37 studies with reasons from this review; 22 studies from our 2013 review (Schoonees 2013), and a further 15 studies from this update (Ashraf 2017; Bahwere 2016; Bahwere 2017; Brown 2015; Choudhury 2018; CTRI/2013/02/003418; Dani 2017; Ige 2014; Malik 2016; Mallewa 2018; Manary 2013; Maust 2015; Nga 2013; Sato 2018; Wasnik 2012). The most common reasons for exclusion were that the study design was neither an RCT nor a quasi‐randomised trial (n = 10); the intervention was not RUTF (n = 8); the participant population was not eligible (n = 8); and ineligible comparisons (n = 8). In addition, one study included an ineligible participant population and had an ineligible comparison, one study was about prevention and not rehabilitation, and one registered trial entry that appeared eligible was never conducted due to a lack of funding. See the Characteristics of excluded studies tables.
Studies awaiting classification
In this update, we identified two studies that are awaiting classification (Huq 2013; Kaleem 2014).
Huq 2013 is a conference abstract of a study conducted in Bangladesh between 2009 and 2012. Detailed information about the interventions used (RUTF versus "rice‐lentils based traditional‐diets (khichuri and halwa") is not available. We emailed the study authors at least twice, requesting a copy of the full manuscript, but have yet to receive a response.
Kaleem 2014 is an individually randomised, controlled trial with 270 children aged 6 to 59 months in Pakistan, with three intervention groups: RUTF produced in a factory in France (n = 90), a "Homemade High Density Diet" (n = 90), and "Homemade High Density diet along with Micronutrient supplements" (n = 90). After careful consideration, we decided to place this study in the 'awaiting assessment' category, because the main results reported for the two relevant groups in our Comparison 1 were identical and we feel this unusual scenario requires further clarification. We also found a discrepancy in the article for weight gain, where slightly different results were provided in the table compared to text, and an instance where the percentage events had not been calculated correctly. We are engaging with the study author in order to clarify these findings.
See the Characteristics of studies awaiting classification tables.
Ongoing studies
In our 2013 review (Schoonees 2013), there were nine ongoing studies. Of these, four entries are now included in this review as Bhandari 2016 (CTRI/2012/10/003054 and NCT01705769), Irena 2015 (ISRCTN62376241) and Shewade 2013 (CTRI/11/12/002259). One ongoing study entry (NCT01785680) in our 2013 review has been excluded with its published record, Maust 2015, due to the study having had an ineligible study population and ineligible comparison. Regarding the other four ongoing studies from our 2013 review, we emailed the study authors to obtain available (published or unpublished) manuscripts (NCT00131417; NCT00941434; NCT01144806; NCT01634009). The author for NCT00131417 responded saying that the study had not yet been published, but an unpublished manuscript could be provided by September 2017. However, this has not yet been received after following up with the author again. Two studies have the same contact author, to whom we have sent repeated email requests for information, and who has not responded (NCT00941434; NCT01144806). The author of NCT01634009 informed us in 2017 that their "final analysis is ongoing" and that the researchers "may be able to share [the manuscript] after a couple of months"; however, we have not yet received it.
We identified six studies by searching trials registers in 2017 (CTRI/2014/09/004958; CTRI/2016/02/006656; ISRCTN30393230; ISRCTN50039021; NCT01331044; NCT03094247). The authors of four studies informed us that their studies are still ongoing (CTRI/2016/02/006656; ISRCTN30393230; ISRCTN50039021; NCT03094247). The author of NCT01331044 informed us that their manuscript is underway and will be available after peer review. We also contacted the author of CTRI/2014/09/004958 in October 2017, but did not receive a response at the time of publication. In our 2018 search, we found two additional ongoing studies (ISRCTN31143316; NCT03407326), for which the start dates in the trial registry entries are indicated as October 2017 and September 2018, respectively.
See Characteristics of ongoing studies tables.
Funding sources and conflicts of interest
Of our 15 included studies, six were linked to funding or donations from industry (Bahwere 2014; Ciliberto 2005; Jadhav 2016; Manary 2004; Ndekha 2005; Thapa 2017), one did not report the source of funding (Hsieh 2015b), and eight studies reported funding from non‐industry sponsors (Bhandari 2016; Hsieh 2015a; Irena 2015; Jones 2015; Kerac 2009; Oakley 2010; Shewade 2013; Sigh 2018).
One study declared a conflict of interest that was not industry‐linked (Bhandari 2016). Two studies declared that one or more authors have a link to industry (Bahwere 2014; Irena 2015), while two other studies reported that the authors have links to industry but declared no conflict of interest (Jones 2015; Kerac 2009). Six studies declared no conflict of interest (Ciliberto 2005; Hsieh 2015a; Jadhav 2016; Oakley 2010; Sigh 2018; Thapa 2017). The four remaining studies did not report on this matter (Hsieh 2015b; Manary 2004; Ndekha 2005; Shewade 2013).
Risk of bias in included studies
We have presented our judgements regarding the risk of bias in each of the included studies in the 'Risk of bias' tables beneath the Characteristics of included studies tables. We rated the overall risk of bias as high for six studies (Ciliberto 2005; Jadhav 2016; Manary 2004; Ndekha 2005; Sigh 2018; Thapa 2017), unclear for three studies (Hsieh 2015a; Hsieh 2015b; Irena 2015), and low for six studies (Bahwere 2014; Bhandari 2016; Jones 2015; Kerac 2009; Oakley 2010; Shewade 2013). Figure 3 and Figure 4 provide graphical summaries of the 'Risk of bias' assessments. For the four cluster studies, we have presented additional risk of bias information in Table 13.
3.
'Risk of bias' graph: review authors' judgements about each 'Risk of bias' item presented as percentages across all included studies
4.
'Risk of bias' summary: review authors' judgements about each 'Risk of bias' item for each included study
10. Additional assessment of risk of bias in included cluster‐randomised trials.
| Study ID | Recruitment bias | Baseline imbalance | Loss of clusters | Incorrect analysis | Comparability with individually‐randomised trials |
| Ciliberto 2005 |
Inadequate Being a stepped‐wedge design, recruitment occurred after sites were assigned a specific treatment. All children eventually ended up with RUTF, although the time point at which conversion from standard care to RUTF took place was unknown. The study authors recognised that recruitment bias was possible: "a source of bias might have been that a mother of a moderately malnourished child might have visited the NRU for screening when she heard that home‐based therapy was being offered" (quote). |
Unclear Baseline characteristics per intervention arm were reported, but similarities and differences between clusters were not mentioned. |
Adequate All randomised children were included in the analyses. |
Unclear The study authors did not adjust their analyses for clustering, but did provide sufficient information to allow us calculate and apply an estimated design effect. However, we are unsure how close to the truth the estimated ICC is. |
Adequate For the 4 most important outcomes, the findings of this trial are in line with that of the individually‐randomised trials. |
| Irena 2015 |
Inadequate Children were recruited after randomisation of clusters (healthcare clinics). The study authors indicate that recruitment bias may have resulted in greater numbers of children attending the S‐RUTF sites: “....preferential referral to or attendance at the sites of the P‐RUTF arm” (quote). |
Adequate The study authors reported "...that many important baseline characteristics, such [as] prevalence of oedema, average MUAC, the presence of diarrhoea and presence of dehydration, differed between the two arms" (quote). However, they performed multivariable analyses to assess the effect of these differences on the outcomes and found that these variables did not appear to interact with the outcomes. |
Adequate All randomised children were included in the analyses. |
Adequate The study authors adjusted for clustering in their multivariate analyses and provided the ICC that they used. We used this ICC to adjust the raw counts provided in the paper. |
Adequate For the 4 most important outcomes, the findings of this trial are in line with that of the individually‐randomised trials. |
| Manary 2004 |
Adequate The unit of systematic allocation was clusters, according to the day of discharge in the month. Children were recruited after discharge days and were allocated to a specific treatment. However, an independent doctor discharged the children without knowing which discharge days matched which treatment. Therefore, the risk of recruitment bias was minimised. |
Unclear Baseline characteristics per intervention arm were reported, but similarities and differences between children discharged on different days (i.e. clusters) were not mentioned. |
Adequate All randomised children were included in the analyses. |
Unclear The study authors did not adjust their analyses for clustering, but did provide sufficient information to calculate and apply an estimated design effect. However, we are unsure how close to the truth the estimated ICC is. |
Unclear The findings of this trial are in line with that of the individually randomised trial for the outcomes of 'recovery' and 'mortality', but not for the outcomes of 'relapse' and 'weight gain'. |
| Ndekha 2005 |
Adequate The unit of systematic allocation was clusters, according to the week of discharge. Children were recruited after the weeks of discharge were allocated to a specific treatment. However, an independent doctor discharged the children without knowing which discharge weeks matched which treatment. Therefore, the risk of recruitment bias was minimised. |
Unclear Baseline characteristics per intervention arm were reported, but similarities and differences between children discharged during different weeks (i.e. clusters) were not mentioned. |
Adequate All randomised children were included in the analyses. |
Unclear The study authors did not adjust their analyses for clustering, but did provide us with the number of clusters, which allowed us to calculate and apply an estimated design effect. However, we are unsure how close to the truth the estimated ICC is. |
Unclear For 3 of the 4 most important outcomes, the findings of this trial are in line with that of the individually randomised trial. However, the findings for the outcome of 'relapse' were different, but this could be due to factors other than the study design as all children in this trial were HIV‐infected. |
| ICC: intracluster correlation coefficient; MUAC: mid‐upper arm circumference; NRU: nutrition rehabilitation unit; RUTF: ready‐to‐use therapeutic food; S‐RUTF: standard ready‐to‐use therapeutic food | |||||
Allocation
Here, we refer to both the generation of the random allocation sequence and concealment of the allocation code.
We judged seven studies to be at low risk of selection bias (Bahwere 2014; Bhandari 2016; Jones 2015; Kerac 2009; Oakley 2010; Shewade 2013; Sigh 2018); three studies to be a high risk of selection bias as they were quasi‐randomised (Ciliberto 2005; Manary 2004; Ndekha 2005); and five studies to be at unclear risk of bias as they either did not report the method of sequence generation (Hsieh 2015a; Hsieh 2015b; Thapa 2017) or did not report adequate allocation concealment (Irena 2015; Jadhav 2016).
Blinding
Blinding of participants and personnel (performance bias)
We judged 13 studies at low risk of performance bias because the participants across groups received the same amount of contact time with study personnel: it is not likely that children in one group performed better because they received more care (Bahwere 2014; Bhandari 2016; Ciliberto 2005; Hsieh 2015a; Irena 2015; Jadhav 2016; Jones 2015; Kerac 2009; Manary 2004; Ndekha 2005; Oakley 2010; Shewade 2013; Sigh 2018). Also, for the eight studies in which blinding was not done, we judged that the outcome measurements in children were not likely to be influenced by the lack of blinding of caregivers and study personnel (Bhandari 2016; Ciliberto 2005; Irena 2015; Jadhav 2016; Manary 2004; Ndekha 2005; Shewade 2013; Sigh 2018).
For the two studies where acceptability was the main focus, we judged one, Thapa 2017, at high risk of performance bias and the other, Hsieh 2015b, at unclear risk. In these studies, if caregivers knew what intervention their child was getting, we feel they could have influenced children to eat more or less RUTF, based on their own taste preferences or perception of the product. In addition, Thapa 2017 did not perform blinding, while Hsieh 2015b reported 'double‐blinding' but did not explain how the blinding had been done.
Blinding of outcome assessment (detection bias)
Seven studies reported that outcome assessors were unaware of the intervention that the child received (Bahwere 2014; Bhandari 2016; Hsieh 2015a; Hsieh 2015b; Jones 2015; Kerac 2009; Oakley 2010). We rated three of these studies, which did not explain how blinding was ensured, at unclear risk of detection bias (Hsieh 2015a; Hsieh 2015b; Oakley 2010). We considered the remaining four studies to be at low risk of detection bias.
We judged the eight remaining studies to be at unclear risk of detection bias (Ciliberto 2005; Irena 2015; Jadhav 2016; Manary 2004; Ndekha 2005; Shewade 2013; Sigh 2018; Thapa 2017), as the outcome assessors were not blinded and the majority of the primary and secondary outcomes were dependent on physical anthropometric measurements by outcome assessors.
Incomplete outcome data
We rated four studies at low risk of attrition bias as they either did not have differential loss to follow‐up in the two groups or they did not have substantial overall attrition (Bhandari 2016; Oakley 2010; Shewade 2013; Thapa 2017). Although Hsieh 2015a, had differential losses (8.6% versus 2.8%), we judged the study at low risk of attrition bias as the proportions were based on small numbers.
We considered four studies to have a high risk of attrition bias (Jadhav 2016; Manary 2004; Ndekha 2005; Sigh 2018). Jadhav 2016 and Sigh 2018 had substantial overall attrition, while Manary 2004 and Ndekha 2005 had differential loss to follow‐up between two arms. Both Manary 2004 and Ndekha 2005 each had three arms: RUTF at a dose meeting total daily nutritional requirements, RUTF supplement in addition to the usual diet and flour porridge as control. In both studies, the RUTF supplement arm had more than double the percentage attrition compared to the other two arms.
We rated six studies at unclear risk of attrition bias; three because the study authors did not report how missing data for the ITT analyses were handled (Bahwere 2014; Irena 2015; Jones 2015); two because only a subgroup of the randomised participants was eligible for inclusion in our review and it is unclear whether randomisation was preserved in this smaller group (Ciliberto 2005; Kerac 2009); and one because it was not clear what were the sample size(s) for the different acceptability outcomes (Hsieh 2015b).
We provided a summary of missing data in Table 9.
Selective reporting
For each included trial, we searched for the protocol in the trials registries mentioned under Search methods for identification of studies, and contacted the primary study authors asking whether their studies had been registered. We judged five studies for which no protocol was available to be at unclear risk of reporting bias (Bahwere 2014; Ciliberto 2005; Hsieh 2015b; Manary 2004; Ndekha 2005). We judged another trial, Thapa 2017, which reported a trial registration number, to be at unclear risk of reporting bias also, because we could not find the registration entry on the Internet and the author did not respond to our communication. We judged a further eight studies at unclear risk of reporting bias because we found discrepancies between the prespecified outcomes (as per the protocol) and those that were addressed, and whether this affected the validity of the outcome data is unclear (Bhandari 2016; Hsieh 2015a; Irena 2015; Jadhav 2016; Jones 2015; Oakley 2010; Shewade 2013; Sigh 2018).
We judged one trial, Kerac 2009, to be at low risk of reporting bias because all expected outcomes were prespecified and reported.
Other potential sources of bias
We assessed the included studies for differences in baseline characteristics between comparison groups. We judged three studies to have a low risk of other bias as the baseline characteristics in the two groups appeared similar (Bhandari 2016; Jones 2015; Oakley 2010). We judged an additional four studies to be at low risk of other bias (Bahwere 2014; Hsieh 2015a; Manary 2004; Ndekha 2005); although there were differences in important baseline characteristics, these were likely due to chance.
We judged two individually randomised trials at unclear risk of other bias because they did not report on important baseline characteristics (Hsieh 2015b; Shewade 2013). We rated five studies at unclear risk of other bias; three studies ‐ Irena 2015, Shewade 2013 and Sigh 2018 ‐ used blocked randomisation that, in combination with a lack of blinding, could have posed a risk to selection bias (see section 8.15.1.3 in the Cochrane Handbook for Systematic Reviews of Interventions version 5.2 (Higgins 2017), and two studies did not report the baseline characteristics for the subgroups eligible to our review (Ciliberto 2005; Kerac 2009).
We rated two studies at high risk of other bias (Jadhav 2016; Thapa 2017). Jadhav 2016 reported baseline characteristics only for the children who remained in the study after two weeks (75.4%), and in Thapa 2017, there were substantial differences in the important baseline characteristics age and weight. It is likely that these influenced the results of all outcomes (except for acceptability).
In cluster trials, it is important to consider the unit of allocation to avoid potential bias. We investigated this for the four cluster trials (Ciliberto 2005; Irena 2015; Manary 2004; Ndekha 2005). While three of these studies did not adjust for clustering, one study adjusted for clustering in their multivariate analyses and provided the ICC used (Irena 2015). We also assessed recruitment bias, cluster baseline imbalances, loss of clusters, incorrect analysis and comparability with individually randomised trials for these four studies (Table 13). We judged two studies to have a low risk of recruitment bias because, although the children were recruited after the different clusters were allocated a specific intervention, an independent doctor discharged the children without knowing which discharge days or week matched which intervention (Manary 2004; Ndekha 2005). We judged two studies to have a high risk of recruitment bias because children were recruited after sites were assigned a specific intervention (Ciliberto 2005; Irena 2015). In terms of baseline imbalances, we judged three cluster trials to have an unclear risk of bias because no relevant information was provided to assess this particular aspect. We judged the fourth trial, Irena 2015, to have a low risk of baseline imbalances because the author performed multivariate analyses to assess the effects of clusters and detected no interactions. All clusters in the four cluster trials were retained and, therefore, we judged all of them to be at low risk of bias for loss of clusters. For the incorrect analysis domain, we judged one study to be at low risk of bias because the study authors provided the ICC that we used to calculate the design effect (Irena 2015). However, for the other three studies, we had to estimate the ICC and are unsure how close our estimate is to the truth. In terms of comparability with individually randomised trials, we judged two studies to be at low risk of bias because for the four most important outcomes the findings of these studies are in line with that of the individually randomised trials (Ciliberto 2005; Irena 2015). We judged the other two studies to be at an unclear risk of bias for this aspect, as for some of the most important outcomes, the findings of the cluster trials were not in line with that of the individually randomised trials and it could possibly be because of aspects other than the study design (Manary 2004; Ndekha 2005).
Effects of interventions
See: Table 1; Table 2; Table 3
Summary of findings for the main comparison. Standard ready‐to‐use therapeutic food (RUTF) provided at a dose that meets total daily nutritional requirements versus an alternative dietary approach.
| Standard ready‐to‐use therapeutic food (RUTF) provided at a dose that meets total daily nutritional requirements versus an alternative dietary approach | ||||||
|
Patient or population: children aged 6 months‐5 years with SAM (and mixed HIV comorbidity), some of whom had been stabilised as inpatients pre‐trial
Setting: 3 studies conducted in India and 3 in Malawi; in 2 studies rehabilitation started in hospital, but in most cases, across all studies, the rehabilitation phase occurred at home
Experimental intervention: standard RUTF formulations, produced either in a factory or local site kitchens, and meeting total daily nutritional requirements
Control intervention: alternative dietary approaches: caregiver‐prepared locally available foods, some of which were fortified and energy dense Intervention duration: 8‐16 weeks across studies | ||||||
| Outcomes | Anticipated absolute effects* (95% CI) | Relative effect (95% CI) | № of participants (studies) | Quality of the evidence (GRADE) | Comments | |
| Risk with alternative dietary approaches | Risk with standard RUTF meeting total daily requirements | |||||
|
Recovery during intervention defined as achieving WHZ ≥ −2 and absence of oedema in 1 study; reaching a WHZ score > −2 and without oedema in 1 study; WHZ > −2 in 1 study; having a WHZ score ≥ 0 in 1 study; reaching 100% weight for height in 1 study; and reaching 115% of baseline weight in 1 study |
Study population | RR 1.33 (1.16 to 1.54) | 1852 (6 RCTs) | ⊕⊕⊕⊝ Moderatea | Children are probably more likely to recover on standard RUTF | |
| 391 per 1000 | 521 per 1000 (454 to 603) | |||||
|
Relapse during intervention defined as admission to inpatient therapeutic care or recurrence of oedema or systematic infections during the study period, and dropouts during intervention period |
Study population | RR 0.55 (0.30 to 1.01) | 1505 (4 RCTs) | ⊕⊝⊝⊝ Very lowb,c,d | We are uncertain whether standard RUTF decreases relapse | |
| 195 per 1000 | 107 per 1000 (59 to 197) | |||||
| Mortality during intervention | Study population | RR 1.05 (0.51 to 2.16) | 1505 (4 RCTs) | ⊕⊝⊝⊝ Very lowc,d,e | We are uncertain whether standard RUTF decreases mortality | |
| 23 per 1000 | 24 per 1000 (12 to 50) | |||||
|
Rate of weight gain (g/kg/day) during intervention 3 studies measured weight gain during the first 4 weeks of the intervention period and 1 study until recovery or 16 weeks after enrolment, whichever was earlier |
The mean rate of weight gain during intervention in the control groups was 2.76 g/kg/day | The mean rate of weight gain during intervention in the intervention groups was, on average,1.12g/kg/day higher (0.27 higher to 1.96 higher) | ‐ | 1450 (4 RCTs) | ⊕⊕⊝⊝ Lowa,d | Standard RUTF may increase the rate of weight gain slightly |
| *The risk in the intervention group (and its 95% CI) is based on the assumed risk in the comparison group and the relative effect of the intervention (and its 95% CI). CI: confidence interval; RCT: randomised controlled trial; RR: risk ratio; RUTF: ready‐to‐use therapeutic food; SAM: severe acute malnutrition; WHZ: weight‐for‐age z score | ||||||
| GRADE Working Group grades of evidence High quality: further research is very unlikely to change our confidence in the estimate of effect. Moderate quality: further research is likely to have an important impact on our confidence in the estimate of effect and may change the estimate. Low quality: further research is very likely to have an important impact on our confidence in the estimate of effect and is likely to change the estimate. Very low quality: we are very uncertain about the estimate. | ||||||
aDowngraded by one level for risk of bias: three studies judged to have a high risk of selection bias, and one study judged to have a high risk of attrition and other bias. bDowngraded by one level for indirectness: significant difference between subgroups based on whether all or some children were stabilised in hospital before the trial. cDowngraded by one level for risk of bias: three studies judged to have a high risk of selection bias. dDowngraded by one level for inconsistency: I2 statistic is more than 50%. eDowngraded by one level for imprecision: 95% CI includes both an important benefit and harm.
Summary of findings 2. Standard ready‐to‐use therapeutic food (RUTF) provided at a dose that meets total daily nutritional requirements versus as a supplement to the usual diet.
| Standard ready‐to‐use therapeutic food (RUTF) provided at a dose that meets total daily nutritional requirements versus as a supplement to the usual diet | ||||||
|
Patient or population: children aged 6 months‐5 years with SAM (1 study included HIV‐uninfected children; 1 study included HIV‐infected children), all of whom had been stabilised as inpatients pre‐trial.
Setting: both studies conducted in Malawi, with rehabilitation at home
Experimental intervention: standard RUTF formulation, produced in a factory, and meeting total daily nutritional requirements
Control intervention: a similar RUTF to that used as the experimental intervention, but given as a supplement to the usual diet Intervention duration: 16 weeks in 1 study; undefined duration in 1 study | ||||||
| Outcomes | Anticipated absolute effects* (95% CI) | Relative effect (95% CI) | № of participants (studies) | Quality of the evidence (GRADE) | Comments | |
| Risk with RUTF supplement | Risk with standard RUTF formulation meeting total daily requirements | |||||
|
Recovery during intervention defined as WHZ > 0 in 1 study; 100% weight for height in 1 study |
Study population | RR 1.41 (1.19 to 1.68) | 210 (2 RCTs) | ⊕⊕⊝⊝ Lowa,b | Children may be more likely to recover on standard RUTF in amounts meeting total daily nutritional requirements | |
| 582 per 1000 | 821 per 1000 (693 to 978) | |||||
|
Relapse during intervention defined as admission to inpatient therapeutic care or recurrence of oedema or systematic infections during the study period, and dropouts during intervention period |
Study population | RR 0.11 (0.01 to 0.85) | 210 (2 RCTs) | ⊕⊕⊝⊝ Lowa,b | Standard RUTF meeting total daily nutritional requirements may decrease relapse | |
| 107 per 1000 | 12 per 1000 (1 to 91) | |||||
| Mortality during intervention | Study population | RR 1.36 (0.46 to 4.04) | 210 (2 RCTs) | ⊕⊝⊝⊝ Very lowa,b,c | We are uncertain whether standard RUTF meeting total daily nutritional requirements decreases mortality | |
| 49 per 1000 | 67 per 1000 (23 to 199) | |||||
|
Rate of weight gain (g/kg/day) during intervention defined as change between baseline and week 4 of the intervention period |
The mean rate of weight gain during intervention in the control groups was 3.05 g/kg/day | The mean rate of weight gain during intervention in the intervention groups was, on average, 1.21 g/kg/day higher (0.74 lower to 3.16 higher) | ‐ | 206 (2 RCTs) | ⊕⊝⊝⊝ Very lowa,c,d,e | We are uncertain whether standard RUTF meeting total daily nutritional requirements increases the rate of weight gain |
| *The risk in the intervention group (and its 95% CI) is based on the assumed risk in the comparison group and the relative effect of the intervention (and its 95% CI). CI: confidence interval; RCT: randomised controlled trial; RR: risk ratio; RUTF: ready‐to‐use therapeutic food; SAM: severe acute malnutrition; WHZ: weight‐for‐age z score | ||||||
| GRADE Working Group grades of evidence High quality: further research is very unlikely to change our confidence in the estimate of effect. Moderate quality: further research is likely to have an important impact on our confidence in the estimate of effect and may change the estimate. Low quality: further research is very likely to have an important impact on our confidence in the estimate of effect and is likely to change the estimate. Very low quality: we are very uncertain about the estimate. | ||||||
aDowngraded by one level for risk of bias: high risk of selection and attrition bias. bDowngraded by one level for indirectness: the two studies were conducted in the same country. cDowngraded by one level for imprecision: 95% CI includes both an important benefit and harm. dDowngraded by one level for imprecision: 95% CI includes both an important benefit and harm, and the total sample size is smaller than the optimal information size. eDowngraded by one level for inconsistency: I2 statistic more than 50%; subgrouped for HIV‐status as one study included only HIV‐uninfected children (RR 2.1, 95% CI 1.12 to 3.08) and the other study included only HIV‐infected children (RR 0.1, 95% CI −1.53 to 3.16).
Summary of findings 3. Standard ready‐to‐use therapeutic food (RUTF) versus RUTF using an alternative formulation.
| Standard ready‐to‐use therapeutic food (RUTF) versus RUTF using an alternative formulation | ||||||
|
Patient or population: children aged 6 months‐5 years with SAM (and mixed HIV comorbidity), some of whom had been stabilised as inpatients pre‐trial
Setting: 4 studies conducted in Malawi, 1 in Zambia, 1 in Kenya and 1 in Cambodia; although in 2 studies, some or all children started rehabilitation in hospital and much of the rehabilitation phase across all studies occurred at home
Experimental intervention: standard RUTF formulations, produced either in a factory or local site kitchens, and meeting total daily nutritional requirements
Control intervention: RUTF with alternative ingredients, produced in a factory Intervention duration: 8‐16 weeks across studies | ||||||
| Outcomes | Anticipated absolute effects* (95% CI) | Relative effect (95% CI) | № of participants (studies) | Quality of the evidence (GRADE) | Comments | |
| Risk with RUTF with alternative ingredients | Risk with RUTF with standard ingredients (peanut‐ and milk‐based) | |||||
|
Recovery during intervention defined as weight gain ≥ 15% in relation to baseline weight, absence of complications and oedema, and MUAC > 110 mm in 2 studies; MUAC > 12.4 cm without oedema in 1 study; WHZ ≥ 80% for two consecutive visits in 1 study; WHZ > −2 and no oedema in 1 study; and not defined in 1 study |
Study population | RR 1.03 (0.99 to 1.08) | 4188 (6 RCTs) | ⊕⊕⊕⊕ High | Makes little or no difference whether standard or alternative recipe formulation RUTF is used for recovery | |
| 717 per 1000 | 738 per 1000 (710 to 774) | |||||
|
Relapse during intervention defined as admission to inpatient therapeutic care, remain wasted, and dropouts during intervention period |
Study population | RR 0.84 (0.72 to 0.98) | 4188 (6 RCTs) | ⊕⊕⊕⊕ High | Standard, factory‐produced RUTF meeting total daily nutritional requirements decreases relapse slightly | |
| 137 per 1000 | 115 per 1000 (99 to 135) | |||||
| Mortality during intervention | Study population | RR 1.00 (0.80 to 1.24) | 4309 (7 RCTs) | ⊕⊕⊕⊝ Moderatea | It probably makes little or no difference to mortality whether standard or alternative recipe formulation RUTF is used | |
| 85 per 1000 | 85 per 1000 (68 to 106) | |||||
|
Rate of weight gain (g/kg/day) during intervention defined as change over first 4, 8, 10, 16 weeks of the intervention period in 4 studies; change until end of intervention period (no maximum number of weeks applied) in 1 study; and regression analysis with adjustment over the entire study in 1 study |
The mean rate of weight gain during intervention in the control groups was 2.6 g/kg/day | The mean rate of weight gain during intervention in the intervention groups was, on average, 0.11 g/kg/day higher (0.32 lower to 0.54 higher) | ‐ | 3807 (6 RCTs) | ⊕⊕⊝⊝ Lowa,b | It may make little or no difference in the rate of weight gain whether standard or alternative recipe formulation RUTF is used |
| *The risk in the intervention group (and its 95% CI) is based on the assumed risk in the comparison group and the relative effect of the intervention (and its 95% CI). CI: confidence interval; MUAC: mid‐upper arm circumference; RCT: randomised controlled trial; RR: risk ratio; RUTF: ready‐to‐use therapeutic food; SAM: severe acute malnutrition; WHZ: weight‐for‐age z score | ||||||
| GRADE Working Group grades of evidence High quality: further research is very unlikely to change our confidence in the estimate of effect. Moderate quality: further research is likely to have an important impact on our confidence in the estimate of effect and may change the estimate. Low quality: further research is very likely to have an important impact on our confidence in the estimate of effect and is likely to change the estimate. Very low quality: we are very uncertain about the estimate. | ||||||
aDowngraded by one level for imprecision: the 95% CI includes both an important benefit and harm. bDowngraded by one level for inconsistency: I2 statistic more than 50%.
In this section, we report on all eligible outcomes addressed by the included studies for each of the pre‐specified comparisons. We also provide a 'Summary of findings' table per comparison, each of which contains our three primary outcomes and an important secondary outcome, namely rate of weight gain (Table 1; Table 2; Table 3).
Data did not allow us to analyse results by different age groups, and only a few studies (Kerac 2009; Manary 2004; Ndekha 2005), tested participants' HIV status, which limited the number of subgroup analyses we were able to do for this important comorbidity. No included study measured our secondary outcome 'cognitive function and development'. Nor did they specifically assess allergic reactions as an adverse outcome. Although three studies explicitly excluded children with known allergies (Bhandari 2016; Hsieh 2015a; Jones 2015), only one study reported that a child was lost to follow‐up due to being diagnosed with an allergy (Bhandari 2016).
Comparison 1: standard RUTF provided at a dose that meets total daily nutritional requirements versus an alternative dietary approach
Seven studies with a total of 2261 children (effective sample size = 1964) evaluated the effects of RUTF meeting total daily nutritional requirements versus alternative dietary approaches (Bhandari 2016; Ciliberto 2005; Jadhav 2016; Manary 2004; Ndekha 2005; Shewade 2013; Thapa 2017). Four studies randomised participants individually, and three studies assigned their participants in clusters (Ciliberto 2005; Manary 2004; Ndekha 2005). The three cluster trials were also quasi‐randomised trials.
Primary outcomes
Recovery during intervention
Six studies measured and reported on recovery (Bhandari 2016; Ciliberto 2005; Jadhav 2016; Manary 2004; Ndekha 2005; Shewade 2013). These studies measured recovery in different ways: achieving WHZ of −2 or more and absence of oedema (Bhandari 2016); reaching a WHZ score more than −2 and disappearance of oedema (Ciliberto 2005); WHZ more than −2 (Jadhav 2016); having a WHZ score more than 0 (Manary 2004); reaching 100% weight for height (Ndekha 2005); and reaching 115% of baseline weight (Shewade 2013). Three studies were cluster trials (Ciliberto 2005; Manary 2004; Ndekha 2005), and we adjusted the results for clustering as described above (Unit of analysis issues).
A random‐effects meta‐analysis of these six studies showed that RUTF significantly improved recovery compared to the alternative diet (RR 1.33, 95% CI 1.16 to 1.54; n = 1852; Analysis 1.1; Figure 5); there was no significant heterogeneity between the studies (Chi2 = 7.54, degrees of freedom (df) = 5; P = 0.18; I2 = 34%).
1.1. Analysis.
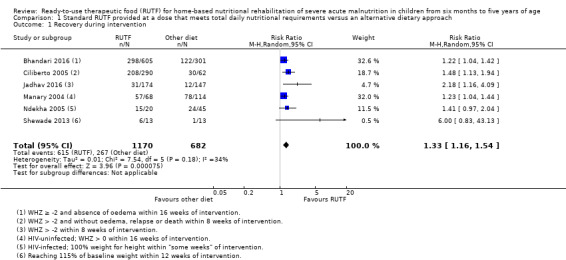
Comparison 1 Standard RUTF provided at a dose that meets total daily nutritional requirements versus an alternative dietary approach, Outcome 1 Recovery during intervention.
5.
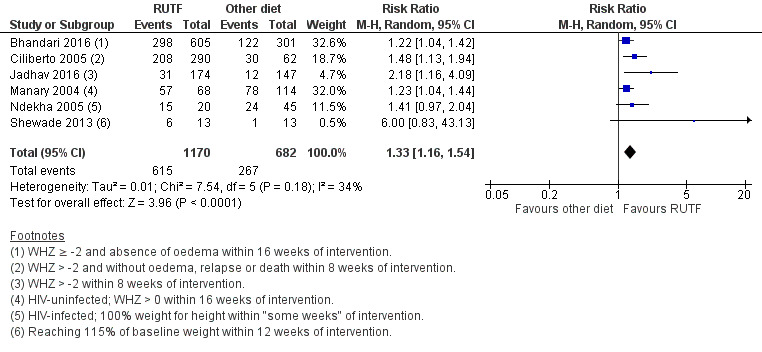
Forest plot of Comparison 1. Standard RUTF provided at a dose that meets total daily nutritional requirements versus an alternative dietary approach, outcome: 1.1 recovery during intervention
Subgroup and sensitivity analyses
There was also no heterogeneity between the findings in subgroup analysis based on pre‐trial hospitalisation (Chi2 = 2.42, df = 2; P = 0.30; I2 = 17.3%; Analysis 1.2).
1.2. Analysis.
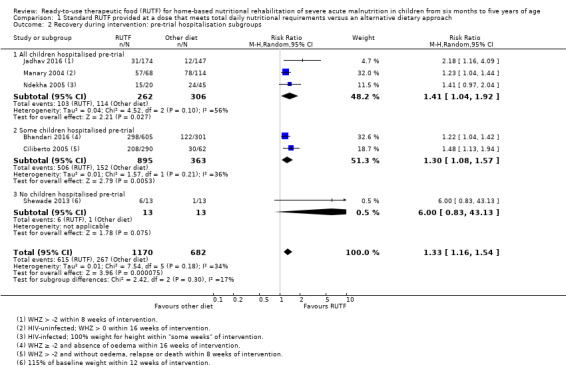
Comparison 1 Standard RUTF provided at a dose that meets total daily nutritional requirements versus an alternative dietary approach, Outcome 2 Recovery during intervention: pre‐trial hospitalisation subgroups.
The sensitivity analysis with Bhandari 2016, the only study at low risk of bias, showed a difference in favour of the RUTF group (RR 1.22, 95% CI 1.04 to 1.42; n = 906; analysis not shown), which is in the same direction as the overall pooled effect estimate. A sensitivity analysis with individually randomised trials showed no difference between the RUTF and the alternative diet groups, although the CI was wide and is compatible with a potentially substantial benefit (RR 1.73, 95% CI 0.92 to 3.26; 3 studies, n = 1253; Chi2 = 5.7, df = 2; P = 0.06; I2 = 65%; analysis not shown). However, in the analysis of cluster trials only, the pooled difference in effect favoured RUTF (RR 1.3, 95% CI 1.14 to 1.48; 3 studies, n = 599; Chi2 = 1.89, df = 2; P = 0.39; I2 = 0%; analysis not shown).
Recovery at follow‐up
Two studies measured recovery at follow‐up (Bhandari 2016; Jadhav 2016). Bhandari 2016 measured recovery (WHZ ≥ −2) at 16 weeks after the intervention ended, and Jadhav 2016 measured recovery (WHZ > −2) six months after the intervention period. We found no significant difference between the RUTF and alternative diet groups (RR 1.10, 95% CI 0.83 to 1.46; 2 studies, n = 970; Analysis 1.3) and detected no heterogeneity between the studies (Chi2 = 0.75, df = 1; P = 0.39; I2 = 0%).
1.3. Analysis.
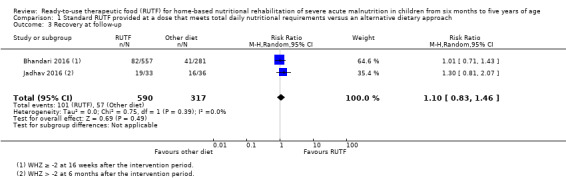
Comparison 1 Standard RUTF provided at a dose that meets total daily nutritional requirements versus an alternative dietary approach, Outcome 3 Recovery at follow‐up.
Relapse during intervention
Three studies defined relapse as admission to inpatient therapeutic care or recurrence of oedema or systematic infections during the study period (Manary 2004; Ciliberto 2005; Ndekha 2005). Specifically, Manary 2004 reported results as "died or relapsed". We contacted the study authors who sent us the separate data for "relapsed" and "died". A fourth trial, Bhandari 2016, reported hospitalisation during the treatment period, which we interpreted to be relapse.
A meta‐analysis of these four studies showed no significant difference in relapse between the RUTF and alternative diet groups (RR 0.55, 95% CI 0.30 to 1.01; n = 1505; Analysis 1.4); however, there was significant heterogeneity between findings across studies (Chi2 = 8.10, df = 3; P = 0.04; I2 = 63%).
1.4. Analysis.
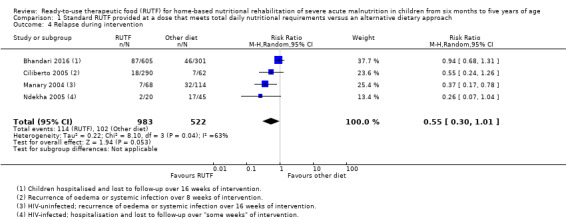
Comparison 1 Standard RUTF provided at a dose that meets total daily nutritional requirements versus an alternative dietary approach, Outcome 4 Relapse during intervention.
One trial, Jadhav 2016, did not set out to measure relapse, but large losses occurred during the intervention period. Because we applied the ITT principle, where we assumed that those who dropped out did not receive any treatment (RUTF or the control diet), and therefore experienced the event (relapsed), we have reported the losses of this study here for this outcome. In the RUTF group 98/174 (56.3%) dropped out of the trial, compared with 85/147 (57.8%) in the alternative diet group.
Subgroup and sensitivity analyses
A subgroup analysis showed that when all children were hospitalised before the trial, the RUTF group was favoured (RR 0.34, 95% CI 0.17 to 0.66; n = 247; Analysis 1.5) and there was no heterogeneity between studies (Chi2 = 0.17, df = 1; P = 0.68; I2 = 0%). In contrast, in the subgroup where some children were stabilised as inpatients prior to the trial, no significant difference was detected (RR 0.83, 95% CI 0.53 to 1.30; n = 1258; Analysis 1.5), and there was no significant heterogeneity (Chi2 = 1.40, df = 1; P = 0.24; I2 = 28%). However, between subgroups, despite a slight overlap of CI, we detected significant heterogeneity (Chi2 = 4.73, df = 1; P = 0.03; I2 = 78.9%).
1.5. Analysis.
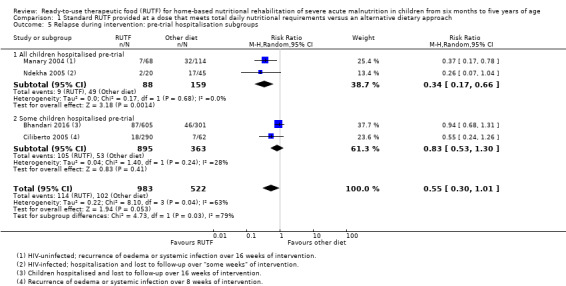
Comparison 1 Standard RUTF provided at a dose that meets total daily nutritional requirements versus an alternative dietary approach, Outcome 5 Relapse during intervention: pre‐trial hospitalisation subgroups.
There were no significant differences across subgroups in analyses of factory versus local site‐produced RUTF (Chi2 = 0.94, df = 1; P = 0.33; I2 = 0%; Analysis 1.6) and HIV status (Chi2 = 1.25, df = 1; P = 0.26; I2 = 20.1%; Analysis 1.7).
1.6. Analysis.
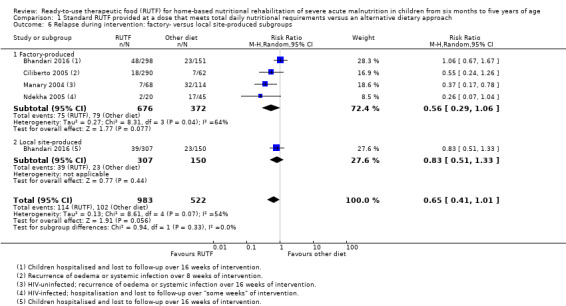
Comparison 1 Standard RUTF provided at a dose that meets total daily nutritional requirements versus an alternative dietary approach, Outcome 6 Relapse during intervention: factory‐ versus local site‐produced subgroups.
1.7. Analysis.
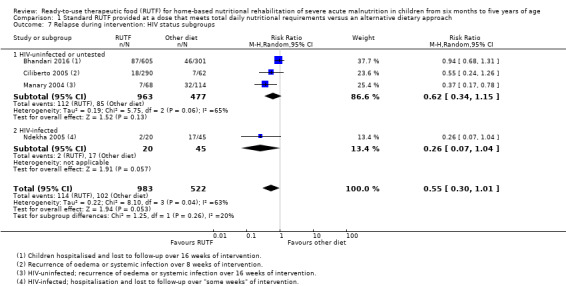
Comparison 1 Standard RUTF provided at a dose that meets total daily nutritional requirements versus an alternative dietary approach, Outcome 7 Relapse during intervention: HIV status subgroups.
A sensitivity analysis with Bhandari 2016, the only individually randomised trial that was also at low risk of bias, showed no difference between the RUTF and alternative diet groups (RR 0.94, 95% CI 0.68 to 1.31; analysis not shown), which is in line with the finding of the overall pooled effect estimate. However, a sensitivity analysis of cluster trials only detected a difference in favour of RUTF (RR 0.41, 95% CI 0.24 to 0.69; 3 studies, n = 599; Chi2 = 0.99, df = 2; P = 0.61; I2 = 0%; analysis not shown).
Relapse at follow‐up
One trial, Bhandari 2016, reported relapse during their "sustenance phase" (16 weeks after the end of intervention). They detected no significant difference between the RUTFs and alternative diet groups (RR 0.73, 95% CI 0.32 to 1.68; n = 838; see the illustrative forest plot in Analysis 1.8). Another trial, Ciliberto 2005, measured relapse at 6 and 12 months after the intervention period, defined as WHZ less than −2 or oedema. However, they did not report results separately for SAM children. Two studies, Manary 2004 and Ndekha 2005, also reported this outcome six months after the intervention period; however, there were no separate results per intervention group (see Comparison 2 for the findings across all three study groups).
1.8. Analysis.
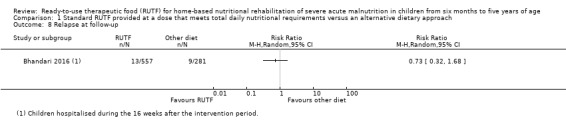
Comparison 1 Standard RUTF provided at a dose that meets total daily nutritional requirements versus an alternative dietary approach, Outcome 8 Relapse at follow‐up.
Mortality during intervention
Four studies measured mortality (Bhandari 2016; Ciliberto 2005; Manary 2004; Ndekha 2005). We detected no difference in mortality between the RUTF and alternative diet groups, with a wide CI around the point estimate (RR 1.05, 95% CI 0.51 to 2.16; 4 studies; n = 1505; Analysis 1.9), and no significant heterogeneity between the studies (Chi2 = 2.20; df = 3; P value = 0.53; I2 = 0%). Another trial, Jadhav 2016, set out to measure mortality; however, they did not report any results. We contacted the study author but did not receive a response.
1.9. Analysis.
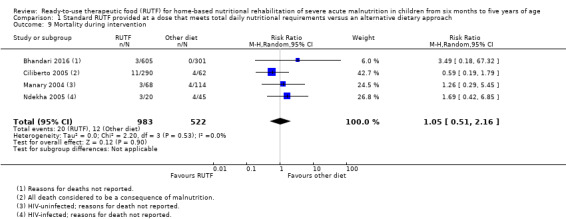
Comparison 1 Standard RUTF provided at a dose that meets total daily nutritional requirements versus an alternative dietary approach, Outcome 9 Mortality during intervention.
Subgroup and sensitivity analyses
There was no overall difference between subgroups based on pre‐trial hospitalisation (Chi2 = 0.35, df = 1; P 0.56; I2 = 0%; Analysis 1.10).
1.10. Analysis.
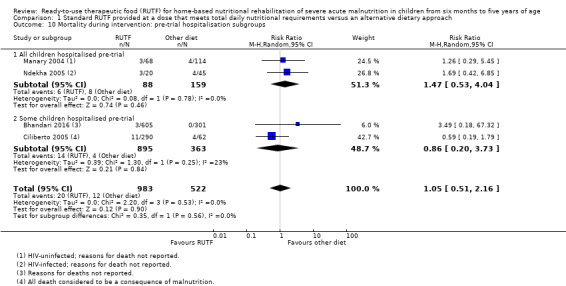
Comparison 1 Standard RUTF provided at a dose that meets total daily nutritional requirements versus an alternative dietary approach, Outcome 10 Mortality during intervention: pre‐trial hospitalisation subgroups.
The sensitivity analysis with Bhandari 2016, the only individually randomised study that was also at low risk of bias, showed no difference between the RUTF and alternative diet groups (RR 3.49, 95% CI 0.18 to 67.32; analysis not shown). Similarly, a sensitivity analysis with cluster trials only also detected no difference between the groups (RR 0.97, 95% CI 0.46 to 2.05; 3 studies, n = 599; Chi2 = 1.5, df = 2; P = 0.47; I2 = 0%; analysis not shown).
Secondary outcomes
Rate of weight gain during intervention
All seven studies included in this comparison measured weight gain, four of which we could pool in a meta‐analysis.
Three studies, Manary 2004, Ciliberto 2005 and Ndekha 2005, reported weight gain measured during the first four weeks of the intervention period (we obtained data on weight gain from the contact author of Manary 2004). One trial, Bhandari 2016, measured the same outcome between baseline and recovery or 16 weeks after enrolment, whichever was earlier. We found a significant difference in favour of the RUTF group (MD 1.12 g/kg/day, 95% CI 0.27 to 1.96; 4 studies; n = 1450; Analysis 1.11), but detected significant heterogeneity between the studies (Chi2 = 7.40; df = 3; P = 0.06; I2 = 59%).
1.11. Analysis.
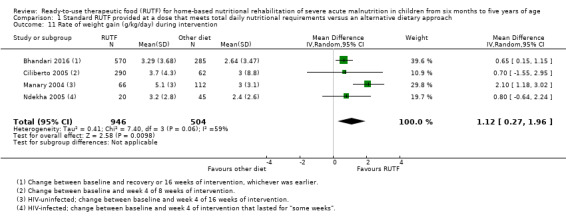
Comparison 1 Standard RUTF provided at a dose that meets total daily nutritional requirements versus an alternative dietary approach, Outcome 11 Rate of weight gain (g/kg/day) during intervention.
One trial, Jadhav 2016, reported weight gain over eight weeks of intervention of 3.45 g/kg/day in the RUTF group and 2.38 g/kg/day in the alternative diet group; however, the corresponding SD were not reported and therefore we could not include the results in the meta‐analysis above.
Another trial, Shewade 2013, reported a mean weight gain of 21.5 g/kg/week (range = 3.5 to 63; n = 13) for the RUTF group and 7.89 g/kg/week (range = 0.2 to 23.8; n = 13) for the alternative diet groups. From the linear regression results reported by the study authors, the RUTF group resulted in an average additional weight gain of 13 g/kg/week/child (95% CI 2 to 23), which was statistically significant.
The final trial, Thapa 2017, reported that the RUTF group had significantly higher weight gain (23 g/day) in comparison with the alternative diet group (14 g/day); however, these results should be viewed with caution as the baseline weight per group was highly unbalanced and the time point at which this result was taken is unclear. We could not add these results to the meta‐analysis above because they did not report the results in g/kg/day and the study author did not respond to our communication.
Subgroup and sensitivity analyses
We attempted to determine the potential source of heterogeneity in Analysis 1.11, by conducting a subgroup analysis of pre‐trial hospitalisation (Analysis 1.12). We found results in favour of the RUTF group for studies where all children were stabilised in hospital (MD 1.57 g/kg/day, 95% CI 0.32 to 2.82; 4 studies, n = 243), but there was significant heterogeneity between the studies in this subgroup (Chi2 = 2.21; df = 1; P = 0.14; I2 = 55%). We also found a statistically significant difference in favour of RUTF for the subgroup where only some children were stabilised in hospital pre‐trial (MD 0.65 g/kg/day, 95% CI 0.16 to 1.14; n = 1207), and detected no significant heterogeneity between these studies (Chi2 = 0.00; df = 1; P = 0.97; I2 = 0%). We found no significant heterogeneity between the subgroups (Chi2 = 1.80; df = 1; P = 0.18; I2 = 44.5%).
1.12. Analysis.
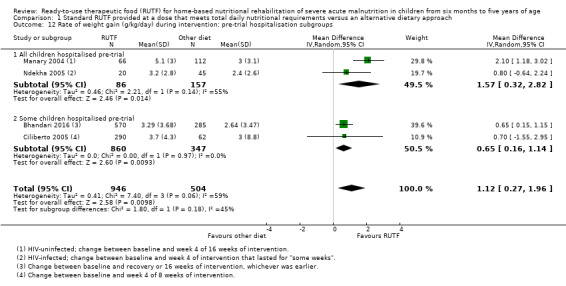
Comparison 1 Standard RUTF provided at a dose that meets total daily nutritional requirements versus an alternative dietary approach, Outcome 12 Rate of weight gain (g/kg/day) during intervention: pre‐trial hospitalisation subgroups.
Subgroup analyses of factory versus local site‐produced RUTF (Chi2 = 0.07, df = 1; P = 0.79; I2 = 0%; Analysis 1.13) and HIV status (Chi2 = 0.19, df = 1; P = 0.67; I2 = 0%; Analysis 1.14) also showed no differences across subgroups (4 studies, n = 1450).
1.13. Analysis.
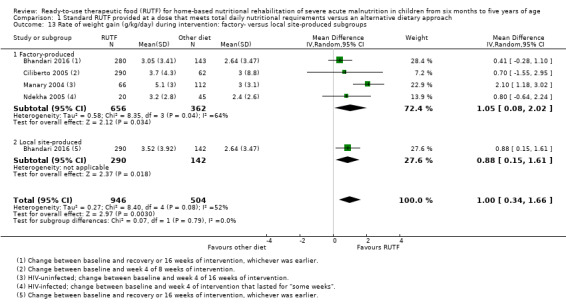
Comparison 1 Standard RUTF provided at a dose that meets total daily nutritional requirements versus an alternative dietary approach, Outcome 13 Rate of weight gain (g/kg/day) during intervention: factory‐ versus local site‐produced subgroups.
1.14. Analysis.
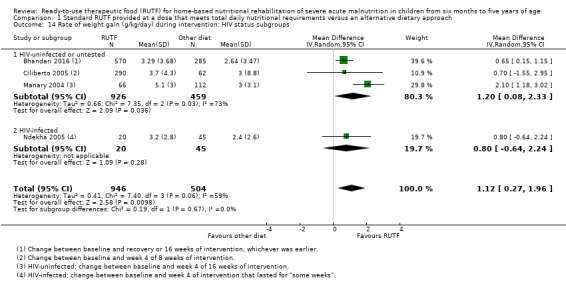
Comparison 1 Standard RUTF provided at a dose that meets total daily nutritional requirements versus an alternative dietary approach, Outcome 14 Rate of weight gain (g/kg/day) during intervention: HIV status subgroups.
The sensitivity analysis with Bhandari 2016, the only individually randomised trial that was also at low risk of bias, showed a difference favouring the RUTF group (MD 0.65 g/kg/day, 95% CI 0.15 to 1.15; analysis not shown), which is in line with the overall pooled effect estimate. Similarly, a sensitivity analysis with the cluster trials only detected a significant difference in favour of RUTF (MD 1.47 g/kg/day, 95% CI 0.49 to 2.45; 3 studies, n = 595; Chi2 = 2.92, df = 2; P = 0.23; I2 = 32%; analysis not shown).
Time to recovery (days) among children who recovered
Four studies measured and reported on time to recovery (Bhandari 2016; Ciliberto 2005; Manary 2004; Ndekha 2005).
One trial, Bhandari 2016, reported mean duration to treatment in weeks, which we converted to days. Another trial, Manary 2004, which included HIV‐uninfected children, also reported time to recovery but results were displayed only in a graph from which we could not obtain accurate information for further analysis. We contacted the study authors, who provided us with the necessary information to add these data to the meta‐analysis. We pooled the results from these two studies and detected a significant difference in favour of the RUTF group (MD −7.61 days, 95% CI −12.84 to −2.37; n = 556; Analysis 1.15), with no significant heterogeneity between the two studies (Chi2 = 0.03; df = 3; P = 0.87; I2 = 0%).
1.15. Analysis.
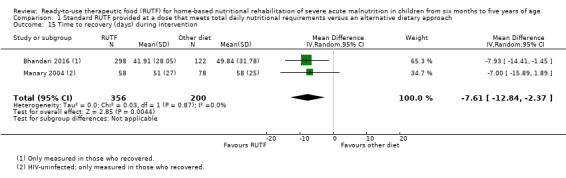
Comparison 1 Standard RUTF provided at a dose that meets total daily nutritional requirements versus an alternative dietary approach, Outcome 15 Time to recovery (days) during intervention.
One trial, Ciliberto 2005, performed a time‐to‐event analysis to compare the rates of reaching a WHZ more than −2 over eight weeks, but did not report the results separately for children with SAM.
Another trial, Ndekha 2005, measured time to recovery and reported results in median days. HIV‐infected children in the RUTF group (n = 20) recovered within a median of 71 days (interquartile range 42 to 125) compared to 85 days (interquartile range 46 to 239) in the alternative diet group (n = 45). The study authors did not report a P value or significance for the difference in time to recovery between these two groups.
Anthropometrical status at the end of the intervention period and beyond
Weight‐for‐height z score (WHZ) during intervention
Two studies reported on this outcome (Ciliberto 2005; Shewade 2013). Ciliberto 2005 reported WHZ in end values and did not find a significant difference between the RUTF and alternative diet groups (MD 0.00, 95% CI −0.28 to 0.28; n = 352; Analysis 1.16). Shewade 2013 measured WHZ and used the data in linear regression but did not report change or end values per group.
1.16. Analysis.
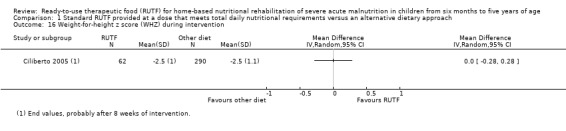
Comparison 1 Standard RUTF provided at a dose that meets total daily nutritional requirements versus an alternative dietary approach, Outcome 16 Weight‐for‐height z score (WHZ) during intervention.
Weight‐for‐height z score (WHZ) at follow‐up
Two studies reported on this outcome (Bhandari 2016; Manary 2004). Bhandari 2016 reported this outcome as change at follow‐up 16 weeks after the end of the intervention period. In Manary 2004, HIV‐uninfected children who recovered and were discharged from the study were followed up for six months; we obtained end value data from the contact author. We pooled the results of these two studies in a meta‐analysis and found no significant difference in WHZ between the RUTF and alternative diet groups (MD 0.06, 95% −0.04 to 0.16; n = 937; Analysis 1.17) with no significant heterogeneity between the studies (Chi2 = 0.43; df = 1; P value = 0.51; I2 = 0%).
1.17. Analysis.
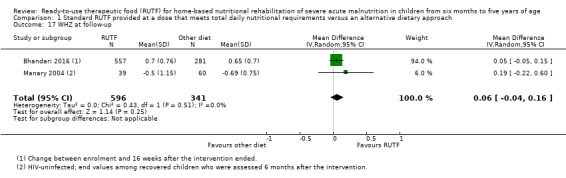
Comparison 1 Standard RUTF provided at a dose that meets total daily nutritional requirements versus an alternative dietary approach, Outcome 17 WHZ at follow‐up.
Length/height gain during intervention
Four studies measured this outcome (Ciliberto 2005; Manary 2004; Ndekha 2005; Thapa 2017).
Ciliberto 2005 and Ndekha 2005 measured length/height gain during the intervention period. We pooled the data from these studies in a meta‐analysis and detected no significant difference between the RUTF and alternative diet groups (MD 0.12 mm/day, 95% 0.00 to 0.24; n = 417; Analysis 1.18), with no significant heterogeneity between the studies (Chi2 = 1.58; df = 1; P value = 0.21; I2 = 37%).
1.18. Analysis.
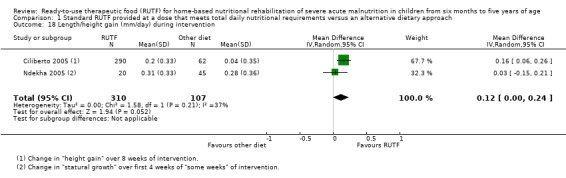
Comparison 1 Standard RUTF provided at a dose that meets total daily nutritional requirements versus an alternative dietary approach, Outcome 18 Length/height gain (mm/day) during intervention.
Thapa 2017 reported height in centimetres at the end of the eight‐week intervention period but provided no SD of change. Therefore, we were unable to include this result in the above meta‐analysis.
Manary 2004 also reported height gain (mm/day), but provided results in a bar chart format and not as numerical data.
Height‐for‐age z score (HAZ) at follow‐up
One trial, Bhandari 2016, reported HAZ score at 16 weeks after the end of the intervention period. There was no significant difference between the RUTF and alternative diet groups (MD −0.02, 95% −0.09 to 0.05; n = 838; see the illustrative forest plot in Analysis 1.19).
1.19. Analysis.
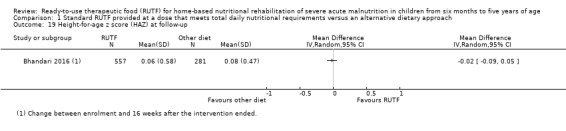
Comparison 1 Standard RUTF provided at a dose that meets total daily nutritional requirements versus an alternative dietary approach, Outcome 19 Height‐for‐age z score (HAZ) at follow‐up.
Mid‐upper arm circumference (MUAC) gain during intervention
Three studies measured MUAC gain during the first four weeks of the intervention period (Manary 2004; Ciliberto 2005; Ndekha 2005). Manary 2004 reported data only in graph form and we obtained the actual values from the contact author. We pooled these three studies in a meta‐analysis and found that children in the RUTF group had higher MUAC gain compared to those in the alternative diet group (MD 0.13 mm/day, 95% CI 0.04 to 0.21; n = 570; Analysis 1.20), with no significant heterogeneity between studies (Chi2 = 2.30; df = 2; P value = 0.32; I2 = 13%).
1.20. Analysis.
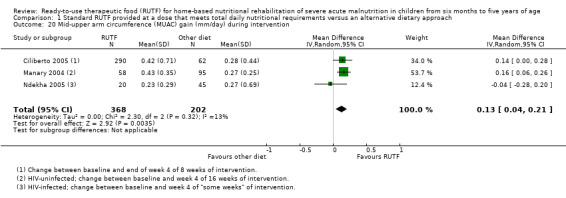
Comparison 1 Standard RUTF provided at a dose that meets total daily nutritional requirements versus an alternative dietary approach, Outcome 20 Mid‐upper arm circumference (MUAC) gain (mm/day) during intervention.
One trial, Thapa 2017, reported MUAC at the end of the eight weeks of intervention, but there were no SD of change so we could not include this study in the meta‐analysis.
Mid‐upper arm circumference (MUAC) gain at follow‐up
One trial, Bhandari 2016, reported the MUAC gain (in cm) during their sustenance phase (16 weeks after the end of the intervention): there was no significant difference between the RUTF and the alternative diet groups (MD −0.04 cm, 95% CI −1.04 to 0.96, n = 838; see the illustrative forest plot in Analysis 1.21).
1.21. Analysis.
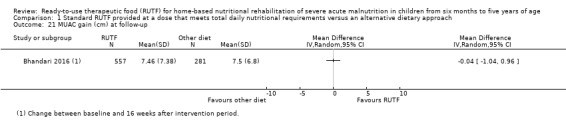
Comparison 1 Standard RUTF provided at a dose that meets total daily nutritional requirements versus an alternative dietary approach, Outcome 21 MUAC gain (cm) at follow‐up.
Cognitive function and development
No study presented data for this outcome.
Adverse outcomes
Six studies reported on adverse outcomes (Bhandari 2016; Ciliberto 2005; Jadhav 2016; Manary 2004; Ndekha 2005; Thapa 2017).
One trial, Bhandari 2016 reported the number of children having diarrhoea during the treatment phase; there was no significant difference in the frequency of diarrhoea between the RUTF and the alternative diet groups (RR 1.00, 95% CI 0.83 to 1.20, n = 727; see the illustrative forest plot in Analysis 1.22).
1.22. Analysis.
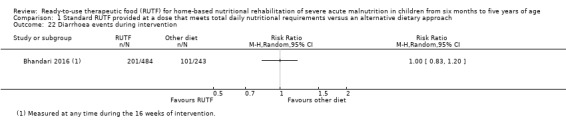
Comparison 1 Standard RUTF provided at a dose that meets total daily nutritional requirements versus an alternative dietary approach, Outcome 22 Diarrhoea events during intervention.
Another trial, Ciliberto 2005, measured the numbers of days of diarrhoea per group during the first two weeks of the treatment period and found that children who received RUTF had a similar frequency of diarrhoea as those on the alternative diet (MD −0.60 days, 95% CI −1.30 to 0.10; n = 352; see the illustrative forest plot in Analysis 1.23).
1.23. Analysis.
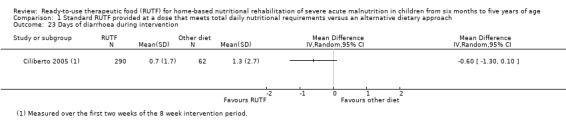
Comparison 1 Standard RUTF provided at a dose that meets total daily nutritional requirements versus an alternative dietary approach, Outcome 23 Days of diarrhoea during intervention.
A third trial, Jadhav 2016, set out to measure infectious episodes; however, no results were reported. We contacted the study author but did not receive a response.
Two studies, Ndekha 2005 and Manary 2004, measured the "prevalence of diarrhoea": days of diarrhoea divided by the "total days" during the first two weeks of the treatment period. In HIV‐infected children (Ndekha 2005), the RUTF group (n = 20) had diarrhoea on 19 out of the 304 evaluated days compared to 57 out of 687 evaluated days for children (n = 45) in the alternative diet group. In HIV‐uninfected children (Manary 2004), those in the RUTF group (n = 67) had diarrhoea on 74/1959 days (3.8%) compared to 74/3228 days (2.3%) in the alternative diet group (n = 114). This outcome refers to the number of days children had diarrhoea, and not the number of children who had diarrhoea. Therefore, we could not adjust the data for clustering and thus could not calculate the treatment effect from these two studies.
One trial, Thapa 2017, reported that no "adverse effects" were documented in the experimental group, while three (of 56) children in the control group had acute diarrhoea, which resolved without the administration of antibiotics.
Acceptability
One trial, Thapa 2017, measured acceptance of the intervention and found that RUTF was more acceptable than the alternative diet (RR 1.37, 95% CI 1.13 to 1.66; n = 112; see the illustrative forest plot in Analysis 1.24).
1.24. Analysis.
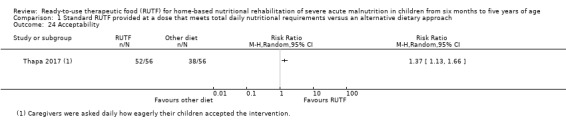
Comparison 1 Standard RUTF provided at a dose that meets total daily nutritional requirements versus an alternative dietary approach, Outcome 24 Acceptability.
Although not explicitly measured as acceptability, another trial, Shewade 2013, measured compliance in the experimental group by asking mothers to return empty RUTF packets on a weekly basis. The average weekly consumption of RUTF was reported as 23.4% of that expected, with the range between 1.7% and 48.4%.
Comparison 2: standard RUTF provided at a dose that meets total daily nutritional requirements versus as a supplement to the usual diet
Two quasi‐randomised, cluster trials that used systematic sequence‐generation methods had the following three arms:
standard RUTF meeting total daily nutritional requirements;
a similar RUTF given supplementary to children's usual diet; and
porridge made by caregivers from a maize and soy flour blend as control (Manary 2004; Ndekha 2005).
Below, we compare the standard RUTF (total daily requirements) with RUTF as a supplement (213 children in total; effective sample size = 210). Manary 2004 included only HIV‐uninfected children while Ndekha 2005 only assessed HIV‐infected children.
Primary outcomes
Recovery during intervention
Both studies in this comparison measured recovery, defined as WHZ more than 0 (Manary 2004), and 100% weight for height (Ndekha 2005). Children who received standard RUTF were more likely to recover than those who received it as a supplement (RR 1.41, 95% CI 1.19 to 1.68; n = 210; Analysis 2.1). There was no significant heterogeneity between the studies (Chi2 = 0.37; df = 1; P value = 0.54; I2 = 0%).
2.1. Analysis.
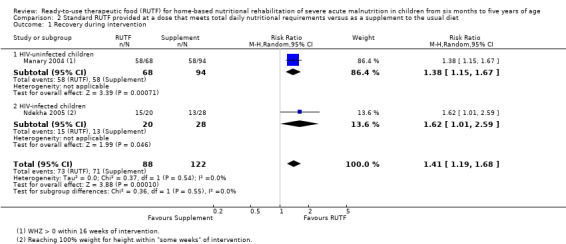
Comparison 2 Standard RUTF provided at a dose that meets total daily nutritional requirements versus as a supplement to the usual diet, Outcome 1 Recovery during intervention.
Subgroup analysis
Recovery was in favour of standard RUTF in both the HIV‐uninfected (RR 1.38, 95% CI 1.15 to 1.67; 1 trial, n = 162; Manary 2004) and HIV‐infected (RR 1.62, 95% CI 1.01 to 2.59; 1 trial, n = 48; Ndekha 2005) subgroups.
Relapse during intervention
Both Manary 2004 and Ndekha 2005 measured relapse (admission to hospital) during the intervention period. Pooled results indicated that standard RUTF significantly reduced relapse compared to the supplementary group (RR 0.11, 95% CI 0.01 to 0.85; n = 210; Analysis 2.2), with no significant heterogeneity between the studies (Chi2 = 0.30; df = 1; P value = 0.58; I2 = 0%).
2.2. Analysis.
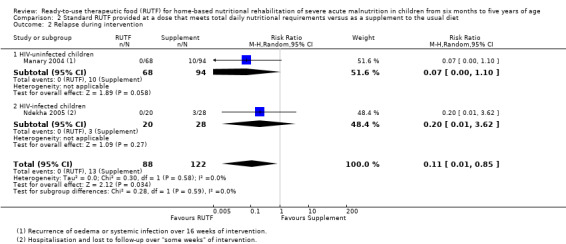
Comparison 2 Standard RUTF provided at a dose that meets total daily nutritional requirements versus as a supplement to the usual diet, Outcome 2 Relapse during intervention.
Subgroup analysis
When we separated the results into subgroups based on HIV status, there was no significant difference in relapse detected between the two groups in both HIV‐uninfected (RR 0.07, 95% CI 0.00 to 1.10; 1 trial, n = 162; Manary 2004), and HIV‐infected (RR 0.20, 95% CI 0.01 to 3.62; 1 trial, n = 48; Ndekha 2005), children.
Mortality during intervention
When comparing the standard RUTF with the RUTF supplement group (Manary 2004; Ndekha 2005), we detected no significant difference in mortality (RR 1.36, 95% CI 0.46 to 4.04; n = 210; Analysis 2.3), and there was no significant heterogeneity between the studies (Chi2 = 0.36; df = 1; P value = 0.55; I2 = 0%).
2.3. Analysis.
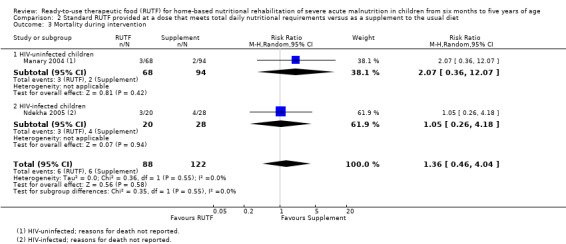
Comparison 2 Standard RUTF provided at a dose that meets total daily nutritional requirements versus as a supplement to the usual diet, Outcome 3 Mortality during intervention.
Subgroup analysis
We detected no significant difference in mortality when assessing results for the subgroups of HIV‐uninfected (RR 2.07, 95% CI 0.36 to 12.07; 1 trial, n = 162; Manary 2004) and HIV‐infected (RR 1.05, 95% CI 0.26 to 4.18; 1 trial, n = 48; Ndekha 2005) children.
Secondary outcomes
Rate of weight gain during intervention
Both studies in this comparison measured weight gain during the first four weeks of the intervention period (Manary 2004; Ndekha 2005). We pooled the results in a meta‐analysis and found no significant difference in weight gain between the standard RUTF and the RUTF supplement group (MD 1.21 g/kg/day, 95% CI −0.74 to 3.16; 2 studies, n = 206; Analysis 2.4), with substantial heterogeneity between the studies (Chi2 = 4.26; df = 1; P value = 0.04; I2 = 76%).
2.4. Analysis.
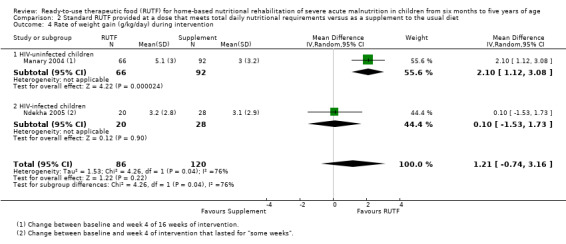
Comparison 2 Standard RUTF provided at a dose that meets total daily nutritional requirements versus as a supplement to the usual diet, Outcome 4 Rate of weight gain (g/kg/day) during intervention.
Subgroup analysis
Subgroup analysis with respect to HIV status found that HIV‐uninfected children in the standard RUTF group gained significantly more weight compared to the RUTF supplement group (MD 2.10 g/kg/day, 95% CI 1.12 to 3.08; 1 trial, n = 158; Manary 2004); however, for HIV‐infected children, there was no significant difference in weight gain between the two groups (MD 0.10 g/kg/day, 95% CI −1.53 to 1.73; 1 trial, n = 48; Ndekha 2005).
Time to recovery (days) during intervention
Among HIV‐uninfected children who recovered, those who received standard RUTF recovered more rapidly than children in the RUTF supplement group (MD −10.0 days, 95% CI −19.13 to −0.87; 1 trial, n = 116; see the illustrative forest plot in Analysis 2.5; Manary 2004). Among all HIV‐infected participants in Ndekha 2005, those in the standard RUTF group recovered within a median of 71 days (interquartile range 42 to 125) compared to the RUTF supplement group, which required a median of 115 days (interquartile range 59 to 195; P value not reported in the article).
2.5. Analysis.
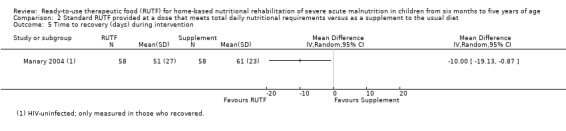
Comparison 2 Standard RUTF provided at a dose that meets total daily nutritional requirements versus as a supplement to the usual diet, Outcome 5 Time to recovery (days) during intervention.
Anthropometrical status
Weight‐for‐height z scores (WHZ) at follow‐up
One trial, Manary 2004, followed up HIV‐uninfected children who recovered and were discharged from the study for six months. We obtained the results (as end values) from the study author, which indicated that there was no significant difference in WHZ between children who received standard RUTF and those who received a similar RUTF as a supplement (MD 0.10, 95% CI −0.36 to 0.56; n = 72; Analysis 2.6).
2.6. Analysis.
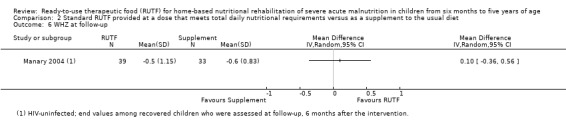
Comparison 2 Standard RUTF provided at a dose that meets total daily nutritional requirements versus as a supplement to the usual diet, Outcome 6 WHZ at follow‐up.
Length/height gain during intervention
HIV‐uninfected children receiving standard RUTF gained more height than the children who received the RUTF as a supplement (MD 0.20 mm/day, 95% CI 0.00 to 0.40; 1 trial, n = 48; see the illustrative forest plot in Analysis 2.7; Ndekha 2005).
2.7. Analysis.
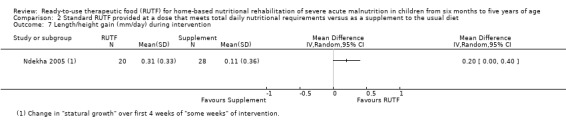
Comparison 2 Standard RUTF provided at a dose that meets total daily nutritional requirements versus as a supplement to the usual diet, Outcome 7 Length/height gain (mm/day) during intervention.
Manary 2004 also reported height gain (mm/day), but provided results in a bar chart format and not as numerical data.
Mid‐upper arm circumference (MUAC) gain during intervention
We detected no significant difference in MUAC gain during the first four weeks of the intervention period between the two intervention groups (MD 0.11 mm/day, 95% CI −0.01 to 0.22; 2 studies, n = 173; Analysis 2.8;Manary 2004; Ndekha 2005), and no significant heterogeneity between the studies (Chi2 = 1.35; df = 1; P value = 0.25; I2 = 26%). When we separated the results by HIV status, in HIV‐uninfected children, the standard RUTF group had significantly higher MUAC gain than those in the RUTF supplement group (MD 0.15 mm/day, 95% CI 0.03 to 0.27; 1 trial, n = 125; Manary 2004), while in HIV‐infected children, there was no significant difference between the intervention groups (MD 0.03 mm/day, 95% CI −0.14 to 0.20; 1 study n = 48; Ndekha 2005).
2.8. Analysis.
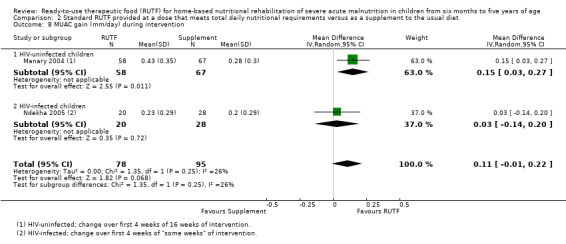
Comparison 2 Standard RUTF provided at a dose that meets total daily nutritional requirements versus as a supplement to the usual diet, Outcome 8 MUAC gain (mm/day) during intervention.
Cognitive function and development
No study presented data for this outcome.
Adverse outcomes
Both studies reported on adverse outcomes (Manary 2004; Ndekha 2005).
In HIV‐uninfected children (Manary 2004), the standard RUTF group (n = 68) had diarrhoea on 74/1959 days (3.8%) compared to 181/2565 days (7.1%) in the RUTF supplement group (n = 94). This outcome refers to the number of days children had diarrhoea, and not the number of children who had diarrhoea. Therefore, we could not adjust the data for clustering and thus could not calculate the treatment effect from these two studies.
In HIV‐infected children, Ndekha 2005 measured the "prevalence of diarrhoea": days of diarrhoea divided by the "total days" during the first two weeks of the intervention period. Study authors reported that children in the standard RUTF group had diarrhoea on 19 of the 304 evaluation days while those in the RUTF supplement group had diarrhoea on 38 of the 432 days. We were unsure about the meaning of "total days" as the figures did not correspond to the total number of days of each participant for each group. Since the corresponding numbers of participants were not reported, we could not calculate a treatment effect.
Acceptability of RUTF
No study provided data on this outcome.
Comparison 3: standard RUTF versus RUTF using an alternative formulation
Seven studies with a total of 5502 children (effective sample size = 4456) evaluated the effects of RUTF versus other types of RUTF (Bahwere 2014; Hsieh 2015a; Irena 2015; Jones 2015; Kerac 2009; Oakley 2010; Sigh 2018). A further study that randomised 148 children also addressed this comparison but only measured acceptability (Hsieh 2015b). All but one study randomised participants individually; Irena 2015 was a cluster‐randomised trial.
Primary outcomes
Recovery during intervention
Six studies measured recovery in different ways: Bahwere 2014 as weight gain of 15% or more of baseline weight; Irena 2015 as weight gain of 18% or more of baseline weight together with the absence of complications and MUAC more than 110 mm; Hsieh 2015a as MUAC more than 12.4 cm without oedema; Kerac 2009 as WHZ of 80% or more for two consecutive visits; and Oakley 2010 as having a WHZ more than −2 and no oedema. Jones 2015 also measured recovery but did not report the results in the manuscript. We obtained the data and definition from the study authors: MUAC more than 11.5 cm or WHZ more than −3 or no oedema (depending on admission criteria) on two consecutive visits. We pooled the data from these six studies in a meta‐analysis and found no significant difference in recovery between the two groups who received different formulations of RUTF (RR 1.03, 95% CI 0.99 to 1.08; n = 4188; Analysis 3.1; Figure 6). We detected no significant heterogeneity between these studies (Chi2 = 6.32; df = 5; P value = 0.28; I2 = 21%).
3.1. Analysis.
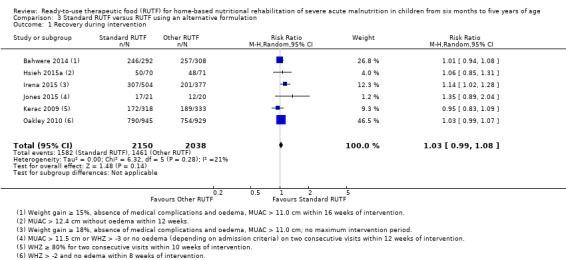
Comparison 3 Standard RUTF versus RUTF using an alternative formulation, Outcome 1 Recovery during intervention.
6.
Forest plot of Comparison 3. Standard RUTF versus RUTF using an alternative formulation, outcome: 3.1 recovery during intervention
Subgroup and sensitivity analysis
When exploring subgroups based on pre‐trial hospitalisation, we found no significant difference in recovery during the intervention between the different types of RUTF, in each of the subgroups. Overall, there was no difference between the subgroups (Chi2 = 1.94, df = 2; P 0.38; I2 = 0%; Analysis 3.2).
3.2. Analysis.
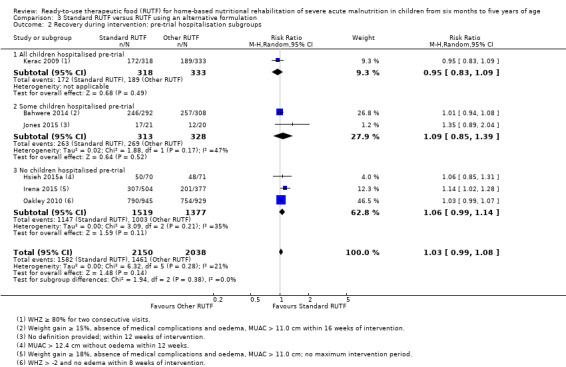
Comparison 3 Standard RUTF versus RUTF using an alternative formulation, Outcome 2 Recovery during intervention: pre‐trial hospitalisation subgroups.
A sensitivity analysis of studies at low risk of bias (Bahwere 2014; Jones 2015; Kerac 2009; Oakley 2010), only showed no difference between the different types of RUTF formulations (RR 1.02, 95% CI 0.99 to 1.06; n = 3166; Chi2 = 3.03, df = 3; P = 0.39; I2 = 1%; 4 studies; analysis not shown), which is in line with the overall pooled effect estimate. A sensitivity analysis with individually randomised studies (all studies for this outcome except for Irena 2015), also showed no difference between the groups (RR 1.02, 95% CI 0.99 to 1.06; 5 studies, n = 3307; Chi2 = 3.10, df = 4; P = 0.54; I2 = 0%; analysis not shown) while a sensitivity analysis of the cluster‐randomised trial (Irena 2015), showed a difference in favour of the standard RUTF (RR 1.14, 95% CI 1.02 to 1.28; 1 trial, n = 881; analysis not shown).
Relapse during intervention
Six studies defined relapse in different ways: Bahwere 2014 and Irena 2015 defined relapse as being absent for three consecutive visits and could not be traced; Hsieh 2015a and Jones 2015 as loss to follow‐up after 12 weeks; Kerac 2009 as defaulters, readmissions to inpatient care and lost to follow‐up; and Oakley 2010 as remaining wasted after two consecutive visits. We pooled these six studies in a meta‐analysis and found that the standard RUTF significantly reduced relapse (RR 0.84, 95% CI 0.72 to 0.98; n = 4188; Analysis 3.3), with no significant heterogeneity between these studies (Chi2 = 3.79; df = 5; P value = 0.58; I2 = 0%).
3.3. Analysis.
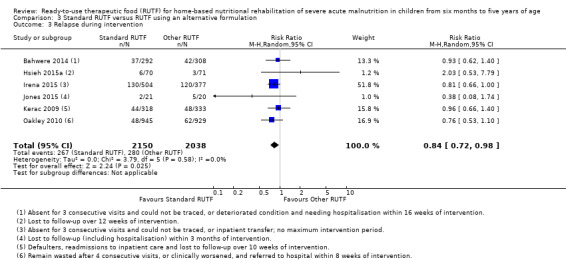
Comparison 3 Standard RUTF versus RUTF using an alternative formulation, Outcome 3 Relapse during intervention.
Subgroup and sensitivity analysis
When exploring subgroups based on pre‐trial hospitalisation, we found no significant difference in relapse during the intervention between the different types of RUTF, in each of the subgroups. Overall, there was no difference between the subgroups (Chi2 = 0.62, df = 2; P 0.73; I2 = 0%; Analysis 3.4).
3.4. Analysis.
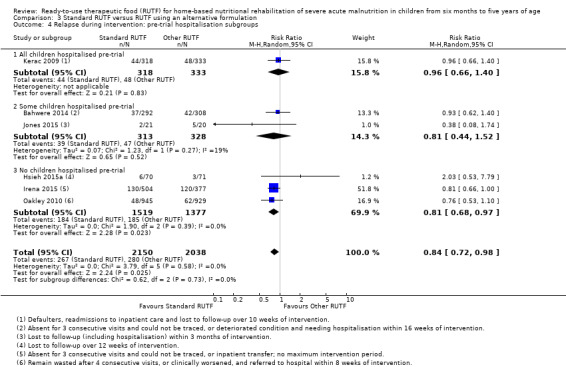
Comparison 3 Standard RUTF versus RUTF using an alternative formulation, Outcome 4 Relapse during intervention: pre‐trial hospitalisation subgroups.
A sensitivity analysis of studies at low risk of bias (Bahwere 2014; Jones 2015; Kerac 2009; Oakley 2010), only showed no difference between the different types of RUTF formulations (RR 0.86, 95% CI 0.69 to 1.07; n = 3166; Chi2 = 1.99, df = 3; P = 0.57; I2 = 0%, 4 studies; analysis not shown), which is not in line with the overall pooled effect estimate. A sensitivity analysis with individually randomised studies (all studies for this outcome except Irena 2015), also showed no difference between the groups (RR 0.88, 95% CI 0.71 to 1.09; 5 studies, n = 3307; Chi2 = 3.52, df = 4; P = 0.48; I2 = 0%; analysis not shown), while the cluster‐randomised trial, Irena 2015, had a similar result to the overall pooled effect estimate (RR 0.81, 95% CI 0.66 to 1.0; 1 trial, n = 881; analysis not shown).
Mortality during intervention
We did not find a significant difference in the number of deaths between the standard and the other RUTFs (RR 1.00, 95% CI 0.80 to 1.24; 7 studies, n = 4309; Analysis 3.5; Bahwere 2014; Hsieh 2015a; Irena 2015; Jones 2015; Kerac 2009; Oakley 2010; Sigh 2018), and detected no significant heterogeneity between studies (Chi2 = 6.60; df = 6; P value = 0.36; I2 = 9%).
3.5. Analysis.
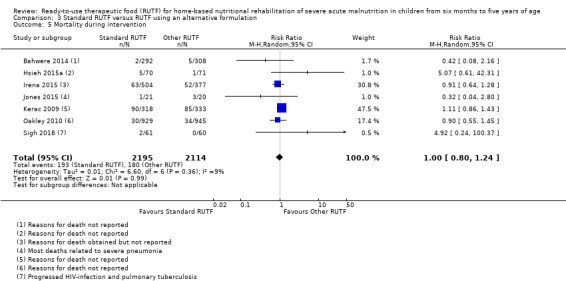
Comparison 3 Standard RUTF versus RUTF using an alternative formulation, Outcome 5 Mortality during intervention.
Subgroup and sensitivity analysis
When exploring subgroups based on pre‐trial hospitalisation, we found no significant difference in mortality during the intervention between the different types of RUTF in each of the subgroups. Overall, there was no difference between the subgroups (Chi2 = 1.16, df = 2; P 0.56; I2 = 0%; Analysis 3.6).
3.6. Analysis.
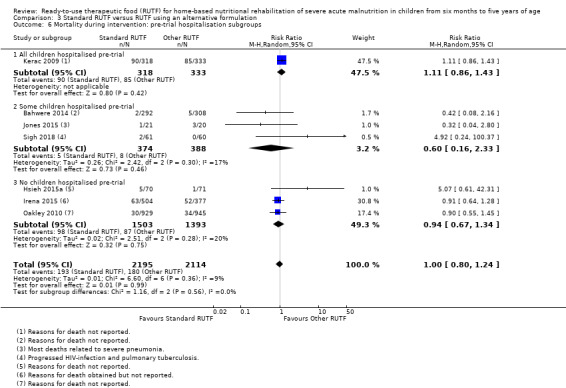
Comparison 3 Standard RUTF versus RUTF using an alternative formulation, Outcome 6 Mortality during intervention: pre‐trial hospitalisation subgroups.
A sensitivity analysis of studies at low risk of bias (Bahwere 2014; Jones 2015; Kerac 2009; Oakley 2010), only showed no difference between the different types of RUTF formulations (RR 1.03, 95% CI 0.82 to 1.28; n = 3166; Chi2 = 2.95, df = 3; P = 0.4; I2 = 0%; 4 studies; analysis not shown), which is in line with the overall pooled effect estimate. A sensitivity analysis with individually randomised studies (all studies for this outcome except Irena 2015), also showed no difference between the groups (RR 1.02, 95% CI 0.73 to 1.43; 6 studies, n = 3428; Chi2 = 6.06, df = 5; P = 0.3; I2 = 18%; analysis not shown) and we obtained a similar result for Irena 2015, the cluster‐randomised trial (RR 0.91, 95% CI 0.64 to 1.28; 1 trial, n = 881; analysis not shown).
Secondary outcomes
Rate of weight gain during intervention
Six studies measured weight gain (g/kg/day) (Bahwere 2014; Hsieh 2015a; Irena 2015; Kerac 2009; Oakley 2010; Sigh 2018). Bahwere 2014 did not report SD, but we obtained them from the study authors. There was no significant difference between the different RUTF groups (MD 0.11 g/kg/day, 95% CI −0.32 to 0.54; n = 3807; Analysis 3.7), with significant heterogeneity between the studies (Chi2 = 19.17; df = 5; P value = 0.002; I2 = 74%).
3.7. Analysis.
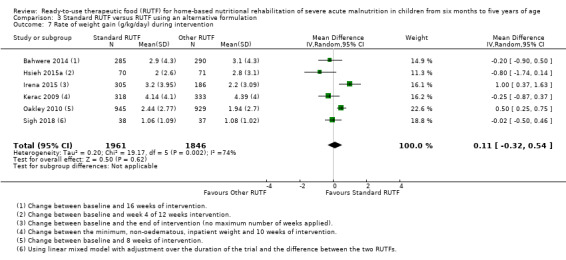
Comparison 3 Standard RUTF versus RUTF using an alternative formulation, Outcome 7 Rate of weight gain (g/kg/day) during intervention.
Subgroup and sensitivity analysis
We found no significant difference in rate of weight gain during the intervention between the different types of RUTF, in each of the subgroups, and no significant difference across pre‐trial hospitalisation subgroups (Chi2 = 1.48; df = 2; P value = 0.48; I2 = 0%; Analysis 3.8), where all children were stabilised as inpatients pre‐trial, where some children were hospitalised before the trial, and no children were hospitalised pre‐trial.
3.8. Analysis.
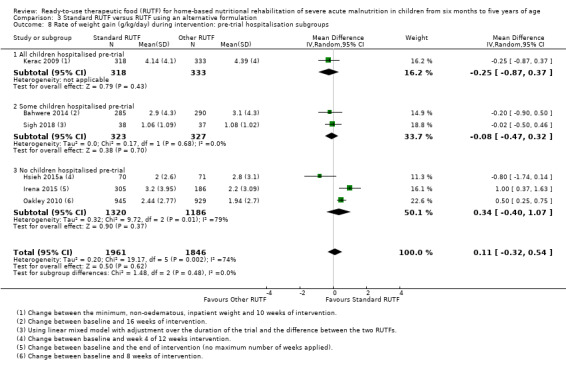
Comparison 3 Standard RUTF versus RUTF using an alternative formulation, Outcome 8 Rate of weight gain (g/kg/day) during intervention: pre‐trial hospitalisation subgroups.
When performing subgroup analyses for different types of RUTFs, we found significant differences across subgroups (Chi2 = 5.63; df = 2; P value = 0.06; I2 = 64.5%), but did not find a difference in favour of standard or other formulations of RUTF combined (Analysis 3.9).
3.9. Analysis.
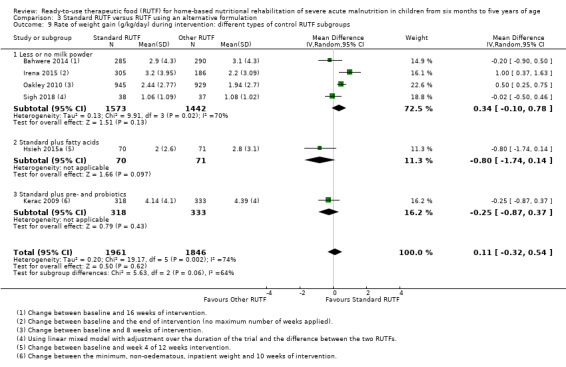
Comparison 3 Standard RUTF versus RUTF using an alternative formulation, Outcome 9 Rate of weight gain (g/kg/day) during intervention: different types of control RUTF subgroups.
Less or no milk powder subgroup: MD 0.34 (95% CI −0.10 to 0.78; 4 studies, n = 3015), with significant heterogeneity (Chi2 = 9.91; df = 3; P value = 0.002; I2 = 70%)
Fatty acids subgroup: MD −0.80 (95% CI −1.74 to 0.14; 1 trial, n = 141; Hsieh 2015a)
Pre‐ and probiotic subgroup: MD −0.25 (95% CI −0.87 to 0.37; 1 trial, n = 651; Kerac 2009).
Data did not allow us to perform a subgroup analysis by HIV status because the only study (Kerac 2009), in this comparison, that performed HIV tests on almost all participant children, did not report the results separately for HIV‐infected and uninfected children in the subgroup of the study eligible to our review (participants aged 6 to 60 months, see table of Characteristics of included studies for more information on Kerac 2009), for this outcome.
A sensitivity analysis with studies at low risk of bias only (Bahwere 2014; Kerac 2009; Oakley 2010), showed no difference between the different types of RUTF formulations (MD 0.09, 95% CI −0.48 to 0.65; n = 3100; Chi2 = 7.32, df = 2; P = 0.03; I2 = 73%; 3 studies; analysis not shown), which is in line with the overall pooled effect estimate. A sensitivity analysis with individually randomised trials (all studies for this outcome except Irena 2015), also showed no difference between the groups (MD −0.05, 95% CI −0.5 to 0.4; 5 studies, n = 3316; Chi2 = 13.91, df = 4; P = 0.008; I2 = 71%; analysis not shown), while the cluster‐randomised trial (Irena 2015), found a difference in favour of the standard RUTF (MD 1.00, 95% CI 0.37 to 1.63; 1 trial, n = 491; analysis not shown).
Time to recovery (days) during intervention
Three studies, Bahwere 2014, Irena 2015 and Kerac 2009, measured this outcome in all children, with Irena 2015 also reporting results for the subgroup of children who recovered.
Bahwere 2014 measured time to recovery in days, in all children, during the 16 weeks of intervention. Using the information provided in the trial, we calculated the effect size and found no significant difference between the two RUTF groups (MD 1.90 days, 95% CI −0.82 to 4.62; n = 595; Analysis 3.10).
3.10. Analysis.
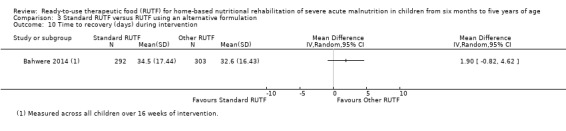
Comparison 3 Standard RUTF versus RUTF using an alternative formulation, Outcome 10 Time to recovery (days) during intervention.
Irena 2015 reported a length of stay of 35 days (interquartile range 23 to 49) in the standard RUTF group compared to 35 days (interquartile range 21 to 56) in the other RUTF group, with no significant difference between the groups (P = 0.49). Among the children who recovered, the median length of stay in the standard RUTF group was 35 days (interquartile range 28 to 52) and 47 days (interquartile range 29 to 70) in the RUTF with specific fatty acids group (P value < 0.001; exact P value not reported).
Kerac 2009 reported median days to cure in the eligible subgroup (n = 651) and found no difference (P = 0.66) between the standard RUTF group (median = 38 days; interquartile range 34 to 47) and the RUTF with fatty acids group (median = 37 days; interquartile range 34 to 48).
Anthropometrical status
Weight‐for‐height z score (WHZ) during intervention
Two studies measured WHZ scores after eight weeks of intervention (Oakley 2010; Sigh 2018), while one trial, Hsieh 2015a, measured the same outcome after 12 weeks of intervention. After pooling the results in a meta‐analysis, we found no significant difference between the groups (MD −0.13, 95% CI ‐0.36 to 0.09; 3 studies, n = 2090; Analysis 3.11), but there was significant heterogeneity between the studies (Chi2 = 5.48; df = 2; P value = 0.06; I2 = 63%).
3.11. Analysis.
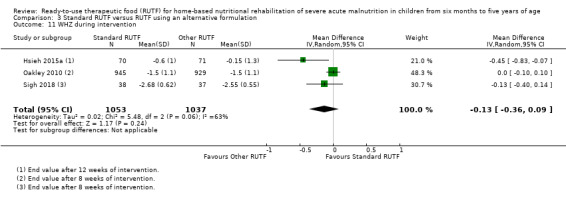
Comparison 3 Standard RUTF versus RUTF using an alternative formulation, Outcome 11 WHZ during intervention.
Another trial, Jones 2015, also measured this outcome and we obtained the change in WHZ score after 12 weeks of intervention from the study authors. The median change in the standard RUTF group (n = 17) was 1.68 (interquartile range 1.17 to 2.73) compared to 1.80 (interquartile range 1.24 to 2.78) in the control RUTF containing specific fatty acids (n = 12).
Subgroup analysis
In a subgroup analysis, we found no difference between the group in which some children were hospitalised before the study for stabilisation versus the group in which no children were hospitalised before the study for stabilisation (Chi2 = 0.05; df = 1; P value = 0.83; I2 = 0%; 3 studies, n = 2090; Analysis 3.12). However, in another subgroup analysis, we detected a significant difference (Chi2 = 4.67; df = 1; P value = 0.03; I2 = 78.6%; Analysis 3.13), between studies where the control RUTF had less or no milk powder (MD −0.02, 95% CI −0.11 to 0.08; 2 studies, n = 1949; Chi2 = 0.81; df = 1; P value = 0.37; I2 = 0%; Oakley 2010; Sigh 2018), versus studies where the control RUTF was a standard formulation with specific fatty acids (MD −0.45, 95% CI −0.83 to −0.07; 1 trial, n = 141; Hsieh 2015a).
3.12. Analysis.
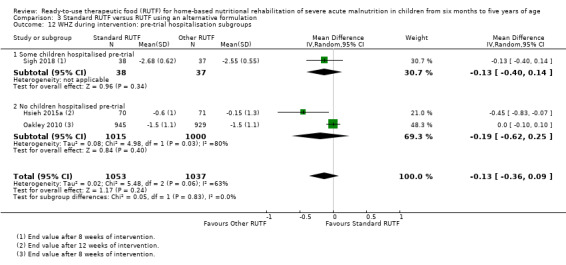
Comparison 3 Standard RUTF versus RUTF using an alternative formulation, Outcome 12 WHZ during intervention: pre‐trial hospitalisation subgroups.
3.13. Analysis.
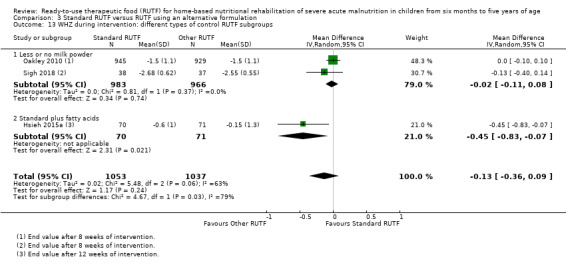
Comparison 3 Standard RUTF versus RUTF using an alternative formulation, Outcome 13 WHZ during intervention: different types of control RUTF subgroups.
Weight‐for‐age z score (WAZ) during intervention
Two studies, Oakley 2010 and Sigh 2018, measured WAZ and reported it as end values at the end of eight weeks of intervention. We combined the data from both studies in a meta‐analysis and found no significant difference between the standard and other RUTF groups (MD 0.07, 95% CI −0.06 to 0.20; n = 1949), with no significant heterogeneity between the studies (Chi2 = 1.13; df = 1; P value = 0.29; I2 = 12%; Analysis 3.14).
3.14. Analysis.
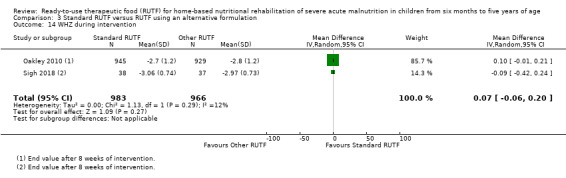
Comparison 3 Standard RUTF versus RUTF using an alternative formulation, Outcome 14 WHZ during intervention.
Length/height gain (mm/day) during intervention
Two studies measured length/height gain across eight weeks of intervention (Oakley 2010; Sigh 2018 ), while one study measured the same outcome over 12 weeks of intervention (Hsieh 2015a). After pooling the results in a meta‐analysis, we found no significant difference between the groups (MD 0.01, 95% CI −0.09 to 0.10; 3 studies, n = 2090; Analysis 3.15), but there was significant heterogeneity (Chi2 = 4.85; df = 2; P value = 0.09; I2 = 59%).
3.15. Analysis.
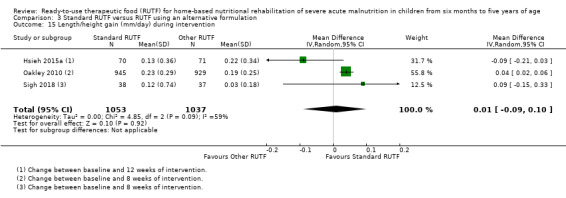
Comparison 3 Standard RUTF versus RUTF using an alternative formulation, Outcome 15 Length/height gain (mm/day) during intervention.
Subgroup analysis
We found no significant difference between subgroups in which either some or no children were hospitalised before the study for stabilisation (Chi2 = 0.54; df = 1; P value = 0.46; I2 = 0%; 3 studies, n = 2090; Analysis 3.16). However, we detected a significant difference (Chi2 = 4.69; df = 1; P value = 0.03; I2 = 78.7%; Analysis 3.17) between studies where the control RUTF had less or no milk powder (MD 0.04, 95% CI 0.02 to 0.06; 2 studies, n = 1949; Chi2 = 0.16; df = 1; P value = 0.69; I2 = 0%; Oakley 2010; Sigh 2018) versus studies where the control RUTF was a standard formulation with specific fatty acids (MD −0.09, 95% CI −0.21 to 0.03; 1 trial, n = 141; Hsieh 2015a).
3.16. Analysis.
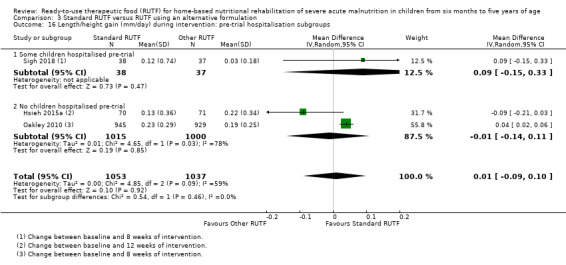
Comparison 3 Standard RUTF versus RUTF using an alternative formulation, Outcome 16 Length/height gain (mm/day) during intervention: pre‐trial hospitalisation subgroups.
3.17. Analysis.
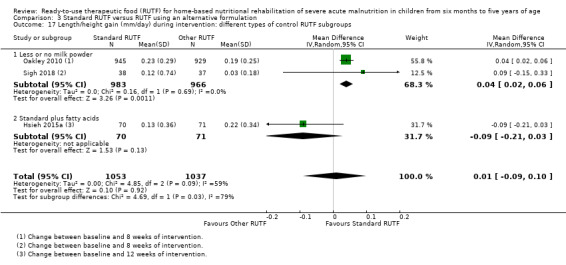
Comparison 3 Standard RUTF versus RUTF using an alternative formulation, Outcome 17 Length/height gain (mm/day) during intervention: different types of control RUTF subgroups.
Height‐for‐age z score (HAZ) during intervention
When comparing the end values after eight weeks of intervention between standard RUTF and RUTFs with less (Oakley 2010), or no (Sigh 2018), milk powder, we detected no significant difference in HAZ (MD 0.09, 95% CI −0.04 to 0.22; n = 1949; Analysis 3.18), with no significant heterogeneity (Chi2 = 0.14; df = 1; P value = 0.71; I2 = 0%).
3.18. Analysis.
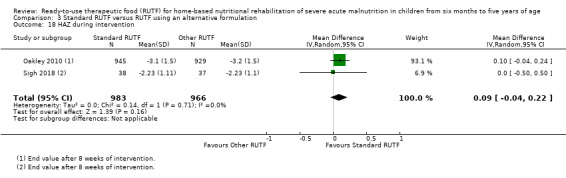
Comparison 3 Standard RUTF versus RUTF using an alternative formulation, Outcome 18 HAZ during intervention.
Another trial, Jones 2015, also measured this outcome and we obtained the change in length/height for age after 12 weeks of intervention from the study authors. The median change in the standard RUTF group (n = 18) was 0.18 cm (interquartile range −0.38 to 0.47) compared to 0.34 cm (interquartile range 0.04 to 0.49) in the control RUTF containing specific fatty acids (n = 12).
Mid‐upper arm circumference (MUAC) gain during intervention
Two studies measured MUAC gain in mm/day after eight weeks of intervention (Oakley 2010; Sigh 2018), while one study measured the same outcome after four weeks of intervention (Hsieh 2015a). After pooling the results in a meta‐analysis, we found no significant difference between the groups (MD 0.02, 95% CI −0.02 to 0.07; 3 studies, n = 2089; Analysis 3.19), and there was significant heterogeneity (Chi2 = 4.67; df = 2; P value = 0.10; I2 = 57%).
3.19. Analysis.
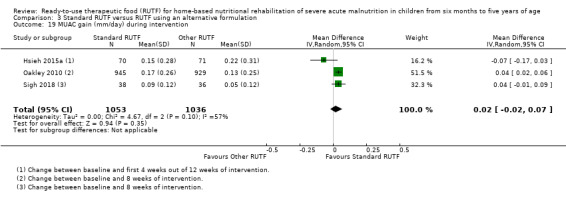
Comparison 3 Standard RUTF versus RUTF using an alternative formulation, Outcome 19 MUAC gain (mm/day) during intervention.
For one trial, Jones 2015, we obtained data for the change in mm/day after 12 weeks of intervention from the study authors. The median change in the standard RUTF group (n = 18) was 0.022 mm/day (interquartile range 0.02 to 0.04) compared to 0.029 mm/day (0.02 to 0.02) in the control RUTF with specific fatty acids (n = 12).
Subgroup analysis
In a subgroup analysis, we found no significant difference between subgroups in which either some or no children were hospitalised before the study for stabilisation (Chi2 = 0.53; df = 1; P value = 0.47; I2 = 0%; 3 studies, n = 2089; Analysis 3.20). However, we detected a significant difference (Chi2 = 4.67; df = 1; P value = 0.03; I2 = 78.6%; Analysis 3.21) between studies where the control RUTF had less or no milk powder (MD 0.04, 95% CI 0.02 to 0.06; 2 studies, n = 1948; Chi2 = 0.00; df = 1; P value = 1.00; I2 = 0%; Oakley 2010; Sigh 2018) versus studies where the control RUTF was a standard formulation but containing specific fatty acids (MD −0.07, 95% CI −0.17 to 0.03; 1 trial, n = 141; Hsieh 2015a).
3.20. Analysis.
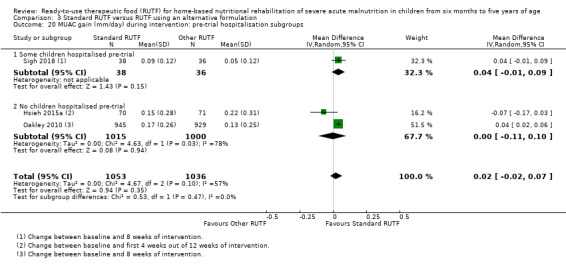
Comparison 3 Standard RUTF versus RUTF using an alternative formulation, Outcome 20 MUAC gain (mm/day) during intervention: pre‐trial hospitalisation subgroups.
3.21. Analysis.
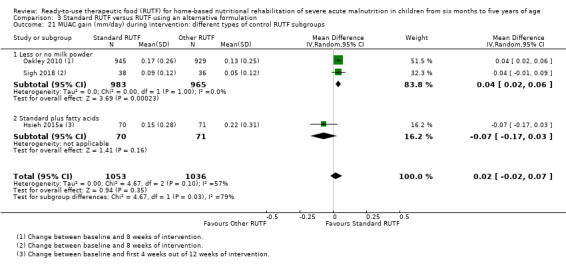
Comparison 3 Standard RUTF versus RUTF using an alternative formulation, Outcome 21 MUAC gain (mm/day) during intervention: different types of control RUTF subgroups.
Cognitive function and development
No study provided data for this outcome.
Adverse outcomes
Four studies reported adverse outcomes (Bahwere 2014; Hsieh 2015b; Jones 2015; Oakley 2010).
Bahwere 2014 reported no significant difference in the proportion of children with a history of diarrhoea during the first weekly follow‐up visit (RR 0.80, 95% CI 0.55 to 1.15, n = 549; Analysis 3.22). The overall incidence rate of diarrhoea at the end of the intervention period was similar between groups (P = 0.478): standard RUTF = 11.8 episodes per 100 child visits (range = 142 to 1198); and other RUTF group = 11.5 episodes per 100 child visits (range 146 to 1270).
3.22. Analysis.
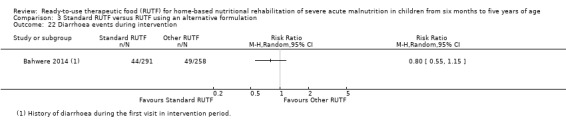
Comparison 3 Standard RUTF versus RUTF using an alternative formulation, Outcome 22 Diarrhoea events during intervention.
Hsieh 2015a reported finding no "adverse reactions" to any of the study foods, while Jones 2015 reported that no "adverse events" were considered to be directly related to the RUTFs and found no significant difference in total illness episodes (P = 0.27) or diarrhoea (P = 0.75) between the experimental and control groups.
Oakley 2010 asked caregivers at every fortnightly visit whether the child had had diarrhoea in the previous two weeks, but did not report the results.
Acceptability
Five studies reported on acceptability (Bahwere 2014; Hsieh 2015b; Irena 2015; Jones 2015; Sigh 2018).
Hsieh 2015b only measured acceptability as an outcome; it is reported in the same article as Hsieh 2015a. They found no significant difference in the proportion of children giving the highest RUTF likeability score between the standard RUTF and the RUTF with omega‐3 fatty acids groups (RR 1.08, 95% CI 0.94 to 1.26, n = 148; Analysis 3.23). However, significantly less food remained after the taste test among the standard RUTF compared to the omega‐3 RUTF groups (MD −2.40 g, 95% CI −4.50 to −0.30; n = 148; Analysis 3.24; Hsieh 2015b).
3.23. Analysis.
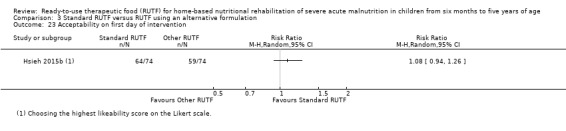
Comparison 3 Standard RUTF versus RUTF using an alternative formulation, Outcome 23 Acceptability on first day of intervention.
3.24. Analysis.
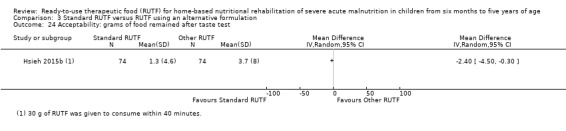
Comparison 3 Standard RUTF versus RUTF using an alternative formulation, Outcome 24 Acceptability: grams of food remained after taste test.
Sigh 2018 used a five‐point hedonic rating scale to rate how many participants (according to the caregivers) liked or disliked their allocated RUTF. A score of 1 indicated that the child liked the product very much ('very good'); 2 indicated 'good'; 3 indicated 'neutral'; 4 indicated 'bad'; and 5 indicated 'very bad'. Acceptability was seen as having a score of 1, 2 or 3. The median score on this scale was 2.0 (interquartile range 2.00 to 3.00) for the standard RUTF and 2.0 (interquartile range 2.0 to 4.0) for the fish‐based RUTF. At the first two‐weekly visit, the study authors found standard RUTF to be more acceptable than the fish‐based RUTF (RR 1.29, 95% CI 1.04 to 1.60; n = 78; Analysis 3.25). However, for the following three, two‐weekly visits during the eight‐week treatment period, they detected no difference in likeability between the standard and fish‐based RUTF groups.
3.25. Analysis.
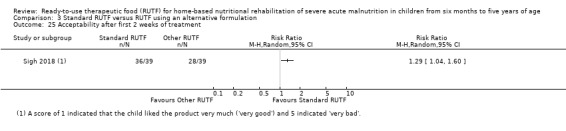
Comparison 3 Standard RUTF versus RUTF using an alternative formulation, Outcome 25 Acceptability after first 2 weeks of treatment.
Jones 2015 (n = 20), measured acceptability as compliance by interview of caregivers and counting full and empty sachets of RUTF at each visit. They reported that the median compliance at the end of the intervention period (day 84) was 90% (interquartile range 80 to 101) in the standard RUTF group compared to 96% (interquartile range 67 to 100) in the group where the RUTF had specific fatty acids (P = 0.98). Sigh 2018 also measured compliance based on "counts of returned RUTF packages" and estimated that 51.7% of participants in the standard RUTF group, compared to 48.1% participants in the fish‐based RUTF group, utilised their RUTF. We could not calculate an effect size here because the sample size per group for this outcome was not reported, and the primary study authors adjusted this finding for age and gender.
In Bahwere 2014 and Irena 2015, caregivers were asked at each visit about the acceptability of the standard RUTF compared to formulations with less or no milk powder; however, the results were not reported.
Discussion
Summary of main results
Our review aimed to assess the effects of home‐based nutritional rehabilitation with RUTF on recovery, relapse, mortality and rate of weight gain in children aged six months to five years with SAM. We found 15 eligible studies, 14 of which contributed to meta‐analyses, and four of which were cluster trials. We addressed three comparisons with a total effective sample size of 6630 children. We judged the overall risk of bias to be high for six studies, unclear for three studies, and low for six studies.
Based on the pooled data from seven studies comparing a standard RUTF at a dosage to meet total daily nutritional requirements with an alternative dietary approach, we conclude that RUTF probably improves recovery from SAM and may increase the rate of weight gain slightly. However, the effects on relapse and mortality are uncertain.
Evidence from two cluster trials indicate that a standard RUTF meeting total daily nutritional requirements, compared with a similar RUTF used as a supplement only, may improve recovery and reduce relapse but its effects on mortality and rate of weight gain are currently unclear.
We found eight studies that compared standard RUTF with RUTFs with alternative formulations (such as using locally available ingredients, containing less or no milk powder, containing specific fatty acids, or with added pre‐ and probiotics), of which only one focused on RUTF acceptability. For recovery from SAM, it appears to make little or no difference what formulation of RUTF is used. In the case of relapse, however, a standard RUTF seems somewhat more effective. For the outcomes of mortality and rate of weight gain, it probably makes little or no difference whether a standard or alternative formulation of RUTF is used.
Overall completeness and applicability of evidence
The studies included in this review have a number of limitations in respect of external validity. We sought to evaluate the best evidence regarding the effects of RUTF as home‐based treatment for children with SAM. A challenge in this was the completeness of reporting, which we feel ranged from poor to moderate reporting. We were able to obtain some supplementary data from the study authors but a number of important information gaps remain. Particularly, it was not always clear whether study participants had been stabilised in hospital prior to home‐based rehabilitation with RUTF (complicated SAM), and whether this was similar across intervention arms. We conducted a subgroup analysis to explore the influence of this factor on the main outcomes across our three comparisons, but this only explained the heterogeneity for the outcome of relapse in Comparison 1. It is plausible that children who first presented with complicated SAM, even though stabilised in hospital, may be more likely to relapse during the rehabilitation phase. However, the current evidence base does not allow for firm conclusions regarding this issue.
Among the included studies, there is a lack of consistent (routine) testing for HIV and tuberculosis, and reporting on other comorbidities, with appropriate stratification and analysis according to infection status. These comorbidities may have considerable impact on growth, immunity and risk of death, and affected children with these comorbidities may respond differently to SAM treatment (Heikens 2008; Jones 2014; Mody 2014; Trehan 2015).
The included studies assessed a wide age range of children with SAM, but data did not allow for exploration of possible differences in effects across age groups. There is also a lack of information regarding the likelihood of sharing RUTF and control diets with the family, and whether the extent of such sharing differed between comparison groups. In addition, the issue of allergies was not sufficiently addressed. In most studies, children were exposed to peanuts or soy, which are known allergens in children, but few studies reported testing for food allergies.
One of the theoretical benefits of RUTF is its low water availability (and therefore lower risk of contamination with microorganisms), which should lead to fewer episodes of diarrhoea. However, not all studies reported on diarrhoea, despite it being one of the biggest causes of mortality in young children. Furthermore, where studies did report on diarrhoea they measured it in different ways, so that we mostly could not pool data across studies.
With the introduction of the WHO Child Growth Standards in 2006 (WHO 2006), and the change in cut‐off for MUAC from 110 mm to 115 mm (Table 4), some children who would have been classified previously as having MAM were classified as SAM (Collins 2006a; Kerac 2009; Seal 2007; WHO/UNICEF 2009). Therefore, studies that were carried out before 2006 (Ciliberto 2005; Manary 2004; Ndekha 2005), or that used older definitions for SAM (Bahwere 2014; Irena 2015; Kerac 2009), or that deviated from the standard WHO definition for SAM (Sigh 2018 used WHZ of −2.8 or less instead of less than −3), included a somewhat different profile of participants than studies using the latest (formal) criteria. Furthermore, and also in the earlier studies, antiretroviral drugs for HIV were not readily available in LMICs, and the lack thereof could have influenced HIV‐infected children's response to treatment for SAM.
We needed to take into account the type of control group against which standard RUTF was compared. Specifically, for Comparison 3 where different RUTF formulations were compared, we found substantial statistical heterogeneity for the rate of weight gain. Exploration of this heterogeneity by subgroup analysis for the type of control RUTF (studies with less or no milk powder; studies with standard formulation but containing omega‐3 fatty acids; studies with standard formulation but with added pre‐ and probiotics) seems to have accounted for the differences in effects. However, this must be viewed with caution given that data for two of the subgroups were derived from only one trial. In Comparison 1, the control groups ‐ being locally available and culturally acceptable foods ‐ differed across studies and could not be subgrouped. However, this resembles 'real life' situations and adds to the generalisability of the findings.
Studies varied in the definition of the main outcome of recovery, and in the duration of the intervention, which could have had an impact on almost all of the review's outcomes. Among the 12 included studies that reported on recovery, only five used the anticipated definition of having a WHZ score of −2 or above (or a similar ≥ 80% weight for height of the National Center for Health Statistics (NCHS) reference population (Hamil 1979)); two studies used 100% weight for height (NCHS reference population); and the other studies used either weight gain percentage from baseline (≥ 15%, ≥ 18%) or MUAC (> 11 cm, > 11.5 cm, > 12.4 cm). Even though we did not detect substantial heterogeneity in the meta‐analyses for recovery (Analysis 1.1; Analysis 2.1; Analysis 3.1), it is possible that the different cut‐offs for recovery influenced the findings.
The probability of a positive outcome for the review's primary outcomes is likely to be higher with a longer intervention period. On the other hand, for the outcome of rate of weight gain (g/kg/day) where the steepest increase occurs in the first weeks of the rehabilitation phase, studies where weight gain was assessed after four weeks of intervention were more likely to yield better results than those where average weight gain was measured over 16 weeks of intervention. We could not determine the potential long‐term effects of RUTF on growth and development as studies generally did not follow up all participants after the end of the intervention period, and no study assessed cognitive function and development, which is important for future school performance.
In summary, the current body of evidence for the three comparisons addressed in this review is insufficient to allow evaluation of applicability of the current findings to children with SAM across different ages and levels of severity of SAM, with and without comorbidity. New research (potentially including the 11 ongoing studies identified in this review) might also influence the findings in future review updates.
Quality of the evidence
We identified selection bias, attrition bias and reporting bias in the included studies as concerns in the majority of the studies. Although we performed sensitivity analyses for the four most important outcomes (Comparisons 1 and 3; data did not allow this for Comparison 2), the interpretation of these are limited due to a relatively small number of studies per comparison and outcome. Using low risk of bias as a marker, the findings of the sensitivity analyses were in line with that of the main analysis for all outcomes, except for relapse in Comparison 3.
For the outcomes of recovery and relapse, a comparison of findings from individually randomised trials with that of cluster‐randomised trials showed no difference between the groups for the individually randomised trials, while the cluster trials found a difference in favour of standard RUTF. For mortality, findings from both types of studies showed no difference between groups, while for rate of weight gain in Comparison 1 the findings from both types of studies favoured RUTF. In Comparison 3, the findings from individually randomised trials showed no difference between groups, whereas the findings from the cluster trials favoured RUTF.
Another issue, in terms of the outcomes evaluated, is that while we wanted to report on change from baseline for all continuous outcomes, this was not always possible due to a lack of required information (for example, values at baseline and SD of change). In such cases, we assessed the difference in outcomes between comparison groups at the end of the intervention period. This approach, however, was not ideal given that studies were generally small and many were at high or unclear risk of selection bias.
In our GRADE assessments (Table 1; Table 2; Table 3), we judged the quality of the evidence for the majority of outcomes (eight) to be very low or low. We judged the quality of the evidence to be moderate for two outcomes and high for two outcomes. Our reasons for downgrading the quality of the evidence varied between comparisons; for Comparisons 1 and 2 we downgraded for risk of bias, indirectness, inconsistency and imprecision; while for Comparison 3 we downgraded for inconsistency and imprecision.
The results of our subgroup analyses should be interpreted with caution, as they were based on a smaller number of studies. Also, our main subgroup analysis on pre‐trial hospitalisation was not decided a priori. The results of our sensitivity analyses should also be interpreted with caution, as they are likely underpowered to detect differences between experimental and control interventions. This might also be the reason why the effect of the intervention was not statistically significant in some cases.
Potential biases in the review process
It is unlikely that we have missed any relevant studies since, aside from our electronic searches without any language restriction, we also screened reference lists of included studies and relevant reviews and contacted the corresponding authors of included and ongoing studies (and some of the excluded studies) as well as professionals working in the field.
In our 2013 review (Schoonees 2013), there were two ongoing studies with the same contact author from whom we could not obtain information on study completion or a (published or unpublished) manuscript. The author of another study did not provide us with the manuscript after having indicated an intention to do so. Furthermore, not all studies measured or reported data on recovery, relapse, mortality or rate of weight gain that could be included in a meta‐analysis. This was especially problematic in Comparison 1 where, although six of seven studies provided data for the meta‐analysis on recovery, we were able to pool data for relapse, mortality and rate of weight gain from only four studies. Regarding Comparison 3, six of eight studies provided data for the meta‐analysis for recovery, relapse and rate of weight gain, and seven for mortality. In Comparison 2, both studies provided data on all four main outcomes for meta‐analysis.
We were unable to assess the likelihood of publication bias formally, due to having less than 10 included studies per comparison.
None of the review authors have any links to companies that manufacture or sell RUTF; one author is a paediatrician who provides care to patients with SAM.
Agreements and disagreements with other studies or reviews
To our knowledge, the 2013 version of this review (Schoonees 2013), which included four studies ‐ all conducted in Malawi, was the first systematic review that specifically investigated home‐based RUTF for the treatment of children with SAM. For Comparison 1, we found that RUTF may improve recovery (RR 1.33, 95% CI 1.16 to 1.54; moderate‐quality evidence) and increase the rate of weight gain slightly (MD 1.12 g/kg/day, 95% CI 0.27 to 1.96; low‐quality evidence), but the effects on relapse and mortality are unclear (both very low‐quality evidence). This is in line with the findings of this update, except that we also found that standard RUTF may increase the rate of weight gain. In this current review, we did not find any additional studies for Comparison 2, and thus the conclusions did not change. For Comparison 3 in the 2013 review (Schoonees 2013), there was only one eligible trial, which compared RUTF containing 10% milk powder to a standard formulation containing 25% milk powder. There was probably little or no difference between the groups for recovery (RR 0.97, 95% CI 0.93 to 1.01; moderate‐quality evidence), but RUTF containing less milk powder may have led to slightly more children relapsing (RR 1.33, 95% CI 1.03 to 1.72; low‐quality evidence) and to a lower rate of weight gain (MD −0.5 g/kg/day, 95% CI −0.75 to −0.25; low‐quality evidence) than standard RUTF with 25% milk powder. In terms of recovery, this finding is similar to the finding in this update, which shows that it makes little or no difference whether standard or alternative formulation RUTF is used (high‐quality evidence). However, in line with the findings of the 2013 review (Schoonees 2013), standard RUTF decreases relapse (RR 0.84, 95% CI 0.72 to 0.98; high‐quality evidence). For mortality (RR 1.00, 95% CI 0.8 to 1.24; moderate‐quality evidence) and rate of weight gain (MD 0.11 g/kg/day, 95% CI −0.32 to 0.54; low‐quality evidence) it may make little or no difference what formulation for RUTF is used.
Gera 2010 assessed the "efficacy and safety of home‐based management of SAM using 'therapeutic nutrition products' or ready to use therapeutic foods and efficacy of these products in comparison with F‐100 and home‐based diet" and included two reviews, seven "controlled trials", seven cohort studies and two consensus statements. The outcomes assessed were recovery rate (as defined by the study authors), weight gain (g/kg/day), relapse, mortality and morbidities (for example, diarrhoea, malaria and respiratory infections). Of the seven "controlled trials", we have included two in our review (Ciliberto 2005; Manary 2004). We did not include the remaining five studies because one was facility‐based (Diop 2003), three did not have an eligible control group (Diop 2004; Gabouland 2007; Sandige 2004), and one study included Spirulina® and not RUTF (Simpore 2006). Gera 2010 did not perform a meta‐analysis of studies on any of the comparisons that we evaluated in our review, but pooled four cohort studies that assessed the effect of home‐based RUTF on weight gain in SAM children and found a "mean weight gain" of 3.2 g/kg/day (95% CI 3.06 to 3.34; I2 = 89.8%) (software used and type of effects model not reported). In this update, we too found that children who received standard RUTF, as opposed to alternative dietary approaches, gained more weight; however, the effect was smaller (MD 1.12 g/kg/day, 95% CI 0.27 to 1.96; random‐effects analysis, heterogeneity Chi2 = 7.40; df = 3; P = 0.06; I2 = 59%; Analysis 1.11).
Guidelines by Ashworth and colleagues categorised weight gain during the rehabilitation phase for children with SAM as poor if less then 5 g/kg/day, moderate if between 5 and 10 g/kg/day and good if more than 10 g/kg/day (Ashworth 2003). The highest average weight gain among our included studies was 5.1 g/kg/day over the first four weeks of the intervention period. This occurred in the study that included only HIV‐uninfected children (Manary 2004). Rate of weight gain in children with SAM is complex and depends on a number of different factors. These include the protein quality of the nutritional intervention (Manary 2016); infections and treatment for conditions such as HIV, tuberculosis (Manary 2016), and diarrhoea (Iannotti 2015); and non‐dietary factors, such as the mother's educational status and her knowledge about feeding practices, socioeconomic status, and previous history of malnutrition (Sanghvi 2014). Although rapid weight gain in the rehabilitation phase of SAM is desired, its long‐term impact ‐ especially if height gain does not also occur ‐ is of concern in the context of the 'double burden' of disease and overnutrition in adulthood (Black 2013; Trehan 2015).
In the same year that our review was first published, Lenters 2013 evaluated the effectiveness of interventions for inpatient management of SAM, community‐based management of SAM with RUTF, and interventions for MAM in children under five years of age in LMICs. Lenters and colleagues included the same three studies that were conducted in Malawi that we did (Ciliberto 2005; Manary 2004; Ndekha 2005) and, for their comparison 'community‐based management with RUTF versus "standard therapy"', came to similar conclusions as reported in our 2013 review (Schoonees 2013). Since then, a number of new studies have been conducted and we have included them in this update. We could not find any other systematic reviews that included the recent studies for home‐based rehabilitation with RUTF for young children with SAM. Iannotti 2015 investigated the most effective diagnostic and therapeutic measures for community‐based management of SAM children with diarrhoea; however, their search was done in 2013 and did not identify any studies that directly addressed this question in outpatients.
Although not specifically the focus of our review, it should be noted that RUTF may be used in the context of humanitarian emergencies, where paediatric mortality and morbidity may largely be due to malnutrition (Balhara 2017; Kassebaum 2017; Moss 2006). A systematic review by Balhara and colleagues aimed to characterise specific nutritional interventions in these settings and their effects on paediatric (ages 1 to 18 years) mortality, anthropometric measures and serum markers of nutrition (Balhara 2017). Of the 31 included studies, two studies from Niger (Isanaka 2009; Nackers 2010), and three observational studies from Malawi (Amthor 2009), Myanmar (James 2015), and Sri Lanka (Jayatissa 2012), included RUTF as intervention. We excluded Nackers 2010 from our review because the participants were children with MAM. We also excluded Isanaka 2009 as the study was concerned with the prevention, not treatment, of severe wasting. Balhara 2017 found that "[h]igh‐ and medium‐quality studies demonstrated positive impact of fortified spreads, ready‐to‐use therapeutic foods, micronutrients supplementation, and food and cash transfers".
A Cochrane Review evaluated the safety and effectiveness of different types of foods (which included RUTF as a lipid‐based nutrient supplement) for children aged six months to five years with MAM in LMICs (Lazzerini 2013), and found no significant difference in mortality (moderate‐quality evidence), progression to SAM (high‐quality evidence) or in the number of dropouts from the nutritional programme (moderate‐quality evidence) when comparing lipid‐based nutrient supplements at full dose with any blended foods (without a high lipid content). However, lipid‐based supplements significantly increased the number of children who recovered (RR 1.10, 95% CI 1.04 to 1.16; 5 studies, 6367 children; moderate‐quality evidence) and decreased the number of "non‐recovering children" (quote; RR 0.53, 95% CI 0.40 to 0.69; 3 studies, 4537 children; high‐quality evidence). Gera 2017 also evaluated the effectiveness and safety of lipid‐based nutrient supplements (which included RUTF) for the treatment of MAM in children aged between six and 59 months. In a subgroup analysis to explore heterogeneity for their primary outcome recovery, they found that the RUTF group had a higher recovery rate than the group consuming RUSF foods (RR 1.23, 95% CI 1.09 to 1.38; 1 trial, 451 children for RUTF and RR 1.06, 95% CI 1.01 to 1.11; 7 studies, 8483 children for RUSF; Chi2 = 5.17; df = 1; P = 0.02; I2 = 80.7% for subgroup differences). Gera and colleagues also reported that lipid‐based nutrient supplements containing milk had a higher recovery rate (RR 1.15, 95% CI 1.03 to 1.29; 2 studies, 1140 children) than those without milk (RR 1.06, 95% CI 1.01 to 1.11; 7 studies, 7795 children; heterogeneity indicators not reported).
Economic commentary
Historically, SAM was managed within healthcare facilities. However, due to the large number of children requiring treatment and limited resources, alternative treatment strategies were sought. Since 2007, WHO has recommended community‐based management of malnutrition (CMAM) (WHO/WFP/UNSCN/UNICEF 2007). Mortality rates comparable to those in facility‐based care have been reported with this approach (Akparibo 2017; Collins 2002; Collins 2006b; Kabalo 2017). The success of CMAM largely relies on the provision of an adequate and safe therapeutic feed, and RUTF was developed to address this need. A major concern has been the contribution of RUTF to the total cost of CMAM and the effect that it may have on the cost‐effectiveness of the programmes. A few studies addressing the cost and cost‐effectiveness of community‐based management have identified RUTF as one of the most important cost components.
Our searches in 2017 and 2018 yielded 526 records. After screening by two authors independently, we identified seven studies as potentially eligible. All of them evaluated the cost or cost‐effectiveness of CMAM and specified the contribution of RUTF to the total cost (Bachmann 2009; Garg 2018; Isanaka 2017; Puett 2013; Rogers 2018; Tekeste 2012; Wilford 2012), and thus we included them in the Economic commentary. Although we did not perform a critical appraisal of these studies, we extracted relevant study information to provide the reader with additional information on the use of RUTF (Table 14).
11. Summary of cost‐ and cost‐effectiveness studies.
| Author | Bachmann 2009 | Garg 2018 | Isanaka 2017 | Rogers 2018 | Tekeste 2012 | Puett 2013 | Wilford 2012 |
| Intervention assessed | CMAM compared to a hypothetical alternative of providing no treatment | Home‐based management of SAM in a community setting: 2 different RUTF feeding regimens were compared against an energy‐dense, home‐prepared food regimen | Routine inpatient and outpatient management CMAM of SAM. There was no control group | CHW delivered treatment of SAM compared to outpatient facility‐based care | CTC of SAM in comparison to facility‐based TFC care in emergencies | Community‐based management of SAM added to a community‐based health and nutrition programme versus inpatient treatment augmented with community surveillance by CHW | Community‐based management of acute malnutrition integrated into health services in comparison to health services with no CMAM |
| Location | Zambia | India | Niger | Mali | Ethiopia | Bangladesh | Malawi |
| Population | Children < 5 years with SAM (MUAC < 11 cm, or bilateral pitting oedema) | Children aged 6 months‐5 years with uncomplicated SAM (WHZ < ‐3, or oedema, or both) | Children aged 6 months‐5 years with uncomplicated or complicated SAM (MUAC < 115 mm, or WHZ < ‐3 and MUAC > 115 mm) |
Children aged 6‐59 months with uncomplicated SAM (MUAC < 115 mm, WHZ < ‐3, or bilateral oedema) |
Children with SAM (age and diagnostic criteria used for eligible participants not reported) that required treatment during a drought crisis | Children aged 6‐36 months with uncomplicated SAM (MUAC < 110 mm, or oedema, or both) |
Children < 5 years old with SAM (oedema or wasting); defaulters and readmissions were included |
| Type of analysis | Cost‐effectiveness analysis based on a decision tree model |
Costing analysis where the costs were calculated per week per child for activities under research setting and estimated for the activities that are likely to be done under the government setting | Cost analysis of in‐ and outpatient treatment, including cost of F‐75, F‐100, and RUTF (Plumpy'nut®) | Activity‐based cost analysis was developed. Costs were estimated via document review, interviews and focus groups. | Retrospective comparative cost‐effectiveness evaluation of therapeutic feeding programmes in emergencies. Assessed parental costs by interview. Sourced other costs from existing data |
Cost‐effectiveness analysis of CMAM delivered by CHW versus inpatient treatment | Cost effectiveness analysis based on a decision tree model. |
| Perspective taken | Health services | Health services | Health services | Societal perspective | Societal perspective | Societal perspective | Health services |
| Major outcome(s) | Death | Recovery during treatment period (WHZ > ‐2), and absence of oedema in the feet | Not applicable, as cost analysis and not cost‐effectiveness analysis was done | Recovery rate | Cure rate | Death, recovery | Death, cure, default or non‐recovery |
| Main cost category | RUTF, health centre visit, programme establishment, hospitalisation | Human resources (per week per child based on salaries and time taken) and consumables (RUTF, medicines) and programmatic and administrative costs. Estimated cost of resources that would be used in the government setting | Outpatient: therapeutic food and personnel Inpatient: personnel, transport and logistical support and therapeutic food |
All costs incurred by institutions, beneficiaries and communities were included. Variable costs per child were costs to households and RUTF costs (that included its purchase, storage, security and transport costs) | Healthcare costs and costs to parents were assessed (the latter by using questionnaires). Personnel, capital depreciation and utilities, medication, RUTF or milk‐based formula, caretakers' food, non‐food items |
Total costs to households (transport, time, food) and the health service (personnel, supervision, training, medication, therapeutic feeds including RUTF) | Administration, personnel, transport, RUTF, therapeutic milk, medication, and bed costs |
| Currency | International dollars | USD and INR (USD 1 = 62 rupees) | Euros (EUR 1 = 656 XOF) |
USD | USD | USD (USD 1 = 67.94 BDT) |
USD (USD 1 = 140 MWK) |
| Price year | 2008 | 2013 and 2014 | 2013 | 2016 | TFC: July 2003‐January 2004; CTC: July 2005 to April 2007 | 2010 | 2007 (Janauary‐December) |
| Sensitivity analysis | Yes (one‐ and two‐way analysis) | Not reported | Yes (one‐way) | Yes (univariate, multivariate probabilistic, and modelled scenario sensitivity analyses) | Was done, but not reported | Yes (one‐way) Relative effect of different inputs on the DALYs averted in community and inpatient treatment |
Yes (one‐way) |
| Result summary | CMAM cost USD 203 per child | Average total cost per treated child in the government setting was estimated at USD 56 (< 3500 rupees) No significant difference in costs was detected across the 3 feeding regimens | Total cost was EUR 148.86 per child | The average cost per child treated by CHWs was USD 244 compared to USD 442 in the outpatient facility. The cost per child recovered was USD 259 by CHWs and USD 501 in the outpatient facility | Institutional cost: TFC: USD 262.62 CMAM: USD 128.58 Costs to care‐givers: TFC USD 0.92 + USD 21.01 = USD 21.93 CTC USD 0.42 + USD 5.87 = USD 6.29 |
CMAM: USD 165 per child; cost per child recovered USD 180; cost per death averted USD 869; cost per DALY averted USD 26 Inpatient treatment: USD 1344; cost per child recovered USD 9149; cost per death averted USD 45688; cost per DALY averted USD 1344 |
The total cost of providing CMAM was USD 470,703, and for non‐CMAM (USD 23,394) treatment for SAM in Dowa district (scenario 1) was USD 494,097 USD 42 per DALY averted (or USD 1365 per life saved) Average cost per child treated in CMAM: USD 169.3 (140.3 to 211.6) Average cost per child treated in non‐CMAM: USD 16.7 (12.5 to 20.9) |
| RUTF cost | USD 72.52 (mean) per child, i.e. 35.8% of the total cost | USD 36.4 per child treated in the government setting; that is 65% of total average cost | CMAM: RUTF cost was 44% (EUR 32.98 per child) of total cost Inpatient care: RUTF cost was 11% (EUR 14.34 per child) of total cost |
RUTF's average cost per treated child was (17795+5648)/(617+212) = USD 28.8; (RUTF costs were 11.8% of total cost in the CHWs group and 6.0% of total cost in the outpatient facility group) |
Facility‐based: USD 42.93 (mean) per child, that is 16.35% of total cost CMAM: USD 55.53 (mean) per child, that is 43.19% of total cost |
USD 36.36 per child enrolled, that is 24% of total cost of CMAM | RUTF was USD 169.3, that is 32% of total cost of CMAM |
| Cost per death averted | USD 1760 | Not reported | Not reported | Not reported | Not reported | CMAM: USD 869 Inpatient treatment: USD 45688 |
USD 1365 |
| Cost per DALY averted | USD 53 | Not reported | Not reported | Not reported | Not reported | CMAM: USD 26 Inpatient treatment: USD 1344 |
USD 42 |
| Production | Valid International | RUTF‐C was produced by Comparct Foods Ltd, India; RUTF‐L was prepared at each participating site in a designated room | Not specified, but implied that the RUTF came from Nutriset, France as Plumpy'nut® was used | UNICEF provided the RUTF for the study; unclear who produced it | Not specified, but implied that imported RUTF was used | Plumpy'nut®, Nutriset France | Not specified, but implied that imported RUTF was used |
| Funder | Valid International and Concern | Bill and Melinda Gates Foundation | Study authors reported that there was no funding for the preparation of the manuscript | Innocent Foundation | Jimma University | GAIN, the Global Alliance for Improved Nutrition. Additional support was provided by the Feinstein International Center at Tufts University | Concern Worldwide |
| CHW: community health worker; CMAM: community‐based management of acute malnutrition; CTC: community‐based therapeutic care; DALY: disability‐adjusted life year; MUAC: mid‐upper arm circumference; RUTF: ready‐to‐use therapeutic food; RUTF‐C: commercially produced ready‐to‐eat therapeutic food; RUTF‐L: locally produced ready‐to‐eat therapeutic food; SAM: severe acute malnutrition; TFC: therapeutic feeding centre; WHZ: weight for height z score | |||||||
In Niger, Isanaka and colleagues conducted a cost analysis of in‐ and outpatient treatment of SAM (Isanaka 2017). RUTF accounted for 44% (EUR 32.98) of the cost of CMAM.
Two studies, one from Zambia (comparing CMAM to no treatment) and the other from Malawi (comparing CMAM to no CMAM), used a decision‐tree model to assess cost‐effectiveness of CMAM (Bachmann 2009; Wilford 2012). RUTF contributed 36% and 32% respectively to the cost of CMAM in the studies. The incremental cost per death averted was USD 1760 and USD 1365 respectively, and the incremental cost per DALY (disability‐adjusted‐life year) USD 53 and USD 42.
Another two studies, from Ethiopia (Tekeste 2012), and Bangladesh (Puett 2013), took a societal perspective in their cost‐effectiveness analysis, comparing facility‐based treatment to community‐based treatment. In Ethiopia, RUTF contributed 43.2% to the cost of CMAM whereas in Bangladesh, it was 24%. The authors ascribed the relatively low contribution of RUTF to total costs to the high management costs incurred. The incremental cost of death averted with CMAM in Bangladesh was USD 869 and DALY averted was USD 26; this was significantly less than with inpatient care.
In India, Garg and colleagues conducted a costing analysis of three feeding regimens (two different types of RUTFs and energy‐dense, home‐prepared food as per Bhandari 2016), for home‐based management of children with uncomplicated SAM (Garg 2018). The authors estimated the average cost per treated child in the government setting to be USD 56 (< INR 3500). RUTF contributed about 65% of this total CMAM cost.
In rural Mali, Rogers 2018 assessed costs and cost‐effectiveness of community health worker (CHW)‐delivered care and found that CHW‐delivered care amounted to approximately half the cost per child treated (USD 244 versus USD 442) and recovered (USD 259 versus USD501) compared to outpatient facility‐based care.
The data available indicates that CMAM is more cost‐effective than facility‐based treatment of uncomplicated SAM, despite the relatively high cost of RUTF.
Authors' conclusions
Implications for practice.
Standard ready‐to‐use therapeutic food (RUTF) probably improves recovery and may increase the rate of weight gain compared to alternative dietary approaches, but its effects on relapse and mortality are unknown. Standard RUTF meeting total daily nutritional requirements may improve recovery and relapse compared to a similar RUTF given as a supplement to the usual diet. However, its effects on mortality and the rate of weight gain are not clear. When comparing RUTFs with different formulations, the current evidence does not favour a particular formulation, except for relapse, which is reduced with standard RUTF. The current limitations in the evidence base do not allow us to draw definitive conclusions regarding the applicability of these findings to children with severe acute malnutrition (SAM) with or without comorbidity and at different ages and levels of severity.
Implications for research.
Well‐designed, adequately‐powered, pragmatic randomised controlled trials (RCTs) of RUTF are needed, reported according to the CONSORT guidelines, as is more detailed reporting regarding the interventions and their implementation (according to the guidelines given in Hoffmann 2017). Studies where children are tested and treated for HIV, and where randomisation and analyses are stratified by confirmed HIV status, are needed to explore the influence of HIV on recovery from SAM. A serious limitation of the existing studies is the use of different definitions of outcomes, such as recovery (different reference or child growth standards and cut‐off points), and anthropometrical measurements (assessed at different time points). More attention should be given to the type and standardisation of SAM outcomes in future RUTF research. The focus needs to be on recovery, relapse, mortality and the rate of weight gain, but also on adverse effects, such as diarrhoea and allergic reactions, as these outcomes are important to patients. In addition, cost implications (for example, cost per death averted and cost per disability‐adjusted‐life year (DALY) averted) should be reported in future studies to enable a cost‐effectiveness analysis.
Adherence to RUTF as intervention is unclear; only three included studies reported on compliance, and the selling of dispensed RUTF or sharing it with siblings or other family members is likely. Therefore, future studies could investigate whether a greater effort to promote adherence ‐ and thus higher rate of consumption by the target child ‐ could improve the cost‐effectiveness of RUTF treatment.
Feedback
Controversial sentence in Conclusion section, 3 March 2017
Summary
On 3 March 2017, Professor Paul Garner (UK) submitted the following criticism to Cochrane publishers Wiley‐Blackwell:
"In the abstract, the authors state: Given the limited evidence base currently available, it is not possible to reach definitive conclusions regarding differences in clinical outcomes in children with severe acute malnutrition who were given home‐based ready‐to‐use therapeutic food (RUTF) compared to the standard diet, or who were treated with RUTF in different daily amounts or formulations. They then conclude: For this reason, either RUTF or flour porridge can be used to treat children at home depending on availability, affordability and practicality. However, it is not possible to reach this conclusion BASED ON THE EVIDENCE. So the evidence does not say this. The evidence says, we don't know which is best." Do you have any affiliation with or involvement in any organisation with a financial interest in the subject matter of your comment? "I run the RPC that helped fund this review."
Reply
On 28 March 2017, the review author team responded as follows:
"Thanks for the comment. We meant that, in light of the poor quality of evidence for the effectiveness of RUTF, the decision about what home‐based intervention to use could be based on factors such as what is available, affordable and practical in specific settings and contexts.
We accept that the sentence could be incorrectly interpreted to mean that there is no difference between RUTF and flour porridge and have therefore deleted the sentence from the abstract, the plain language summary and from the conclusion. We have also begun the process of updating this review to incorporate new evidence."
Contributors
Paul Garner, Coordinating Editor, Cochrane Infectious Diseases Group, Liverpool, UK Email: paul.garner@lstmed.ac.uk _________________________________________ Anel Schoonees, Researcher, Centre for Evidence‐based Health Care, Stellenbosch University, South Africa Email: anelschoonees@sun.ac.za (On behalf of the author team: Anel Schoonees, Martani Lombard, Alfred Musekiwa, Etienne Nel and Jimmy Volmink)
What's new
| Date | Event | Description |
|---|---|---|
| 9 October 2018 | New citation required and conclusions have changed | 11 new studies included in review. The review now has 15 included studies with 7976 children. |
| 9 October 2018 | New search has been performed | Updated following searches in June 2017 and October 2018 |
History
Protocol first published: Issue 2, 2011 Review first published: Issue 6, 2013
| Date | Event | Description |
|---|---|---|
| 28 March 2017 | Amended | A sentence that may have led to controversy has been removed from the concluding parts of the abstract, plain language summary and implications for practice sections. |
Acknowledgements
We are grateful to all the primary study authors and their colleagues (of studies included, excluded, ongoing and awaiting assessment) who responded to our email requests. We acknowledge Stéphane Doyon from Médecins Sans Frontières who, for the first version of our review (Schoonees 2013), provided us with context regarding the use of RUTF in the field. We thank Marianne Visser who helped with data extraction and 'Risk of bias' assessment of cluster‐randomised trials. We also thank Margaret Anderson (Information Specialist of Cochrane Developmental, Psychosocial and Learning Problems) and Vittoria Lutje (Information Specialist of Cochrane Infectious Diseases) for their expertise in developing the search strategy and conducting the searches, as well as Paul Garner and Harriet Blundell for their valuable input to the review question.
This review was produced within the Cochrane Developmental, Psychosocial and Learning Problems Group.
Appendices
Appendix 1. Search strategies from 2013 onwards
Cochrane Central Register of Clinical Trials (CENTRAL), in the Cochrane Library
Issue 6 of 12, 2017, searched 2 June 2017; Issue 9 of 12, 2018, searched 9 October 2018
#1 MeSH descriptor: [Nutrition Disorders] this term only #2 MeSH descriptor: [Child Nutrition Disorders] this term only #3 MeSH descriptor: [Infant Nutrition Disorders] this term only #4 MeSH descriptor: [Protein‐Energy Malnutrition] this term only #5 MeSH descriptor: [Wasting Syndrome] this term only #6 MeSH descriptor: [Emaciation] this term only #7 undernutrition or under‐nutrition #8 undernourish* or under‐nourish* #9 malnutrition or mal‐nutrition #10 malnourish* or mal‐nourish* #11 nutrition* next defic* #12 marasmus #13 kwashiorkor #14 emaciat* #15 wasted or wasting #16 stunted or stunting #17 MeSH descriptor: [Malnutrition] this term only #18 MeSH descriptor: [Deficiency Diseases] this term only #19 #1 or #2 or #3 or #4 or #5 or #6 or #7 or #8 or #9 or #10 or #11 or #12 or #13 or #14 or #15 or #16 or #17 or #18 #20 MeSH descriptor: [Food, Formulated] this term only #21 MeSH descriptor: [Dietary Supplements] explode all trees #22 therapeutic near/3 (food* or diet*) #23 enrich* near/3 (food* or diet*) #24 fortifi* near/3 (food* or diet*) #25 supplement* near/3 (food* or diet*) #26 ready near/3 food* #27 RUTF #28 RTUF #29 ready‐to‐use food #30 MeSH descriptor: [Food, Fortified] this term only #31 #20 or #21 or #22 or #23 or #24 or #25 or #26 or #27 or #28 or #29 or #29 or #30 #32 baby or babies or infant* or child* or boy* or girl* or toddler* or preschool* or pre‐school* or kindergarten* #33 #19 and #31 and #32 Publication Year from 2013 to 2017
MEDLINE(R), Epub Ahead of Print, In‐Process & Other Non‐Indexed Citations, Daily and Versions(R) Ovid
Searched 30 May 2017 and October 2018
1 nutrition disorders/ 2 malnutrition/ 3 exp protein‐energy malnutrition/ 4 wasting syndrome/ 5 Emaciation/ 6 infant nutrition disorders/ 7 child nutrition disorders/ 8 deficiency diseases/ 9 (undernutrition or under‐nutrition).tw. 10 (undernourish$ or under‐nourish$).tw. 11 (malnutrition or mal‐nutrition).tw. 12 (malnourish$ or mal‐nourish$).tw. 13 (nutrition$ adj defic$).tw. 14 marasmus$.tw. 15 kwashiorkor.tw. 16 emaciat$.tw. 17 (wasted or wasting).tw. 18 (stunted or stunting).tw. 19 or/1‐18 20 Food, Fortified/ 21 Food, Formulated/ 22 exp Dietary Supplements/ 23 (therapeutic adj3 (food$ or diet$)).tw. 24 (enrich$ adj3 (food$ or diet$)).tw. 25 (fortifi$ adj3 (food$ or diet$)).tw. 26 (supplement$ adj3 (food$ or diet$)).tw. 27 (ready adj3 food$).tw. 28 (RUTF or RTUF).tw. 29 or/20‐28 30 19 and 29 31 Infant/ 32 exp Child/ 33 (baby or babies or infant$ or child$ or boy$ or girl$ or toddler$ or preschool$ or pre‐school$ or kindergarten$).tw. 34 31 or 32 or 33 35 30 and 34 36 randomized controlled trial.pt. 37 controlled clinical trial.pt. 38 randomi#ed.ab. 39 placebo$.ab. 40 drug therapy.fs. 41 randomly.ab. 42 trial.ab. 43 groups.ab. 44 or/36‐43 45 exp animals/ not humans.sh. 46 44 not 45 47 35 and 46
Embase Ovid
Searched 30 May 2017 and 8 October 2018
1 nutritional deficiency/ 2 nutritional disorder/ 3 protein calorie malnutrition/ 4 malnutrition/ 5 wasting syndrome/ 6 weight reduction/ 7 (undernutrition or under‐nutrition).tw. 8 (undernourish$ or under‐nourish$).tw. 9 (malnutrition or mal‐nutrition).tw. 10 (malnourish$ or mal‐nourish$).tw. 11 (nutrition$ adj defic$).tw. 12 emaciat$.tw. 13 (wasted or wasting).tw. 14 (stunted or stunting).tw. 15 kwashiorkor/ 16 kwas?io?kor.tw. 17 marasmus/ 18 marasmus$.tw. 19 or/1‐18 20 diet supplementation/ 21 "ready to use therapeutic food"/ 22 (therapeutic adj3 (food$ or diet$)).tw. 23 (fortifi$ adj3 (food$ or diet$)).tw. 24 (enrich$ adj3 (food$ or diet$)).tw. 25 (supplement$ adj3 (food$ or diet$)).tw. 26 (ready adj3 food$).tw. 27 (RUTF or RTUF).tw. 28 or/20‐27 29 infant/ 30 exp child/ 31 (baby or babies or infant$ or child$ or boy$ or girl$ or toddler$ or preschool$ or pre‐school$ or kindergarten$).tw. 32 29 or 30 or 31 33 Clinical trial/ 34 Randomized controlled trial/ 35 Randomization/ 36 Single blind procedure/ 37 Double blind procedure/ 38 Crossover procedure/ 39 Placebo/ 40 Randomi#ed.twz 41 RCT.tw. 42 (random$ adj3 (allocat$ or assign$)).tw. 43 randomly.ab. 44 groups.ab. 45 trial.ab. 46 ((singl$ or doubl$ or trebl$ or tripl$) adj3 (blind$ or mask$)).tw. 47 Placebo$.tw. 48 Prospective study/ 49 (crossover or cross‐over).tw. 50 prospective.tw. 51 or/33‐50 52 19 and 28 and 32 and 51 53 limit 52 to yr="2013 ‐Current"
African Index Medicus (indexmedicus.afro.who.int/)
Searched 5 June 2017 and 9 October 2018
(tw:("nutrition disorders" OR malnutrition OR emaciation OR kwashiorkor OR marasmus OR wasting OR wasted OR stunting OR stunted )) AND (tw:(child OR children OR infant OR baby OR babies OR bebe OR enfant OR preschool)) AND (tw:(rutf OR rtuf OR "therapeutic food" OR "ready to use food")) AND (instance:"ghl") AND ( year_cluster:("2015" OR "2016" OR "2013" OR "2014" OR "2017"))
CINAHL EBSCOhost (Cumulative Index to Nursing and Allied Health Literature)
Searched 30 May 2017 and 9 October 2018
| # | Query | Limiters/Expanders |
| S34 | S18 AND S27 AND S32 | Limiters ‐ Published Date: 20130101‐20171231 Search modes ‐ Boolean/Phrase |
| S33 | S18 AND S27 AND S32 | Search modes ‐ Boolean/Phrase |
| S32 | S28 OR S29 OR S30 OR S31 | Search modes ‐ Boolean/Phrase |
| S31 | TI baby or babies or infant* or child* or boy* or girl* or toddler* or preschool* or pre‐school* or kindergarten* | Search modes ‐ Boolean/Phrase |
| S30 | AB baby or babies or infant* or child* or boy* or girl* or toddler* or preschool* or pre‐school* or kindergarten* | Search modes ‐ Boolean/Phrase |
| S29 | AG Infant: 1‐23 months | Search modes ‐ Boolean/Phrase |
| S28 | AG child,preschool | Search modes ‐ Boolean/Phrase |
| S27 | S19 OR S20 OR S21 OR S22 OR S23 OR S24 OR S25 OR S26 | Search modes ‐ Boolean/Phrase |
| S26 | RUTF or RTUF | Search modes ‐ Boolean/Phrase |
| S25 | ready N3 food* | Search modes ‐ Boolean/Phrase |
| S24 | (supplement* N3 food*) or (supplement* N3 diet*) | Search modes ‐ Boolean/Phrase |
| S23 | (fortifi* N3 food*) or (fortifi* N3 diet*) | Search modes ‐ Boolean/Phrase |
| S22 | (therapeutic N3 food*) or (therapeutic N3 diet*) | Search modes ‐ Boolean/Phrase |
| S21 | (enrich N3 food*) or (enrich N3 diet*) | Search modes ‐ Boolean/Phrase |
| S20 | MH Dietary Supplements | Search modes ‐ Boolean/Phrase |
| S19 | MH Food, Fortified | Search modes ‐ Boolean/Phrase |
| S18 | S1 OR S2 OR S3 OR S4 OR S5 OR S6 OR S7 OR S8 OR S9 OR S10 OR S11 OR S12 OR S13 OR S14 OR S15 OR S16 OR S17 | Search modes ‐ Boolean/Phrase |
| S17 | stunted or stunting | Search modes ‐ Boolean/Phrase |
| S16 | wasted or wasting | Search modes ‐ Boolean/Phrase |
| S15 | emaciat* | Search modes ‐ Boolean/Phrase |
| S14 | kwashiorkor* | Search modes ‐ Boolean/Phrase |
| S13 | marasmus* | Search modes ‐ Boolean/Phrase |
| S12 | (malnourish* or mal‐nourish*) | Search modes ‐ Boolean/Phrase |
| S11 | (nutrition defic*) | Search modes ‐ Boolean/Phrase |
| S10 | malnutrition or mal‐nutrition | Search modes ‐ Boolean/Phrase |
| S9 | undernourish* or under‐nourish* | Search modes ‐ Boolean/Phrase |
| S8 | undernutrition or under‐nutrition | Search modes ‐ Boolean/Phrase |
| S7 | MH Kwashiorkor | Search modes ‐ Boolean/Phrase |
| S6 | MH Deficiency Diseases | Search modes ‐ Boolean/Phrase |
| S5 | MH Protein‐Energy Malnutrition | Search modes ‐ Boolean/Phrase |
| S4 | MH Protein Deficiency | Search modes ‐ Boolean/Phrase |
| S3 | MH Infant Nutrition Disorders | Search modes ‐ Boolean/Phrase |
| S2 | MH Child Nutrition Disorders | Search modes ‐ Boolean/Phrase |
| S1 | MH “Nutrition Disorders” | Search modes ‐ Boolean/Phrase |
Science Citation Index Web of Science
Searched 5 June 2017 and 9 October 2018
| # 22 | 289 | #20 AND #19 Refined by: PUBLICATION YEARS: ( 2015 OR 2016 OR 2017 OR 2013 OR 2014 ) Indexes=SCI‐EXPANDED, SSCI, CPCI‐S, CPCI‐SSH Timespan=All years |
| # 21 | 769 | #20 AND #19 Indexes=SCI‐EXPANDED, SSCI, CPCI‐S, CPCI‐SSH Timespan=All years |
| # 20 | 1,793,637 | TS=(infant* or child* or preschool* or pre‐school or toddler* or kindergarten* or boy* or girl*) Indexes=SCI‐EXPANDED, SSCI, CPCI‐S, CPCI‐SSH Timespan=All years |
| # 19 | 2,105 | #18 AND #17 Indexes=SCI‐EXPANDED, SSCI, CPCI‐S, CPCI‐SSH Timespan=All years |
| # 18 | 378,377 | #16 OR #15 OR #14 OR #13 OR #12 OR #11 OR #10 OR #9 OR #8 OR #7 Indexes=SCI‐EXPANDED, SSCI, CPCI‐S, CPCI‐SSH Timespan=All years |
| # 17 | 66,610 | #6 OR #5 OR #4 OR #3 OR #2 OR #1 Indexes=SCI‐EXPANDED, SSCI, CPCI‐S, CPCI‐SSH Timespan=All years |
| # 16 | 3,439 | TS= ("protein deficien*") Indexes=SCI‐EXPANDED, SSCI, CPCI‐S, CPCI‐SSH Timespan=All years |
| # 15 | 154 | TS=(" nutrition defic*") Indexes=SCI‐EXPANDED, SSCI, CPCI‐S, CPCI‐SSH Timespan=All years |
| # 14 | 288 | TS=("nutrition disorder*") Indexes=SCI‐EXPANDED, SSCI, CPCI‐S, CPCI‐SSH Timespan=All years |
| # 13 | 1,490 | TS=((emaciat*)) Indexes=SCI‐EXPANDED, SSCI, CPCI‐S, CPCI‐SSH Timespan=All years |
| # 12 | 10,452 | TS=((stunted or stunting)) Indexes=SCI‐EXPANDED, SSCI, CPCI‐S, CPCI‐SSH Timespan=All years |
| # 11 | 322,669 | TS=((wasted or wasting)) Indexes=SCI‐EXPANDED, SSCI, CPCI‐S, CPCI‐SSH Timespan=All years |
| # 10 | 1,361 | TS=((kwashiorkor*)) Indexes=SCI‐EXPANDED, SSCI, CPCI‐S, CPCI‐SSH Timespan=All years |
| # 9 | 416 | TS=((marasmus*)) Indexes=SCI‐EXPANDED, SSCI, CPCI‐S, CPCI‐SSH Timespan=All years |
| # 8 | 38,653 | TS=(malnutrition or undernutrition) Indexes=SCI‐EXPANDED, SSCI, CPCI‐S, CPCI‐SSH Timespan=All years |
| # 7 | 10,367 | TS=(malnourish* or undernourish*) Indexes=SCI‐EXPANDED, SSCI, CPCI‐S, CPCI‐SSH Timespan=All years |
| # 6 | 209 | TS=("ready to use" near/3 food) Indexes=SCI‐EXPANDED, SSCI, CPCI‐S, CPCI‐SSH Timespan=All years |
| # 5 | 1,988 | TS=((therapeutic* near/3 (food* or diet*))) Indexes=SCI‐EXPANDED, SSCI, CPCI‐S, CPCI‐SSH Timespan=All years |
| # 4 | 55,730 | TS=((supplement* near/3 (food* or diet*))) Indexes=SCI‐EXPANDED, SSCI, CPCI‐S, CPCI‐SSH Timespan=All years |
| # 3 | 3,641 | Ts=((fortifi* NEAR/3 (food* or diet*))) Indexes=SCI‐EXPANDED, SSCI, CPCI‐S, CPCI‐SSH Timespan=All years |
| # 2 | 7,691 | TS=((enrich* NEAR/3 (food* or diet*))) Indexes=SCI‐EXPANDED, SSCI, CPCI‐S, CPCI‐SSH Timespan=All years |
| # 1 | 87 | TS=(RUTF or RTUF) Indexes=SCI‐EXPANDED, SSCI, CPCI‐S, CPCI‐SSH Timespan=All years |
LILACS (Latin American and Caribbean Health Science Information database; lilacs.bvsalud.org/en/)
Searched 2 June 2017 and 9 October 2018
(tw:(RUTF OR RTUF OR "therapeutic food" OR "ready to use food")) AND (tw:(baby or babies or infant* or child* or boy* or girl* or toddler* or preschool* or pre‐school* or kindergarten*))
ZETOC (zetoc.jisc.ac.uk/)
Searched 30 May 2017 and 9 October 2018
| 5 | any: “ready to use food” | sorted on date |
| 4 | any: “therapeutic food” | sorted on date |
| 3 | any: RTUF | sorted on reverse date |
| 2 | any: RUFT | sorted on reverse date |
| 1 | any: RUTF | sorted on reverse date |
Epistemonikos (www.epistemonikos.org/)
Searched last 5 years : 2 June 2017 and 9 October 2018
(RUTF OR RTUF OR therapeutic food OR ready to use food) AND children
Clinicaltrials.gov (clinicaltrials.gov/)
Searched 5 June 2017 and 10 October 2018; no time limits
RUTF OR "therapeutic food" OR "ready to use food" | Child
ISRCTN registry (www.isrctn.com/)
Searched 5 June 2017 and 9 October 2018; no time limits
RUTF OR "therapeutic food" OR "ready to use food" within Participant age range: Child
WHO ICTRP (World Health Organization International Clinical Trials Registry Platform; apps.who.int/trialsearch/)
Searched 5 June 2017 and 10 October 2018; no time limits
RUTF OR therapeutic food OR ready to use food (Trials in children)
Appendix 2. Search strategies for cost‐effectiveness studies
Ovid MEDLINE(R)
Searched 12 June 2017 and 9 October 2018
1 economics/ 2 exp "Costs and Cost Analysis"/ 3 economics.fs. (387872) 4 (economic$ or cost or costs or costly or costing or price or prices or pricing).tw,kf. 5 (expenditure$ not energy).tw,kf. 6 "value for money".tw,kf. 7 budget$.tw,kf. 8 or/1‐7 9 Food, Fortified/ 10 Food, Formulated/ 11 exp Dietary Supplements/ 12 (therapeutic adj3 (food$ or diet$)).tw. 13 (enrich$ adj3 (food$ or diet$)).tw. 14 (fortifi$ adj3 (food$ or diet$)).tw. 15 (supplement$ adj3 (food$ or diet$)).tw. 16 (ready adj3 food$).tw. 17 (RUTF or RTUF).mp. [mp=title, abstract, original title, name of substance word, subject heading word, keyword heading word, protocol supplementary concept word, rare disease supplementary concept word, unique identifier, synonyms] 18 or/9‐17 19 8 and 18 20 Infant/ 21 exp Child/ 22 (baby or babies or infant$ or child$ or boy$ or girl$ or toddler$ or preschool$ or pre‐school$ or kindergarten$).tw. 23 20 or 21 or 22 24 19 and 23 25 nutrition disorders.mp. or Nutrition Disorders/ 26 malnutrition.mp. or Malnutrition/ 27 undernutrition.mp. 28 (undernourish$ or under‐nourish$ or malnourish$ or mal‐nourish$).mp. [mp=title, abstract, original title, name of substance word, subject heading word, keyword heading word, protocol supplementary concept word, rare disease supplementary concept word, unique identifier, synonyms] 29 (marasmus$ or kwashiorkor or emaciat$ or wasted or wasting or stunted or stunting).tw. 30 25 or 26 or 27 or 28 or 29 31 24 and 30
MEDLINE(R) Epub Ahead of Print, In‐Process & Other Non‐Indexed Citations, Daily and Versions(R) Ovid
Searched 12 June 2017 and 9 October 2018
1 economics/ 2 exp "Costs and Cost Analysis"/ 3 economics.fs. 4 (economic$ or cost or costs or costly or costing or price or prices or pricing).tw,kf. 5 (expenditure$ not energy).tw,kf. 6 "value for money".tw,kf. 7 budget$.tw,kf. 8 or/1‐7 9 Food, Fortified/ 10 Food, Formulated/ 11 exp Dietary Supplements/ 12 (therapeutic adj3 (food$ or diet$)).tw. 13 (enrich$ adj3 (food$ or diet$)).tw. 14 (fortifi$ adj3 (food$ or diet$)).tw. 15 (supplement$ adj3 (food$ or diet$)).tw. 16 (ready adj3 food$).tw. 17 (RUTF or RTUF).mp. [mp=title, abstract, original title, name of substance word, subject heading word, keyword heading word, protocol supplementary concept word, rare disease supplementary concept word, unique identifier, synonyms] 18 or/9‐17 19 8 and 18 20 Infant/ 21 exp Child/ 22 (baby or babies or infant$ or child$ or boy$ or girl$ or toddler$ or preschool$ or pre‐school$ or kindergarten$).tw. 23 20 or 21 or 22 24 19 and 23 25 nutrition disorders.mp. or Nutrition Disorders/ 26 malnutrition.mp. or Malnutrition/ 27 undernutrition.mp. 28 (undernourish$ or under‐nourish$ or malnourish$ or mal‐nourish$).mp. [mp=title, abstract, original title, name of substance word, subject heading word, keyword heading word, protocol supplementary concept word, rare disease supplementary concept word, unique identifier, synonyms] 29 (marasmus$ or kwashiorkor or emaciat$ or wasted or wasting or stunted or stunting).tw. 30 25 or 26 or 27 or 28 or 29 31 24 and 30
Embase Ovid
Searched 12 June 2017 and 9 October 2018
1 economics/ 2 (economic$ or cost or costs or costly or costing or price or prices or pricing).tw,kf. 3 (expenditure$ not energy).tw,kf. 4 "value for money".tw,kf. 5 budget$.tw,kf. 6 Food, Fortified/ 7 Food, Formulated/ 8 (therapeutic adj3 (food$ or diet$)).tw. 9 (enrich$ adj3 (food$ or diet$)).tw. 10 (fortifi$ adj3 (food$ or diet$)).tw. 11 (supplement$ adj3 (food$ or diet$)).tw. 12 (ready adj3 food$).tw. 13 (RUTF or RTUF).mp. [mp=title, abstract, heading word, drug trade name, original title, device manufacturer, drug manufacturer, device trade name, keyword, floating subheading word] 14 Infant/ 15 exp Child/ 16 (baby or babies or infant$ or child$ or boy$ or girl$ or toddler$ or preschool$ or pre‐school$ or kindergarten$).tw. 17 14 or 15 or 16 18 nutrition disorders.mp. or Nutrition Disorders/ 19 malnutrition.mp. or Malnutrition/ 20 undernutrition.mp. 21 (undernourish$ or under‐nourish$ or malnourish$ or mal‐nourish$).mp. [mp=title, abstract, heading word, drug trade name, original title, device manufacturer, drug manufacturer, device trade name, keyword, floating subheading word] 22 (marasmus$ or kwashiorkor or emaciat$ or wasted or wasting or stunted or stunting).tw. 23 18 or 19 or 20 or 21 or 22 24 17 and 23 25 exp economic evaluation/ 26 1 or 2 or 3 or 4 or 5 or 25 27 24 and 26 28 diet supplementation/ 29 6 or 7 or 8 or 9 or 10 or 11 or 12 or 13 or 28 30 27 and 29
NHS Economic Evaluation Database (NHS EED), part of the Cochrane Library
NHS EED ceased to be updated in March 2015. It was searched for this review on 12 June 2017.
#1 MeSH descriptor: [Food, Formulated] this term only #2 MeSH descriptor: [Dietary Supplements] explode all trees #3 therapeutic near/3 (food* or diet*) #4 enrich* near/3 (food* or diet*) #5 fortifi* near/3 (food* or diet*) #6 supplement* near/3 (food* or diet*) #7 ready near/3 food* #8 RUTF or RTUF #9 ready‐to‐use food #10 MeSH descriptor: [Food, Fortified] this term only #11 #1 or #2 or #3 or #4 or #5 or #6 or #7 or #8 or #9 or #10 #12 baby or babies or infant* or child* or boy* or girl* or toddler* or preschool* or pre‐school* or kindergarten* #13 #11 and #12
ECONLIT EBSCOHost
Searched 12 June 2017 and 9 October 2018
| # | Query | Limiters/Expanders | Last run via |
| S3 | S1 AND S2 | Search modes ‐ Boolean/Phrase | Interface ‐ EBSCOhost Research Databases Search Screen ‐ Advanced Search Database ‐ EconLit |
| S2 | TX ( child* or infant* ) OR TX ( baby or babies or infant* or child* or boy* or girl* or toddler* or preschool* or pre‐school* or kindergarten* ) | Search modes ‐ Boolean/Phrase | Interface ‐ EBSCOhost Research Databases Search Screen ‐ Advanced Search Database ‐ EconLit |
| S1 | TX fortified foods OR TX ( (enrich N3 food*) or (enrich N3 diet*) ) OR TX ( (therapeutic N3 food*) or (therapeutic N3 diet*) ) OR TX ( (fortifi* N3 food*) or (fortifi* N3 diet*) ) OR TX ( (supplement* N3 food*) or (supplement* N3 diet*) ) OR TX ready N3 food* OR TX ( RUTF or RTUF ) | Search modes ‐ Boolean/Phrase | Interface ‐ EBSCOhost Research Databases Search Screen ‐ Advanced Search Database ‐ EconLit |
Appendix 3. Search strategies before 2013
Cochrane Central Register of Clinical Trials (CENTRAL), in the Cochrane Library
Searched 30 November 2010, 26 April 2012 and 4 April 2013
#1 MeSH descriptor Nutrition Disorders, this term only #2 MeSH descriptor Child Nutrition Disorders, this term only #3 MeSH descriptor Infant Nutrition Disorders, this term only #4 MeSH descriptor Protein‐Energy Malnutrition, this term only #5 MeSH descriptor Wasting Syndrome, this term only #6 MeSH descriptor Emaciation, this term only #7 undernutrition or under‐nutrition #8 undernourish* or under‐nourish* #9 malnutrition or mal‐nutrition #10 malnourish* or mal‐nourish* #11 nutrition* NEXT defic* #12 marasmus #13 kwashiorkor #14 emaciat* #15 wasted or wasting #16 stunted or stunting #17 MeSH descriptor Malnutrition, this term only #18 MeSH descriptor Deficiency Diseases, this term only #19 (#1 OR #2 OR #3 OR #4 OR #5 OR #6 OR #7 OR #8 OR #9 OR #10 OR #11 OR #12 OR #13 OR #14 OR #15 OR #16 OR #17 OR #18) #20 MeSH descriptor Food, Formulated, this term only #21 MeSH descriptor Dietary Supplements explode all trees #22 therapeutic Near/3 (food* or diet*) #23 enrich* Near/3 (food* or diet*) #24 fortifi* Near/3 (food* or diet*) #25 supplement* Near/3 (food* or diet*) #26 ready Near/3 food* #27 RUTF #28 RTUF #29 ready‐to‐use food #30 MeSH descriptor Food, Fortified, this term only #31 (#20 OR #21 OR #22 OR #23 OR #24 OR #25 OR #26 OR #27 OR #28 OR #29 OR #29 OR #30) #32 baby or babies or infant* or child* or boy* or girl* or toddler* or preschool* or pre‐school* or kindergarten* #33 (#19 AND #31 AND #32)
MEDLINE Ovid
Searched 30 November 2010, 26 April 2012 and 4 April 2013
1 nutrition disorders/ 2 malnutrition/ 3 exp protein‐energy malnutrition/ 4 wasting syndrome/ 5 Emaciation/ 6 infant nutrition disorders/ 7 child nutrition disorders/ 8 deficiency diseases/ 9 (undernutrition or under‐nutrition).tw. 10 (undernourish$ or under‐nourish$).tw. 11 (malnutrition or mal‐nutrition).tw. 12 (malnourish$ or mal‐nourish$).tw. 13 (nutrition$ adj defic$).tw. 14 marasmus$.tw. 15 kwashiorkor.tw. 16 emaciat$.tw. 17 (wasted or wasting).tw. 18 (stunted or stunting).tw. 19 or/1‐18 20 Food, Fortified/ 21 Food, Formulated/ 22 exp Dietary Supplements/ 23 (therapeutic adj3 (food$ or diet$)).tw. 24 (enrich$ adj3 (food$ or diet$)).tw. 25 (fortifi$ adj3 (food$ or diet$)).tw. 26 (supplement$ adj3 (food$ or diet$)).tw. 27 (ready adj3 food$).tw. 28 (RUTF or RTUF).tw. 29 or/20‐28 30 19 and 29 31 Infant/ 32 exp Child/ 33 (baby or babies or infant$ or child$ or boy$ or girl$ or toddler$ or preschool$ or pre‐school$ or kindergarten$).tw. 34 31 or 32 or 33 35 30 and 34 36 randomized controlled trial.pt. 37 controlled clinical trial.pt. 38 randomi#ed.ab. 39 placebo$.ab. 40 drug therapy.fs. 41 randomly.ab. 42 trial.ab. 43 groups.ab. 44 or/36‐43 45 exp animals/ not humans.sh. 46 44 not 45 47 35 and 46
Embase Ovid
Searched 30 November 2010, 24 April 2012 and 4 April 2013
1 nutritional deficiency/ 2 nutritional disorder/ 3 protein calorie malnutrition/ 4 malnutrition/ 5 wasting syndrome/ 6 weight reduction/ 7 (undernutrition or under‐nutrition).tw. 8 (undernourish$ or under‐nourish$).tw. 9 (malnutrition or mal‐nutrition).tw. 10 (malnourish$ or mal‐nourish$).tw. 11 (nutrition$ adj defic$).tw. 12 emaciat$.tw. 13 (wasted or wasting).tw. 14 (stunted or stunting).tw. 15 kwashiorkor/ 16 kwas?io?kor.tw. 17 marasmus/ 18 marasmus$.tw. 19 or/1‐18 20 diet supplementation/ 21 "ready to use therapeutic food"/ 22 (therapeutic adj3 (food$ or diet$)).tw. 23 (fortifi$ adj3 (food$ or diet$)).tw. 24 (enrich$ adj3 (food$ or diet$)).tw. 25 (supplement$ adj3 (food$ or diet$)).tw. 26 (ready adj3 food$).tw. 27 (RUTF or RTUF).tw. 28 or/20‐27 29 infant/ 30 exp child/ 31 (baby or babies or infant$ or child$ or boy$ or girl$ or toddler$ or preschool$ or pre‐school$ or kindergarten$).tw. 32 29 or 30 or 31 33 Clinical trial/ 34 Randomized controlled trial/ 35 Randomization/ 36 Single blind procedure/ 37 Double blind procedure/ 38 Crossover procedure/ 39 Placebo/ 40 Randomi#ed.tw. 41 RCT.tw. 42 (random$ adj3 (allocat$ or assign$)).tw. 43 randomly.ab. 44 groups.ab. 45 trial.ab. 46 ((singl$ or doubl$ or trebl$ or tripl$) adj3 (blind$ or mask$)).tw. 47 Placebo$.tw. 48 Prospective study/ 49 (crossover or cross‐over).tw. 50 prospective.tw. 51 or/33‐50 52 19 and 28 and 32 and 51
MEDLINE In‐Process and Other Non‐Indexed Citations Ovid
Searched 24 April 2012 and 4 April 2013
1 (undernutrition or under‐nutrition).tw. 2 (undernourish$ or under‐nourish$).tw. 3 (malnutrition or mal‐nutrition).tw. 4 (malnourish$ or mal‐nourish$).tw. 5 (nutrition$ adj defic$).tw. 6 marasmus$.tw. 7 kwashiorkor.tw. 8 emaciat$.tw. 9 (wasted or wasting).tw. 10 (stunted or stunting).tw. 11 or/1‐10 12 (therapeutic adj3 (food$ or diet$)).tw. 13 (enrich$ adj3 (food$ or diet$)).tw. 14 (fortifi$ adj3 (food$ or diet$)).tw. 15 (supplement$ adj3 (food$ or diet$)).tw. 16 (ready adj3 food$).tw. 17 (RUTF or RTUF).tw. 18 or/12‐17 19 (baby or babies or infant$ or child$ or boy$ or girl$ or toddler$ or preschool$ or pre‐school$ or kindergarten$).tw. 20 11 and 18 and 19
CINAHL EBSCOhost (Cumulative Index to Nursing and Allied Health Literature)
Searched 1 December 2010, 26 April 2012 and 8 April 2013
S33 S18 and S27 and S32 S32 S28 or S29 or S30 or S31 S31 TI(baby or babies or infant* or child* or boy* or girl* or toddler* or preschool* or pre‐school* or kindergarten* ) S30 AB(baby or babies or infant* or child* or boy* or girl* or toddler* or preschool* or pre‐school* or kindergarten* ) S29 AG Infant: 1‐23 months S28 AG child,preschool S27 (S19 or S20 or S21 or S22 or S23 or S24 or S25 or S26) S26 RUTF or RTUF S25 ready N3 food* S24 (supplement* N3 food*) or (supplement* N3 diet*) S23 (fortifi* N3 food*) or (fortifi* N3 diet*) S22 (therapeutic N3 food*) or (therapeutic N3 diet*) S21 (enrich N3 food*) or (enrich N3 diet*) S20 (MH "Dietary Supplements") S19 (MH "Food, Fortified") S18 S1 or S2 or S3 or S4 or S5 or S6 or S7 or S8 or S9 or S10 or S11 or S12 or S13 or S14 or S15 or S16 or S17 S17 (stunted or stunting) S16 (wasted or wasting) S15 emaciat* S14 kwashiorkor* S13 marasmus* S12 (malnourish* or mal‐nourish*) S11 (nutrition defic*) S10 (malnutrition or mal‐nutrition) S9 (undernourish* or under‐nourish*) S8 (undernutrition or under‐nutrition) S7 (MH "Kwashiorkor") S6 (MH "Deficiency Diseases") S5 (MH "Protein‐Energy Malnutrition") S4 (MH "Protein Deficiency") S3 (MH "Infant Nutrition Disorders") S2 (MH "Child Nutrition Disorders") S1 (MH "Nutrition Disorders")
African Index Medicus (indexmedicus.afro.who.int/)
Searched 26 April 2012 and 8 April 2013
Search on : "INFANT NUTRITION DISORDERS" or "CHILD NUTRITION DISORDERS" or "MALNUTRITION" or "EMACIATION" or "KWASHIORKOR" or "MARASMUS" or wasting or wasted or stunting or stunted or emaciat$ [Key Word] and "CHILD" or "infant" or baby or babies or bebe$ or enfant$ or preschool$ [Key Word]
LILACS (Latin American and Caribbean Health Science Information database; lilacs.bvsalud.org/en/)
Searched 26 April 2012 and 8 April 2013
(Mh "malnutrition" or Mh "wasting syndrome" or Mh"protein‐energy malnutrition" or Mh"Emaciation" or Mh" infant nutrition disorders" or Mh " child nutrition disorders" or Mh"deficiency diseases" orTw kwashiorkor or Tw marasmus or Tw emaciat$ or Tw wasting or Tw wasted or Tw stunting or Tw stunted ) [Words] and (Tw child$ or Tw baby or Tw babies or Tw infan$ or Tw enfant$ or Tw bebe$ or Mh "child, PRESCHOOL" or Mh "INFANT") [Words] and ((Pt randomized controlled trial OR Pt controlled clinical trial OR Mh randomized controlled trials OR Mh random allocation OR Mhdouble‐blind method OR Mh single‐blind method) AND NOT (Ct animal AND NOT (Ct human and Ct animal)) OR (Pt clinical trial OR Ex E05.318.760.535$ OR (Tw clin$ AND (Tw trial$ OR Tw ensa$ OR Tw estud$ OR Tw experim$ OR Tw investiga$)) OR ((Tw singl$ OR Tw simple$ OR Tw doubl$ OR Tw doble$ OR Tw duplo$ OR Tw trebl$ OR Tw trip$) AND (Tw blind$ OR Tw cego$ OR Tw ciego$ OR Tw mask$ OR Tw mascar$)) OR Mh placebos OR Tw placebo$ OR (Tw random$ OR Tw randon$ OR Tw casual$ OR Tw acaso$ OR Tw azar OR Tw aleator$) OR Mh research design) AND NOT (Ct animal AND NOT (Ct human and Ct animal)) OR (Ct comparative study OR Ex E05.337$ OR Mh follow‐up studies OR Mh prospective studies OR Tw control$ OR Tw prospectiv$ OR Tw volunt$ OR Tw volunteer$) AND NOT (Ct animal AND NOT (Ct human and Ct animal))) [Words]
Science Citation Index Web of Science
Searched 4 April 2013 (1970 onwards)
#21 #20 AND #19 DocType=All document types; Language=All languages; #20TS=(infant* or child* or preschool* or pre‐school or toddler* or kindergarten* or boy* or girl*) DocType=All document types; Language=All languages; #19#18 AND #17 DocType=All document types; Language=All languages; #18#16 OR #15 OR #14 OR #13 OR #12 OR #11 OR #10 OR #9 OR #8 OR #7 DocType=All document types; Language=All languages; #17#6 OR #5 OR #4 OR #3 OR #2 OR #1 DocType=All document types; Language=All languages; #16TS= ("protein deficien*") DocType=All document types; Language=All languages; #15TS=(" nutrition defic*") DocType=All document types; Language=All languages; #14TS=("nutrition disorder*") DocType=All document types; Language=All languages; #13TS=((emaciat*)) DocType=All document types; Language=All languages; #12TS=((stunted or stunting)) DocType=All document types; Language=All languages; #11TS=((wasted or wasting)) DocType=All document types; Language=All languages; #10TS=((kwashiorkor*)) DocType=All document types; Language=All languages; #9TS=((marasmus*)) DocType=All document types; Language=All languages; #8TS=(malnutrition or undernutrition) DocType=All document types; Language=All languages; #7TS=(malnourish* or undernourish*) DocType=All document types; Language=All languages; #6TS=("ready to use" near/3 food) DocType=All document types; Language=All languages; #5TS=((therapeutic* near/3 (food* or diet*))) DocType=All document types; Language=All languages; #4TS=((supplement* near/3 (food* or diet*))) DocType=All document types; Language=All languages; #3Ts=((fortifi* NEAR/3 (food* or diet*))) DocType=All document types; Language=All languages; #2TS=((enrich* NEAR/3 (food* or diet*))) DocType=All document types; Language=All languages; #1TS=(RUTF or RTUF) DocType=All document types; Language=All languages;
ZETOC (zetoc.jisc.ac.uk/)
Searched 26 April 2012 and 8 April 2013 Limited to Conference search using:
RUTF
RTUF
"therapeutic food"
"ready to use food"
WHO ICTRP (apps.who.int/trialsearch/)
Searched 12 May 2010, 26 April 2012 and 8 April 2013
RUTF OR RTUF OR therapeutic food OR ready to use food
meta‐Register of Current Controlled Trials (mRCT; www.isrctn.com/page/mrct)
Searched 5 December 2010, 26 April 2012 and 8 April 2013
RUTF or RTUF or “therapeutic food” or “ready to use food”
Clinicaltrials.gov (clinicaltrials.gov/)
Searched 5 December 2010, 26 April 2012 and 8 April 2013
RUTF OR therapeutic food OR ready to use food
Appendix 4. Assessment of risk of bias in included RCTs
For more information on the domains and the criteria described below, please see the Cochrane Handbook of Systematic Reviews of Interventions (Higgins 2017).
Domain 1: sequence generation
Adequate: investigators described a random component in the sequence generation process such as those listed below.
Random number table
Coin tossing
Throwing dice
Shuffling cards or envelopes
Inadequate: investigators described a non‐random component in the sequence generation process such as those listed below.
Odd or even date of birth
Day or date of admission
Hospital or clinic record number
Preference of the participant
Results of a laboratory test or series of tests
Unclear: there was insufficient information to permit a judgement of the adequacy in which sequence generation was performed.
Domain 2: allocation concealment
Adequate: neither participants nor investigators enrolling participants could foresee assignment due to the following.
Central allocation (e.g. via the telephone or pharmacy‐controlled)
Sequentially numbered drug containers of a matching appearance
Sequentially numbered, opaque and sealed envelopes
Inadequate: both participants and investigators enrolling participants could foresee upcoming assignment based on, for example, the following.
Using an open random allocation schedule
Assigned envelopes that were unsealed, non‐opaque or not numbered appropriately
Date of birth
Case record number
Unclear: there was insufficient information to permit a judgement of the adequacy of allocation concealment in the sequence generation process.
Domain 3: blinding
We assessed both performance and detection bias. Performance bias refers to systematic differences between groups in the care that is provided, or in exposure to factors other than the interventions of interest; while detection bias refers to systematic differences between groups in how outcomes are determined.
Adequate: when any one of the following was applicable.
No blinding, but review authors judged that the outcome was not influenced by a lack of blinding
Blinding of both key study personnel and participants was ensured, and it was unlikely that blinding was broken
Either participants or some key study personnel were not blinded, but the outcome measurement was blinded and the non‐blinding of others was not likely to introduce bias
Inadequate: when any one of the following was applicable.
No blinding or incomplete blinding
Blinding of both key study personnel and participants was attempted, but it was likely that the blinding was broken
Either key study personnel or participants were not blinded, which was likely to introduce bias
Unclear: there was insufficient information to permit judgement, or the study did not address this outcome at all.
Domain 4: incomplete outcome data
Adequate: when any one of the following was applicable.
No missing outcome data
Reasons for missing outcome data were unlikely to be related to the true outcome
Missing outcome data were balanced in numbers across intervention groups
Missing data were imputed using appropriate methods
For dichotomous data, the proportion of missing outcomes compared with the observed event risk was not enough to have a clinically relevant impact on the intervention effect estimate
For continuous data, the plausible effect size among missing outcomes was not enough to have a clinically relevant impact on the observed effect size
Inadequate: when any one of the following was applicable.
Reasons for missing outcome data were likely to be related to the true outcome
Application of simple imputation was potentially inappropriate
An 'as‐treated' analysis was done with substantial departure of the intervention received from that assigned at randomisation
For dichotomous data, the proportion of missing outcomes compared with the observed event risk was enough to introduce clinically relevant bias in the intervention effect estimate
For dichotomous outcome data, the plausible effect size among missing outcomes was enough to induce clinically relevant bias in the observed effect size
Unclear: there was insufficient reporting of exclusions to permit judgement, or the study did not address this outcome at all.
Domain 5: selective outcome reporting
Adequate: when any one of the following was applicable.
Study protocol was available and all of the prespecified outcomes were addressed in the review in the prespecified way
Study protocol was not available, but it was clear that the published reports included all prespecified and expected outcomes
Inadequate: when any one of the following was applicable.
Not all of the prespecified primary outcomes were reported
One or more of the primary outcomes was reported using measurements of analysis methods that were not prespecified
One or more reported primary outcomes were not prespecified
One or more outcomes of interest in the review were reported incompletely so they could not be entered in a meta‐analysis
Study report failed to include results for a key outcome that was expected to be reported for such a study
Unclear: there was insufficient information to permit judgement of compliance.
Domain 6: other potential threats to validity
Adequate: the study seemed to be free of other sources of bias.
Inadequate: there was the possibility of at least one important risk of bias such as the following.
Quality of the specific study design was in question
Study was stopped early due to some data‐dependent process
Claimed that the study was fraudulent
Unclear: there may have been a risk of bias, but either of the following applied.
Insufficient information to assess whether an important risk of bias existed
Insufficient rationale or evidence that an identified problem introduced bias
Appendix 5. Additional assessment of risk of bias in included cluster‐randomised trials
Domain 1: recruitment bias
Recruitment bias can occur when individuals are recruited to the study after the clusters have been allocated (Higgins 2011). The types of participants recruited can be influenced by the knowledge of whether the specific cluster is an intervention or a control cluster.
Adequate: no participants were recruited after randomisation
Inadequate: additional participants were recruited after randomisation
Unclear: the timing of recruitment of all participants was not reported
Domain 2: baseline imbalance
Cluster‐randomised trials often allocate all clusters at once and therefore a lack of allocation concealment should not usually be a problem (Higgins 2011). However, when there is only a small number of clusters, there is a possibility of chance baseline imbalances between the randomised groups. This may affect either the clusters or the individuals.
Adequate: the baseline comparability of clusters was sufficient, or statistical adjustment for baseline characteristics had occurred (Higgins 2011)
Inadequate: there were significant differences between clusters and no statistical adjustments for baseline characteristics were made accordingly
Unclear: baseline characteristics were not reported, or it was not clear whether the differences between the clusters were significant
Domain 3: loss of clusters
It is possible that complete clusters may be lost from a study, and have to be omitted from the analysis (Higgins 2011). In the same way as for missing outcome data in individually randomised trials, this may lead to bias in cluster‐randomised trials. In addition, missing outcomes for individuals within clusters may also lead to a risk of bias in cluster‐randomised trials.
Adequate: there were no missing data, or the missing data were addressed in the correct manner
Inadequate: there were missing data and they were dealt with in a way that could have introduced bias
Unclear: missing data (either complete clusters or individuals within clusters) were not reported, or it was unclear whether the authors of the primary study had dealt with the missing data adequately (e.g. acceptable statistical adjustments)
Domain 4: incorrect analysis
Sometimes cluster‐randomised trials are analysed by incorrect statistical methods that do not adjusting for clustering (Higgins 2011). Such analyses do not lead to biased estimates of effect but will get undue weight in a meta‐analysis leading to overprecision of the effect estimate. Review authors can estimate an intra‐cluster correlation coefficient (ICC) for such a study, and apply the design effect to the number of events and participants for dichotomous outcomes and to the number of participants for continuous outcomes.
Adequate: the study authors appropriately adjusted for clustering
Inadequate: the study authors did not adjust for clustering and there was too little information (e.g. number of clusters) available for the review authors to calculate and apply an estimated design effect
Unclear: the review authors applied the estimated design effect but it was unclear whether the imputed ICC and thus the design effect was close to the truth
Domain 5: comparability with individually randomised trials
In a meta‐analysis of both cluster‐ and individually randomised trials, or with cluster‐randomised trials with different types of clusters, it is important to consider potential differences between intervention effects (Higgins 2011).
Adequate: the effect estimates of cluster‐randomised trials were similar to those of parallel‐group randomised controlled trials (RCTs)
Inadequate: there was a clear distinction between the effect estimates from cluster‐randomised trials compared to parallel‐group RCTs
Unclear: there seemed to be a distinction between the effect estimates from cluster‐randomised trials compared to parallel‐group RCTs, but it was likely that there was another explanation for the difference, other than just the difference in study design
Data and analyses
Comparison 1. Standard RUTF provided at a dose that meets total daily nutritional requirements versus an alternative dietary approach.
| Outcome or subgroup title | No. of studies | No. of participants | Statistical method | Effect size |
|---|---|---|---|---|
| 1 Recovery during intervention | 6 | 1852 | Risk Ratio (M‐H, Random, 95% CI) | 1.33 [1.16, 1.54] |
| 2 Recovery during intervention: pre‐trial hospitalisation subgroups | 6 | 1852 | Risk Ratio (M‐H, Random, 95% CI) | 1.33 [1.16, 1.54] |
| 2.1 All children hospitalised pre‐trial | 3 | 568 | Risk Ratio (M‐H, Random, 95% CI) | 1.41 [1.04, 1.92] |
| 2.2 Some children hospitalised pre‐trial | 2 | 1258 | Risk Ratio (M‐H, Random, 95% CI) | 1.30 [1.08, 1.57] |
| 2.3 No children hospitalised pre‐trial | 1 | 26 | Risk Ratio (M‐H, Random, 95% CI) | 6.0 [0.83, 43.13] |
| 3 Recovery at follow‐up | 2 | 907 | Risk Ratio (M‐H, Random, 95% CI) | 1.10 [0.83, 1.46] |
| 4 Relapse during intervention | 4 | 1505 | Risk Ratio (M‐H, Random, 95% CI) | 0.55 [0.30, 1.01] |
| 5 Relapse during intervention: pre‐trial hospitalisation subgroups | 4 | 1505 | Risk Ratio (M‐H, Random, 95% CI) | 0.55 [0.30, 1.01] |
| 5.1 All children hospitalised pre‐trial | 2 | 247 | Risk Ratio (M‐H, Random, 95% CI) | 0.34 [0.17, 0.66] |
| 5.2 Some children hospitalised pre‐trial | 2 | 1258 | Risk Ratio (M‐H, Random, 95% CI) | 0.83 [0.53, 1.30] |
| 6 Relapse during intervention: factory‐ versus local site‐produced subgroups | 4 | 1505 | Risk Ratio (M‐H, Random, 95% CI) | 0.65 [0.41, 1.01] |
| 6.1 Factory‐produced | 4 | 1048 | Risk Ratio (M‐H, Random, 95% CI) | 0.56 [0.29, 1.06] |
| 6.2 Local site‐produced | 1 | 457 | Risk Ratio (M‐H, Random, 95% CI) | 0.83 [0.51, 1.33] |
| 7 Relapse during intervention: HIV status subgroups | 4 | 1505 | Risk Ratio (M‐H, Random, 95% CI) | 0.55 [0.30, 1.01] |
| 7.1 HIV‐uninfected or untested | 3 | 1440 | Risk Ratio (M‐H, Random, 95% CI) | 0.62 [0.34, 1.15] |
| 7.2 HIV‐infected | 1 | 65 | Risk Ratio (M‐H, Random, 95% CI) | 0.26 [0.07, 1.04] |
| 8 Relapse at follow‐up | 1 | Risk Ratio (M‐H, Random, 95% CI) | Totals not selected | |
| 9 Mortality during intervention | 4 | 1505 | Risk Ratio (M‐H, Random, 95% CI) | 1.05 [0.51, 2.16] |
| 10 Mortality during intervention: pre‐trial hospitalisation subgroups | 4 | 1505 | Risk Ratio (M‐H, Random, 95% CI) | 1.05 [0.51, 2.16] |
| 10.1 All children hospitalised pre‐trial | 2 | 247 | Risk Ratio (M‐H, Random, 95% CI) | 1.47 [0.53, 4.04] |
| 10.2 Some children hospitalised pre‐trial | 2 | 1258 | Risk Ratio (M‐H, Random, 95% CI) | 0.86 [0.20, 3.73] |
| 11 Rate of weight gain (g/kg/day) during intervention | 4 | 1450 | Mean Difference (IV, Random, 95% CI) | 1.12 [0.27, 1.96] |
| 12 Rate of weight gain (g/kg/day) during intervention: pre‐trial hospitalisation subgroups | 4 | 1450 | Mean Difference (IV, Random, 95% CI) | 1.12 [0.27, 1.96] |
| 12.1 All children hospitalised pre‐trial | 2 | 243 | Mean Difference (IV, Random, 95% CI) | 1.57 [0.32, 2.82] |
| 12.2 Some children hospitalised pre‐trial | 2 | 1207 | Mean Difference (IV, Random, 95% CI) | 0.65 [0.16, 1.14] |
| 13 Rate of weight gain (g/kg/day) during intervention: factory‐ versus local site‐produced subgroups | 4 | 1450 | Mean Difference (IV, Random, 95% CI) | 1.00 [0.34, 1.66] |
| 13.1 Factory‐produced | 4 | 1018 | Mean Difference (IV, Random, 95% CI) | 1.05 [0.08, 2.02] |
| 13.2 Local site‐produced | 1 | 432 | Mean Difference (IV, Random, 95% CI) | 0.88 [0.15, 1.61] |
| 14 Rate of weight gain (g/kg/day) during intervention: HIV status subgroups | 4 | 1450 | Mean Difference (IV, Random, 95% CI) | 1.12 [0.27, 1.96] |
| 14.1 HIV‐uninfected or untested | 3 | 1385 | Mean Difference (IV, Random, 95% CI) | 1.20 [0.08, 2.33] |
| 14.2 HIV‐infected | 1 | 65 | Mean Difference (IV, Random, 95% CI) | 0.80 [‐0.64, 2.24] |
| 15 Time to recovery (days) during intervention | 2 | 556 | Mean Difference (IV, Random, 95% CI) | ‐7.61 [‐12.84, ‐2.37] |
| 16 Weight‐for‐height z score (WHZ) during intervention | 1 | Mean Difference (IV, Random, 95% CI) | Totals not selected | |
| 17 WHZ at follow‐up | 2 | 937 | Mean Difference (IV, Random, 95% CI) | 0.06 [‐0.04, 0.16] |
| 18 Length/height gain (mm/day) during intervention | 2 | 417 | Mean Difference (IV, Random, 95% CI) | 0.12 [‐0.00, 0.24] |
| 19 Height‐for‐age z score (HAZ) at follow‐up | 1 | Mean Difference (IV, Random, 95% CI) | Totals not selected | |
| 20 Mid‐upper arm circumference (MUAC) gain (mm/day) during intervention | 3 | 570 | Mean Difference (IV, Random, 95% CI) | 0.13 [0.04, 0.21] |
| 21 MUAC gain (cm) at follow‐up | 1 | Mean Difference (IV, Random, 95% CI) | Totals not selected | |
| 22 Diarrhoea events during intervention | 1 | Risk Ratio (M‐H, Random, 95% CI) | Totals not selected | |
| 23 Days of diarrhoea during intervention | 1 | Mean Difference (IV, Random, 95% CI) | Totals not selected | |
| 24 Acceptability | 1 | Risk Ratio (M‐H, Random, 95% CI) | Totals not selected |
Comparison 2. Standard RUTF provided at a dose that meets total daily nutritional requirements versus as a supplement to the usual diet.
| Outcome or subgroup title | No. of studies | No. of participants | Statistical method | Effect size |
|---|---|---|---|---|
| 1 Recovery during intervention | 2 | 210 | Risk Ratio (M‐H, Random, 95% CI) | 1.41 [1.19, 1.68] |
| 1.1 HIV‐uninfected children | 1 | 162 | Risk Ratio (M‐H, Random, 95% CI) | 1.38 [1.15, 1.67] |
| 1.2 HIV‐infected children | 1 | 48 | Risk Ratio (M‐H, Random, 95% CI) | 1.62 [1.01, 2.59] |
| 2 Relapse during intervention | 2 | 210 | Risk Ratio (M‐H, Random, 95% CI) | 0.11 [0.01, 0.85] |
| 2.1 HIV‐uninfected children | 1 | 162 | Risk Ratio (M‐H, Random, 95% CI) | 0.07 [0.00, 1.10] |
| 2.2 HIV‐infected children | 1 | 48 | Risk Ratio (M‐H, Random, 95% CI) | 0.20 [0.01, 3.62] |
| 3 Mortality during intervention | 2 | 210 | Risk Ratio (M‐H, Random, 95% CI) | 1.36 [0.46, 4.04] |
| 3.1 HIV‐uninfected children | 1 | 162 | Risk Ratio (M‐H, Random, 95% CI) | 2.07 [0.36, 12.07] |
| 3.2 HIV‐infected children | 1 | 48 | Risk Ratio (M‐H, Random, 95% CI) | 1.05 [0.26, 4.18] |
| 4 Rate of weight gain (g/kg/day) during intervention | 2 | 206 | Mean Difference (IV, Random, 95% CI) | 1.21 [‐0.74, 3.16] |
| 4.1 HIV‐uninfected children | 1 | 158 | Mean Difference (IV, Random, 95% CI) | 2.10 [1.12, 3.08] |
| 4.2 HIV‐infected children | 1 | 48 | Mean Difference (IV, Random, 95% CI) | 0.10 [‐1.53, 1.73] |
| 5 Time to recovery (days) during intervention | 1 | Mean Difference (IV, Random, 95% CI) | Totals not selected | |
| 6 WHZ at follow‐up | 1 | Mean Difference (IV, Random, 95% CI) | Totals not selected | |
| 7 Length/height gain (mm/day) during intervention | 1 | Mean Difference (IV, Random, 95% CI) | Totals not selected | |
| 8 MUAC gain (mm/day) during intervention | 2 | 173 | Mean Difference (IV, Random, 95% CI) | 0.11 [‐0.01, 0.22] |
| 8.1 HIV‐uninfected children | 1 | 125 | Mean Difference (IV, Random, 95% CI) | 0.15 [0.03, 0.27] |
| 8.2 HIV‐infected children | 1 | 48 | Mean Difference (IV, Random, 95% CI) | 0.03 [‐0.14, 0.20] |
Comparison 3. Standard RUTF versus RUTF using an alternative formulation.
| Outcome or subgroup title | No. of studies | No. of participants | Statistical method | Effect size |
|---|---|---|---|---|
| 1 Recovery during intervention | 6 | 4188 | Risk Ratio (M‐H, Random, 95% CI) | 1.03 [0.99, 1.08] |
| 2 Recovery during intervention: pre‐trial hospitalisation subgroups | 6 | 4188 | Risk Ratio (M‐H, Random, 95% CI) | 1.03 [0.99, 1.08] |
| 2.1 All children hospitalised pre‐trial | 1 | 651 | Risk Ratio (M‐H, Random, 95% CI) | 0.95 [0.83, 1.09] |
| 2.2 Some children hospitalised pre‐trial | 2 | 641 | Risk Ratio (M‐H, Random, 95% CI) | 1.09 [0.85, 1.39] |
| 2.3 No children hospitalised pre‐trial | 3 | 2896 | Risk Ratio (M‐H, Random, 95% CI) | 1.06 [0.99, 1.14] |
| 3 Relapse during intervention | 6 | 4188 | Risk Ratio (M‐H, Random, 95% CI) | 0.84 [0.72, 0.98] |
| 4 Relapse during intervention: pre‐trial hospitalisation subgroups | 6 | 4188 | Risk Ratio (M‐H, Random, 95% CI) | 0.84 [0.72, 0.98] |
| 4.1 All children hospitalised pre‐trial | 1 | 651 | Risk Ratio (M‐H, Random, 95% CI) | 0.96 [0.66, 1.40] |
| 4.2 Some children hospitalised pre‐trial | 2 | 641 | Risk Ratio (M‐H, Random, 95% CI) | 0.81 [0.44, 1.52] |
| 4.3 No children hospitalised pre‐trial | 3 | 2896 | Risk Ratio (M‐H, Random, 95% CI) | 0.81 [0.68, 0.97] |
| 5 Mortality during intervention | 7 | 4309 | Risk Ratio (M‐H, Random, 95% CI) | 1.00 [0.80, 1.24] |
| 6 Mortality during intervention: pre‐trial hospitalisation subgroups | 7 | 4309 | Risk Ratio (M‐H, Random, 95% CI) | 1.00 [0.80, 1.24] |
| 6.1 All children hospitalised pre‐trial | 1 | 651 | Risk Ratio (M‐H, Random, 95% CI) | 1.11 [0.86, 1.43] |
| 6.2 Some children hospitalised pre‐trial | 3 | 762 | Risk Ratio (M‐H, Random, 95% CI) | 0.60 [0.16, 2.33] |
| 6.3 No children hospitalised pre‐trial | 3 | 2896 | Risk Ratio (M‐H, Random, 95% CI) | 0.94 [0.67, 1.34] |
| 7 Rate of weight gain (g/kg/day) during intervention | 6 | 3807 | Mean Difference (IV, Random, 95% CI) | 0.11 [‐0.32, 0.54] |
| 8 Rate of weight gain (g/kg/day) during intervention: pre‐trial hospitalisation subgroups | 6 | 3807 | Mean Difference (IV, Random, 95% CI) | 0.11 [‐0.32, 0.54] |
| 8.1 All children hospitalised pre‐trial | 1 | 651 | Mean Difference (IV, Random, 95% CI) | ‐0.25 [‐0.87, 0.37] |
| 8.2 Some children hospitalised pre‐trial | 2 | 650 | Mean Difference (IV, Random, 95% CI) | ‐0.08 [‐0.47, 0.32] |
| 8.3 No children hospitalised pre‐trial | 3 | 2506 | Mean Difference (IV, Random, 95% CI) | 0.34 [‐0.40, 1.07] |
| 9 Rate of weight gain (g/kg/day) during intervention: different types of control RUTF subgroups | 6 | 3807 | Mean Difference (IV, Random, 95% CI) | 0.11 [‐0.32, 0.54] |
| 9.1 Less or no milk powder | 4 | 3015 | Mean Difference (IV, Random, 95% CI) | 0.34 [‐0.10, 0.78] |
| 9.2 Standard plus fatty acids | 1 | 141 | Mean Difference (IV, Random, 95% CI) | ‐0.80 [‐1.74, 0.14] |
| 9.3 Standard plus pre‐ and probiotics | 1 | 651 | Mean Difference (IV, Random, 95% CI) | ‐0.25 [‐0.87, 0.37] |
| 10 Time to recovery (days) during intervention | 1 | Mean Difference (IV, Random, 95% CI) | Totals not selected | |
| 11 WHZ during intervention | 3 | 2090 | Mean Difference (IV, Random, 95% CI) | ‐0.13 [‐0.36, 0.09] |
| 12 WHZ during intervention: pre‐trial hospitalisation subgroups | 3 | 2090 | Mean Difference (IV, Random, 95% CI) | ‐0.13 [‐0.36, 0.09] |
| 12.1 Some children hospitalised pre‐trial | 1 | 75 | Mean Difference (IV, Random, 95% CI) | ‐0.13 [‐0.40, 0.14] |
| 12.2 No children hospitalised pre‐trial | 2 | 2015 | Mean Difference (IV, Random, 95% CI) | ‐0.19 [‐0.62, 0.25] |
| 13 WHZ during intervention: different types of control RUTF subgroups | 3 | 2090 | Mean Difference (IV, Random, 95% CI) | ‐0.13 [‐0.36, 0.09] |
| 13.1 Less or no milk powder | 2 | 1949 | Mean Difference (IV, Random, 95% CI) | ‐0.02 [‐0.11, 0.08] |
| 13.2 Standard plus fatty acids | 1 | 141 | Mean Difference (IV, Random, 95% CI) | ‐0.45 [‐0.83, ‐0.07] |
| 14 WHZ during intervention | 2 | 1949 | Mean Difference (IV, Random, 95% CI) | 0.07 [‐0.06, 0.20] |
| 15 Length/height gain (mm/day) during intervention | 3 | 2090 | Mean Difference (IV, Random, 95% CI) | 0.01 [‐0.09, 0.10] |
| 16 Length/height gain (mm/day) during intervention: pre‐trial hospitalisation subgroups | 3 | 2090 | Mean Difference (IV, Random, 95% CI) | 0.01 [‐0.09, 0.10] |
| 16.1 Some children hospitalised pre‐trial | 1 | 75 | Mean Difference (IV, Random, 95% CI) | 0.09 [‐0.15, 0.33] |
| 16.2 No children hospitalised pre‐trial | 2 | 2015 | Mean Difference (IV, Random, 95% CI) | ‐0.01 [‐0.14, 0.11] |
| 17 Length/height gain (mm/day) during intervention: different types of control RUTF subgroups | 3 | 2090 | Mean Difference (IV, Random, 95% CI) | 0.01 [‐0.09, 0.10] |
| 17.1 Less or no milk powder | 2 | 1949 | Mean Difference (IV, Random, 95% CI) | 0.04 [0.02, 0.06] |
| 17.2 Standard plus fatty acids | 1 | 141 | Mean Difference (IV, Random, 95% CI) | ‐0.09 [‐0.21, 0.03] |
| 18 HAZ during intervention | 2 | 1949 | Mean Difference (IV, Random, 95% CI) | 0.09 [‐0.04, 0.22] |
| 19 MUAC gain (mm/day) during intervention | 3 | 2089 | Mean Difference (IV, Random, 95% CI) | 0.02 [‐0.02, 0.07] |
| 20 MUAC gain (mm/day) during intervention: pre‐trial hospitalisation subgroups | 3 | 2089 | Mean Difference (IV, Random, 95% CI) | 0.02 [‐0.02, 0.07] |
| 20.1 Some children hospitalised pre‐trial | 1 | 74 | Mean Difference (IV, Random, 95% CI) | 0.04 [‐0.01, 0.09] |
| 20.2 No children hospitalised pre‐trial | 2 | 2015 | Mean Difference (IV, Random, 95% CI) | ‐0.00 [‐0.11, 0.10] |
| 21 MUAC gain (mm/day) during intervention: different types of control RUTF subgroups | 3 | 2089 | Mean Difference (IV, Random, 95% CI) | 0.02 [‐0.02, 0.07] |
| 21.1 Less or no milk powder | 2 | 1948 | Mean Difference (IV, Random, 95% CI) | 0.04 [0.02, 0.06] |
| 21.2 Standard plus fatty acids | 1 | 141 | Mean Difference (IV, Random, 95% CI) | ‐0.07 [‐0.17, 0.03] |
| 22 Diarrhoea events during intervention | 1 | Risk Ratio (M‐H, Random, 95% CI) | Totals not selected | |
| 23 Acceptability on first day of intervention | 1 | Risk Ratio (M‐H, Random, 95% CI) | Totals not selected | |
| 24 Acceptability: grams of food remained after taste test | 1 | Mean Difference (IV, Random, 95% CI) | Totals not selected | |
| 25 Acceptability after first 2 weeks of treatment | 1 | Risk Ratio (M‐H, Random, 95% CI) | Totals not selected |
Characteristics of studies
Characteristics of included studies [ordered by study ID]
Bahwere 2014.
| Methods |
Comparison addressed in this review: 3 Study design: individually randomised, controlled, non‐inferiority trial Study period: March 2010‐March 2011 Country and setting: central Malawi, 17 outpatient treatment programme sites Sample size calculation: yes, used weight gain and recovery Child growth standards used for anthropometrical data: not reported (reported anthropometrical data at baseline by using WHZ, WAZ and HAZ) Quality of anthropometrical measurements: outcome assessors trained and monitored; weight and MUAC measurements adequately described; length/height measurement not described, only done at baseline Tested for peanut allergies: not reported |
|
| Participants |
Definition used for SAM: MUAC < 11.0 cm or pitting oedema of grade 1 or 2 Eligible age range: 6‐59 months All randomised children meet review eligibility criteria: yes Total number randomised: 600 children Inclusion criteria
Exclusion criteria
HIV and TB status and treatment: HIV was not seen as a complication and an HIV test was offered to all caregivers but not performed systematically. Experimental group: HIV‐infected children = 6/112; control group: HIV‐infected children = 17/129. Nothing about antiretroviral treatment reported. Nothing about TB comorbidity reported Baseline characteristics of experimental group: 154/292 = male; mean age = 24.5 (SD = 10.3) months; previous episode of SAM = 8/292; oedema being the admission criteria = 241/292; mean WAZ = −2.68 (SD = 1.44); mean HAZ = −3.30 (SD = 2.36); mean WHZ = −1.30 (SD = 1.64); mean MUAC = 12.49 (SD = 1.47) cm; diarrhoea = 68/282; fever = 95/279; breastfeeding = not reported Baseline characteristics of control group: 145/303 = male; mean age = 25 (SD = 11.0) months; previous episode of SAM = 16/303; oedema being the admission criteria = 249/303; mean WAZ = −2.75 (SD = 1.32); mean HAZ = −3.26 (SD = 2.02); mean WHZ = −1.32 (SD = 1.42); mean MUAC = 12.57 (SD = 1.6) cm; diarrhoea = 71/288; fever = 94/283; breastfeeding = not reported Stabilised in hospital before start of trial: children with SAM with complications were first referred to inpatient care and were eligible for study inclusion once they were back at the outpatient department. Experimental group: 8/292; control group: 9/303 Rehabilitation started in hospital: no |
|
| Interventions |
Number of arms: 2 Maximum intervention duration: 16 weeks Sample size experimental group: 292 children randomised Sample size control group: 308 children randomised Experimental intervention: "P‐RUTF" (quote). "Standard peanut‐based RUTF" (quote) manufactured in a factory in Malawi by Valid Nutrition. Contained 25% dried skim milk, 27% sugar, 26% peanut paste, 20% soybean oil; as well as micronutrients. Provided 2218 kJ/100 g, protein = 12% of total energy, fat = 56% of total energy. Packaged in identical 250 g pots. Provided around 732 kJ/kg/day Control intervention: "WPC‐RUTF" (quote): RUTF with whey protein manufactured in a factory in Malawi by Valid Nutrition. Contained 24% WPC34, 28% sugar, 28% peanut paste, 20% soybean oil; as well as micronutrients. Provided 2218 kJ/100 g, protein = 12% of total energy, fat = 56% of total energy. Packaged in identical 250 g pots. Provided around 732 kJ/kg/day Concomitant treatment: all children got a 5‐day course of amoxicillin, a single 100 mg dose of deworming medication, and health and nutrition advice. Risk that intervention was shared with siblings: yes. It is likely that in families who were food insecure, RUTF was shared among siblings. There was the same risk in both groups. |
|
| Outcomes |
How often were children assessed during home‐based rehabilitation? Once a week Followed up after intervention period? No Outcomes during or at the end of the intervention period Primary outcomes
Secondary outcomes
|
|
| Notes |
Trial registry number: not reported Type of study report: published journal article Contacted study authors: yes. We obtained information on outcome definitions and SDs for the outcome weight gain. Ethics approval: Malawi National Health Sciences Research Committee (NHSRC) of the Ministry of Health Informed consent: carers provided written informed consent. Financial contributors: the Clinton Foundation and the US Dairy Export Council (USDEC) Conflict of interest declared: study author VO was an employee of Valid Nutrition; study author SC is the unpaid director of Valid Nutrition. |
|
| Risk of bias | ||
| Bias | Authors' judgement | Support for judgement |
| Random sequence generation (selection bias) | Low risk | Quote: "A computer‐generated sequentially numbered randomisation list (with variable block sizes) that contained both allocations and codes for 700 children was pre‐prepared by the trial statistician based outside Malawi and sent to the national study coordinator..." |
| Allocation concealment (selection bias) | Low risk | Quote: "…the national study coordinator who then prepared 700 opaque, sealed and consecutively numbered randomisation envelopes. The envelopes were distributed to the enumerator team leaders at study sites in a block of 20 envelopes. In the field, the caretakers were asked to randomly pick a sealed opaque envelope containing the arm code." |
| Blinding of participants and personnel (performance bias) All outcomes | Low risk | Quote: "The two RUTFs... were packaged in identical 250‐g pots and were labelled with a letter code. The RUTFs were similar in colour, texture and smell. The investigators directly involved in supervision, child recruitment, and management and outcome assessment were blinded to the identity of the letter codes. All non‐participating staff of the research sites and the caregivers of enrolled children were also blinded to the identity of the RUTFs." Furthermore, children across groups received the same contact time with study personnel. |
| Blinding of outcome assessment (detection bias) All outcomes | Low risk | Quote: "The investigators directly involved in supervision, child recruitment, and management and outcome assessment were blinded to the identity of the letter codes." |
| Incomplete outcome data (attrition bias) All outcomes | Unclear risk | Comment: ITT and per‐protocol analyses were performed and reported separately. For the ITT analysis, it was not reported how missing data were handled. The denominators for the per‐protocol analysis were explained sufficiently on page 442, with 256/292 (87.7%) for the experimental group compared to 266/303 (87.8%) for the control group. |
| Selective reporting (reporting bias) | Unclear risk | Comment: protocol or study registration number not reported. In the article's Discussion section, the study authors referred to a protocol: "Although the initial protocol included the assessment of body composition, this objective was later dropped because of financial constraints" (quote). The protocol was not cited. The expected outcomes were pre‐specified in the Methods section and reported in the Results section. However, the study authors reported that, at each visit, caregivers were asked about acceptability of the RUTF; however, these results were not reported. |
| Other bias | Low risk | Comment: more participants in the experimental group were HIV‐infected (5.4% (6/112) of the experimental group compared to 13.2% (17/129) in control group). This is likely because of chance, as other baseline characteristics appear similar across groups. |
Bhandari 2016.
| Methods |
Comparison addressed in this review: 1 Study design: individually randomised controlled trial; multicentre Study period: October 2012‐April 2015 Country and setting: 3 diverse geographical settings in India: Rajasthan, Tamil Nadu and Delhi; low‐income households in both rural and urban areas; sites also varied in programmatic context Sample size calculation: yes, recovery rate Child growth standards used for anthropometrical data: WHO Child Growth Standards 2006 Quality of anthropometrical measurements: outcome assessors trained, standardisation of teams and daily calibration of equipment; weight, height/length and MUAC measurements adequately described Tested for peanut allergies: not reported. Children with known milk allergy excluded; one child excluded due to "clinically diagnosed allergy" (quote) but unclear as to which substance |
|
| Participants |
Definition used for SAM: WHZ ≥ −2 and absence of oedema of feet Eligible age range: 6‐59 months All randomised children meet review eligibility criteria: yes Total number randomised: 906 children Inclusion criteria
Exclusion criteria
These children were considered complicated SAM cases and were referred to inpatient care. HIV and TB status and treatment: not reported Baseline characteristics of experimental group, RUTF‐C: 181/298 = male; mean age = 24.7 (SD = 13.9) months; mean WHZ = −3.5 (SD = 0.4); mean HAZ = −2.9 (SD = 1.2); mean MUAC = 11.8 (SD = 0.8) cm; fever,diarrhoea, cough or fast breathing in previous 2 weeks = 162/298; breastfeeding = not reported Baseline characteristics of experimental group, RUTF‐L: 178/307 = male; mean age = 25.7 (SD = 14.0) months; mean WHZ = −3.4 (SD = 0.4); mean HAZ = −3.1 (SD = 1.4); mean MUAC = 11.8 (SD = 0.8) cm; fever, diarrhoea, cough or fast breathing in previous 2 weeks = 166/307; breastfeeding = not reported Baseline characteristics of control group: 166/301 = male; mean age = 25.7 (SD = 14.1) months; mean WHZ = −3.5 (SD = 0.5); mean HAZ = −3.0 (SD = 1.3); mean MUAC = 11.8 (SD = 0.8) cm; fever, diarrhoea, cough or fast breathing in previous 2 weeks = 159/301; breastfeeding = not reported Stabilised in hospital before start of trial: 98/906 children were stabilised in hospital before enrolment into the study (not reported how many per group) Rehabilitation started in hospital: rehabilitation only took place at home, but children who relapsed were taken up in hospital and restarted the study intervention upon discharge |
|
| Interventions |
Number of arms: 3 Number of arms used in this review: all 3 Maximum intervention duration: 16 weeks Sample size experimental group: "RUTF‐C" (quote) = 298 children randomised; "RUTF‐L" (quote) = 307 children randomised Sample size control group: 301 children randomised Experimental intervention 1: "RUTF‐C". Centrally produced RUTF, manufactured by Compact India. Contained 30% peanut paste, 29% sugar, 20% milk solids, 18% vegetable oil, as well as mineral and vitamin mixes. Provided 2272 kJ/100 g, protein = 15% of total energy, lipids = 34.8% of total energy, carbohydrates = 43.5% of total energy. Smooth texture, and thick and sticky. Packaged in 92 g sachets. Provided around 732 kJ/kg/day Experimental intervention 2: "RUTF‐L" (quote). Locally produced RUTF (RUTF‐L) were prepared at each site, and a consultant who had participated in African studies trained the site teams to produce the RUTF under stringent conditions in a designated room. Contained 26% peanut paste, 27% sugar, 25% milk solids, 20% vegetable oil, as well as mineral and vitamin mixes. Provided 2209 kJ/100 g, protein = 15% of total energy, lipids = 33% of total energy, carbohydrates = 46% of total energy. Thinner consistency than RUTF‐C, and granular texture. Packaged in transparent food grade 250 g jars. Provided around 732 kJ/kg/day Control intervention: "A‐HPF" (quote). Energy‐dense home‐prepared foods. Families of children were given raw ingredients to prepare foods; ingredients included locally available and acceptable cereals and pulses, sugar, oil, milk and eggs. Recipes for making energy‐rich and nutrient‐rich foods for children were promoted. A micronutrient preparation was also provided for caregivers to add to the cooked meal before feeding. Amounts in excess of that needed by SAM children were provided, as sharing within the family was expected. Provided around 732 kJ/kg/day for the SAM child Concomitant treatment: all children received oral amoxicillin for 5 days; those aged ≥ 2 years were given deworming medication for 3 days; vitamin A to children with signs or symptoms of a deficiency; immunisation as per the national schedule; children with anaemia (haemoglobin ≥ 6 to ≤ 11 g/dL) in the A‐HPF group were given iron and folic acid. Risk that intervention was shared with siblings: yes, in the 2 RUTF groups but not in the control group, as enough raw ingredients were given for sharing within the family. |
|
| Outcomes |
How often were children assessed during home‐based rehabilitation? Once a week Followed up after intervention period? Yes. All children were followed up and measured at 16 weeks after the end of the intervention period. Outcomes during or at the end of the intervention period Primary outcomes
Secondary outcomes
|
|
| Notes |
Trial registry number: NCT01705769; CTRI 2012/10/003054 Type of study report: published journal article Contacted study authors: yes. The contact author clarified the data for MUAC at follow‐up, and provided us with results on the number of children hospitalised during the follow‐up period. Ethics approval: "The study was approved by the institutional ethics committees of each participating institution (Society for Applied Studies, New Delhi: SAS ERC/40/2012; Christian Medical College, Vellore: IRB‐A13‐19‐09‐2012; Action Research and Training for Health, Udaipur: ARTH IEC dated 14 January 2013) and the WHO Ethics Review Committee (Protocol ID RPC538)" (quote) Informed consent: "Written informed consent was obtained from caregivers for each different activity" (quote) Financial contributors: Bill & Melinda Gates Foundation (grant number OPP1033634) Conflict of interest declared: yes. Study authors RB and SY declared they were/are staff members of the WHO. |
|
| Risk of bias | ||
| Bias | Authors' judgement | Support for judgement |
| Random sequence generation (selection bias) | Low risk | Quote: "A statistician, not otherwise involved with the study, prepared randomisation lists. Randomisation was stratified by site and age categories…using block sizes of variable length…". |
| Allocation concealment (selection bias) | Low risk | Quote: "Allocation into study groups was concealed using Serially Numbered Opaque Sealed Envelopes (SNOSE) prepared by WHO… the SNOSE next in sequence was opened only after completing an enrolment." |
| Blinding of participants and personnel (performance bias) All outcomes | Low risk | Comment: caregivers of participant children could not be blinded, but it is unlikely that a lack of blinding could have affected the children's outcomes such as recovery, relapse, mortality, time to recovery and anthropometrical outcomes. Children across groups received the same contact time with study personnel. |
| Blinding of outcome assessment (detection bias) All outcomes | Low risk | Quote: "During the treatment phase, an independent outcome measurement team took weekly anthropometric measurements. This team was blinded as far as possible to the group to which the child was allocated." |
| Incomplete outcome data (attrition bias) All outcomes | Low risk | Comment: loss to follow‐up was small and not differential: for the experimental group, 557/605 (92%), and for the control group, 285/301 (95%) completed the intervention period. |
| Selective reporting (reporting bias) | Unclear risk | Comment: trial registration numbers: NCT01705769 and CTRI 2012/10/003054. Expected outcomes were prespecified and addressed. However, results for change in WHZ, HAZ and MUAC between the intervention period and follow‐up were reported but were not prespecified as outcomes. In the trial registry entry, and in the Methods section of the article, the study authors prespecified that data on hospitalisations at follow‐up (sustenance phase, 16 weeks after the intervention period) was collected; however, these results were not reported. |
| Other bias | Low risk | Comment: nutritional baseline characteristics appear similar across groups. |
Ciliberto 2005.
| Methods |
Comparison addressed in this review: 1 Study design: stepped‐wedge design treated as quasi‐randomised cluster trial Study period: December 2002‐June 2003 Country and setting: southern Malawi; outpatients to NRUs Sample size calculation: yes, recovery rate Child growth standards used for anthropometrical data: NCHS reference population Quality of anthropometrical measurements: not adequately described Tested for peanut allergies: not reported |
|
| Participants |
Definition used for SAM: WHZ < −3 (NCHS reference population) or oedema Eligible age range: 10‐60 months All randomised children meet review eligibility criteria: no. Children with MAM (WHZ < −2 ) and SAM were randomised together (not stratified), but results reported separately Total number randomised: 645 SAM children (effective sample size = 352) Inclusion criteria
Exclusion criteria
HIV and TB status and treatment: not reported Baseline characteristics of experimental group (including MAM children): 526/992 = male; mean age = 23 (SD = 10) months; oedema = 434/992; mean weight = 7.7 (SD = 1.7) kg; mean length = 74.8 (SD = 6.6) cm; mean WAZ = −3.5 (SD = 1.0); mean HAZ = −3.0 (SD =1.5); mean WHZ = −2.2 (SD = 0.8); mean MUAC = 11.6 (SD = 1.4) cm; children still breastfeeding = 505/992; mean age when breastfeeding stopped = 21 (SD 7) months Baseline characteristics of control group (including MAM children): 98/186 = male; mean age = 24 (SD = 12) months; oedema = 86/186; mean weight = 7.6 (SD = 1.9) kg; mean length = 75.0 (SD = 7.6) cm; mean WAZ = −3.7 (SD = 1.0); mean HAZ = −3.2 (SD = 1.6); mean WHZ = −2.5 (SD = 0.9); mean MUAC = 11.6 (SD = 1.5) cm; children still breastfeeding = 72/186; mean age when breastfeeding stopped = 21 (SD 8) months Stabilised in hospital before start of study: yes, the "very ill" (quote) received F‐75, containing 75 kCal/100 mL (314 kJ/100 mL) and 0.9 g protein/100 mL, and parenteral antibiotics. Experimental group: 347/992 were hospitalised with a mean of 11 (SD = 9) days; control group: 186/186 were hospitalised with a mean of 22 (SD = 14) days. Rehabilitation started in hospital: yes, all children in the control group were on F‐100 first, and upon discharge, received fortified flour. The children from the experimental group who were stabilised in hospital received F‐100, and upon discharge, RUTF. |
|
| Interventions |
Number of arms: 2 Maximum intervention duration: 8 weeks Sample size experimental group: 532 children randomised (effective sample size = 290) Sample size control group: 113 children randomised (effective sample size = 62) Experimental intervention: RUTF. Locally produced by the study team and Tambala Foods (Blantyre, Malawi). Ingredients were: 25% peanut butter; 28% sugar; 30% full‐fat milk; 15% vegetable oil; 1.4% imported micronutrients (Nutriset). A 260 g, daily portion provided 175 kCal/kg/day (732 kJ/kg/day) and 5.3 g/kg/day protein. Control intervention: "standard therapy" (quote). Maize and soy blended flour supplemented with micronutrients at home. Blended flour (80% maize, 20% soy) prepared by carer and to be consumed 7 times/day; each received 50 kg of flour Concomitant treatment: not reported Risk that intervention was shared with siblings: yes. Families with a child in the control group received "a generous supply" (quote) of flour, which was meant to be shared, while children in the RUTF group only received RUTF for them. It is likely that the RUTF or RUTF supplement was shared among siblings. |
|
| Outcomes |
How often were children assessed during home‐based rehabilitation? Once every 2 weeks Followed up after intervention period? Yes. Children who recovered were asked to come back 6 months after the end of the intervention period. Outcomes during or at the end of the intervention period Primary outcomes
Secondary outcomes
|
|
| Notes |
Trial registry number: not reported Type of study report: published journal article Contacted study authors: yes. We obtained the definition for relapse at follow‐up, separate data for SAM children, and separate data for the outcomes of relapse and death. Ethics approval: College of Medicine Research and Ethics Committee of the University of Malawi; Human Studies Committee of Washington University in St Louis Informed consent: obtained; not reported whether it was provided orally or in writing Financial contributors: Doris Duke Clinical Scholars Programme; St Louis Children's Hospital Foundation; World Food Programme; Valid International; US Agency for International Development Conflict of interest declared: the study authors reported they had no conflicts of interest. |
|
| Risk of bias | ||
| Bias | Authors' judgement | Support for judgement |
| Random sequence generation (selection bias) | High risk | Quote: "...systematic allocation with a stepped wedge design...". |
| Allocation concealment (selection bias) | High risk | Comment: quasi‐randomised study; therefore, prediction of next allocation possible |
| Blinding of participants and personnel (performance bias) All outcomes | Low risk | Comment: blinding not done because the experimental and control interventions looked very different. However, it is unlikely that the lack of blinding of caregivers and study personnel could have led to a high risk of performance bias in children for outcomes such as recovery, relapse, mortality, weight gain and time to recovery. Children across groups received the same contact time with study personnel. |
| Blinding of outcome assessment (detection bias) All outcomes | Unclear risk | Comment: outcome assessors were not blinded. The majority of outcomes were dependent on anthropometrical measurements. It is unclear how lack of blinding affected outcome measurements. |
| Incomplete outcome data (attrition bias) All outcomes | Unclear risk | Comment: loss to follow‐up was small and not differential: 98/992 (9.9%) from the experimental group and 15/186 (8.1%) from the control group dropped out of the study. However, only a subgroup of randomised participants was eligible to be included in our review, and it is unclear whether randomisation in this smaller group was preserved. |
| Selective reporting (reporting bias) | Unclear risk | Comment: protocol and trial registration entry not available; primary and secondary outcome prespecified in the Methods section and addressed in the Results section |
| Other bias | Unclear risk | Comment: baseline characteristics reported per group; however, the characteristics for the subgroup of children relevant to our review was not reported. |
Hsieh 2015a.
| Methods |
Comparison addressed in this review: 3 Study design: individually randomised controlled trial Study period: January‐May 2014 Country and setting: southern Malawi, 6 rural clinics Sample size calculation: yes, increase in plasma DHA and EPA Child growth standards used for anthropometrical data: not reported Quality of anthropometrical measurements: not reported Tested for peanut allergies: not reported |
|
| Participants |
Definition used for SAM: MUAC < 11.5 cm or bilateral pitting oedema, or both Eligible age range: 6‐59 months All randomised children meet review eligibility criteria: yes Total number randomised: 141 children Inclusion criteria
Exclusion criteria
HIV and TB status and treatment: children with HIV were not excluded but the proportion of study participants with HIV was not reported; nothing about TB comorbidity was reported Baseline characteristics of experimental group: 25/70 = male; mean age = 19 (SD = 9.7) months; oedematous malnutrition = 44/70; mean HAZ = −2.9 (SD = 1.4); mean WHZ = −1.8 (SD = 1.1); mean MUAC = 12.0 (SD = 1.2); mother HIV‐infected = 8/70; currently breastfeeding = 33/70 Baseline characteristics of control group: 27/71 = male; mean age = 20 (SD = 13) months; oedematous malnutrition = 41/71; mean HAZ = −3.3 (SD = 1.7); mean WHZ = −1.9 (SD = 1.0); mean MUAC = 11.8 (SD = 1.3); mother HIV‐infected = 2/71; currently breastfeeding = 33/71 Stabilised in hospital before start of study: no Rehabilitation started in hospital: no |
|
| Interventions |
Number of arms: 2 Maximum intervention duration: 12 weeks Sample size experimental group: 70 children randomised Sample size control group: 71 children randomised Experimental intervention: RUTF. S‐RUTF manufactured by Project Peanut Butter in Malawi. Contained 27.0% peanuts, 25.8% palm oil, 2.9% soy oil, 25.0% dry skimmed milk, 26.0% sugar and maltodextrin, with added micronutrients. Provided 2356 kJ/100g, protein = 15.9%, total fat = 42.4%. Nothing about packaging reported. Provided about 735 kJ/kg/day Control intervention: "HO‐RUTF" (quote) manufactured by Nutriset (Malaunay, France). Contained 24.6% high oleic peanuts, 13.0% palm oil, 8.2% linseed oil, dry skimmed milk 17.2%, 14.5% sweet whey, 19.0% sugar and maltodextrin, 3.3% micronutrients and mono‐ and diglyceride emulsifier. Contained more omega‐3 ALA and less omega‐6 LA than the standard RUTF. Other than fatty acid content, nutrient content similar to S‐RUTF. Provided 2326 kJ/100g, protein = 14.3%, total fat = 35.3%. Nothing about packaging reported. Provided about 735 kJ/kg/day Concomitant treatment: not reported Risk that intervention was shared with siblings: unclear risk. Although actions were taken to reduce the risk of the study participants sharing their RUTF, this was only done where participant children had a well‐nourished twin within the household. |
|
| Outcomes |
How often were children assessed during home‐based rehabilitation? Once every 2 weeks Followed‐up after intervention period? No Outcomes during or at the end of the intervention period Primary outcomes
Secondary outcomes
|
|
| Notes |
Trial registry number: NCT02053857 Type of study report: published journal article Contacted study authors: yes. We obtained confirmation that no children were stabilised in hospital pre‐trial. Ethics approval: University of Malawi, the College of William and Mary, and Washington University in St. Louis Informed consent: informed consent was obtained from village leaders and health advocates; and informed, signed consent from caregivers. Financial contributors: NIH grant R01 AT007003 from the National Center for Complementary and Integrative Health (NCCIH) and the Office of Dietary Supplements (ODS) Conflict of interest declared: the study authors declared they had none. |
|
| Risk of bias | ||
| Bias | Authors' judgement | Support for judgement |
| Random sequence generation (selection bias) | Unclear risk | Quote: "Subjects were randomized to either…", but method of randomisation not reported |
| Allocation concealment (selection bias) | Low risk | Quote: "Subjects were randomized… by choosing a treatment designation in a sealed envelope, prepared by a study assistant who did not participate in the data collection or analysis." |
| Blinding of participants and personnel (performance bias) All outcomes | Low risk |
Quote: "The children, caretakers, and clinical workers were blinded to the assigned intervention.", but it is not reported how blinding was done. Comment: however, it is unlikely that a lack of blinding would have influenced the children's outcomes such as recovery, mortality and anthropometrical outcomes. Also, children from both groups received the same contact time with study personnel. |
| Blinding of outcome assessment (detection bias) All outcomes | Unclear risk |
Quote: "...clinical workers were blinded to the assigned intervention." Comment: the experimental and control RUTFs were produced in Malawi and France respectively, and it is not reported how blinding was done. |
| Incomplete outcome data (attrition bias) All outcomes | Low risk | Comment: loss to follow‐up was somewhat differential, but small: for the experimental group, 6/70 (8.6%), and for the control group, 2/71 (2.8%) dropped out during the 12 weeks of the intervention period. |
| Selective reporting (reporting bias) | Unclear risk | Comment: trial registration number: NCT02053857. The expected outcomes were prespecified in the trial registration and Methods section of article, and addressed in Results section. In the Results section, the study authors reported that no "adverse reactions to any of the study foods were reported" (quote). However, it was not prespecified that adverse reactions were measured, and how. |
| Other bias | Low risk | Comment: reported baseline characteristics seems to be similar across groups except for the experimental group, in which 11% (8/70) of mothers had HIV‐infection compared to 3% (2/71) in the control group, but this is probably because of chance, as other characteristics appear similar across groups. |
Hsieh 2015b.
| Methods |
Comparison addressed in this review: 3 Study design: individually randomised controlled trial Study period: June‐August 2013 Country and setting: Malawi Sample size calculation: not reported Child growth standards used for anthropometrical data: not applicable Quality of anthropometrical measurements: not applicable Tested for peanut allergies: not reported |
|
| Participants |
Definition used for SAM: not reported Eligible age range: 6 months‐5 years All randomised children meet review eligibility criteria: unclear Total number randomised: 148 children Inclusion criteria: not reported Exclusion criteria: not reported HIV and TB status and treatment? not reported Baseline characteristics of experimental group: not reported Baseline characteristics of control group: not reported Stabilised in hospital before start of study: not reported Rehabilitation started in hospital: not reported |
|
| Interventions |
Number of arms: 2 Maximum intervention duration: not reported Sample size experimental group: 74 children Sample size control group: 74 children Experimental intervention: RUTF. S‐RUTF manufactured by Project Peanut Butter in Malawi. Contained 27.0% peanuts, 25.8% palm oil, 2.9% soy oil, 25.0% dry skimmed milk, 26.0% sugar and maltodextrin, with added micronutrients. Provided 2356 kJ/100g, protein = 15.9%, total fat = 42.4%; nothing about packaging reported Control intervention: "HO‐RUTF" (quote) manufactured by Nutriset (Malaunay, France). Contained 24.6% high oleic peanuts, 13.0% palm oil, 8.2% linseed oil, dry skimmed milk 17.2%, 14.5% sweet whey, 19.0% sugar and maltodextrin, 3.3% micronutrients and mono‐ and diglyceride emulsifier. Contained more omega‐3 ALA and less omega‐6 LA than the S‐RUTF. Other than fatty acid content, nutrient content similar to S‐RUTF. Provided 2326 kJ/100g, protein = 14.3%, total fat = 35.3%. Nothing about packaging reported Concomitant treatment: not reported Risk that intervention was shared with siblings: not applicable. Acceptability trial |
|
| Outcomes |
How often were children assessed during home‐based rehabilitation? Not applicable Followed‐up after intervention period? No Outcomes during or at the end of the intervention period Primary outcomes
Secondary outcomes
|
|
| Notes |
Trial registry number: not reported Type of study report: reported briefly in Hsieh 2015a Contacted study authors: yes. We established from the study author that no further or separate documentation for this study is available. Ethics approval: not reported Informed consent: not reported Financial contributors: not reported Conflict of interest declared: not reported |
|
| Risk of bias | ||
| Bias | Authors' judgement | Support for judgement |
| Random sequence generation (selection bias) | Unclear risk | Quote: "Each child was randomly assigned…", but method of randomisation not reported. |
| Allocation concealment (selection bias) | Unclear risk | Comment: Not reported |
| Blinding of participants and personnel (performance bias) All outcomes | Unclear risk | Comment: it is reported that the acceptability study was "double‐blind" (quote), but it is not reported how blinding was done. It is possible that if the caregivers knew what intervention their child was getting, they could have influenced their child to eat more or less of it, according to their own taste preferences or perception of the product. |
| Blinding of outcome assessment (detection bias) All outcomes | Unclear risk | Comment: it is reported that the acceptability study was "double‐blind" (quote), but it is not reported how blinding was done. It is not reported who measured the time of consumption and who weighed the remaining food. Caregivers completed a survey that assessed each child's appetite and likeability of the food. |
| Incomplete outcome data (attrition bias) All outcomes | Unclear risk | Comment: denominators not given for all relevant acceptability outcomes |
| Selective reporting (reporting bias) | Unclear risk | Comment: protocol, trial registry entry or full‐text paper with detailed methods not available |
| Other bias | Unclear risk | Comment: baseline characteristics not reported |
Irena 2015.
| Methods |
Comparison addressed in this review: 3 Study design: stratified, cluster‐randomised controlled, equivalence trial Study period: June 2009‐August 2010 Country and setting: 24 out of 26 healthcare clinics in Lusaka, Zambia Sample size calculation: yes, recovery rate Child growth standards used for anthropometrical data: not applicable, as height not measured and MUAC and percentage weight gain used to define recovery Quality of anthropometrical measurements: outcome assessors trained; weight and MUAC measurements adequately described Tested for peanut allergies: not reported |
|
| Participants |
Definition used for SAM: MUAC < 11.0 cm or pitting oedema of grade 1 or 2 and no medical complications and with appetite Eligible age range: 6‐95 months All randomised children meet review eligibility criteria: yes Total number randomised: 1927 children Inclusion criteria
Exclusion criteria
HIV and TB status and treatment: all children were offered a HIV test but it was not mandatory. 361/1103 were not tested and 251/824 had status unknown. HIV status and those on ARVs was similar across study groups: 162/1103 = HIV‐infected (of which 50 on ARVs, 69 not on ARVs and 43 unknown) in the experimental group and 114/824 = HIV‐infected (of which 43 on ARVs, 41 not on ARVs and 33 unknown) in the control group. Children on anti‐TB treatment were also similar across groups: 51/1103 in the experimental group (856 not on anti‐TB treatment and 196 unknown) and 20/824 in the control group (658 not on anti‐TB treatment and 146 unknown). Baseline characteristics of experimental group: 576/1103 = male; median age = 17 (interquartile range 12‐22) months; fully immunised = 588/1103; diarrhoea = 327/1103; dehydration = 51/1103; MUAC median = 11.0 (interquartile range 10.5‐12.5) cm; weight median = 7.0 (interquartile range 6.0‐8.5) kg; no oedema = 424/1103 Baseline characteristics of control group: 397/824 = male; median age = 17 (interquartile range 12‐22) months; fully immunised = 482/824; diarrhoea = 285/824; dehydration = 63/824; MUAC median = 11.5 (interquartile range 10.5‐12.7) cm; weight median = 7.1 (interquartile range 6.0‐8.3) kg; no oedema = 248/824 Stabilised in hospital before start of study: no Rehabilitation started in hospital: no |
|
| Interventions |
Number of arms: 2 Maximum intervention duration: study authors reported no maximum intervention duration. Children were discharged according different exit criteria (recovery, death, default, transfer out of catchment area and non‐recovery). Sample size experimental group: 1103 children (design effect = 504) Sample size control group: 824 children (design effect = 377) Experimental intervention: "P‐RUTF" (quote) manufactured in a factory in Malawi by Valid Nutrition. Contained 25% dried skim milk, 27% sugar, 26% peanut paste, 20% soybean oil as well as micronutrients. Provided 2218 kJ/100 g, protein = 12% of total energy, fat = 56% of total energy. Packaged in 92 g branded, laminated foil sachets. Provided around 837 kJ/kg/day Control intervention: "SMS‐RUTF" (quote) manufactured in a factory in Kenya. Contained 30% soybean, 18% maize, 6.5% sorghum, 15% sugar, 22% palm oil, as well as micronutrients. Provided 2180 kJ/100 g, protein = 8.5% of total energy, fat = 57% of total energy. Packaged in 250 g clear plastic screw top pots. Provided around 837 kJ/kg/day Concomitant treatment: all children got a 5‐day course of amoxicillin, a single 100 mg dose of deworming medication, and health and nutrition advice. Risk that intervention was shared with siblings: yes. It is likely that in families who were food insecure, RUTF was shared among siblings. There was the same risk in both groups. |
|
| Outcomes |
How often were children assessed during home‐based rehabilitation? Once a week Followed up after intervention period? No Outcomes during or at the end of the intervention period Primary outcomes
Secondary outcomes
|
|
| Notes |
Trial registry number: ISRCTN62376241 Type of study report: published journal article Contacted study authors: yes. We obtained confirmation that there was no maximum intervention period and that the RUTFs were produced in food factories. Ethics approval: University of Zambia Biomedical Research Ethics Committee Informed consent: caregivers gave written informed consent. Financial contributors: Irish Aid Conflict of interest declared: study author "VOO is an employee of Valid Nutrition. SC is the unpaid director of Valid Nutrition. Valid International is the sister company of Valid Nutrition" (quote) |
|
| Risk of bias | ||
| Bias | Authors' judgement | Support for judgement |
| Random sequence generation (selection bias) | Low risk | Comment: stratified cluster randomisation was done by "…the epidemiologist…with no prior knowledge of the Lusaka programme, randomly allocated intervention arms to HCs in block of four using randomisation software" (quote). |
| Allocation concealment (selection bias) | Unclear risk | Comment: not reported clearly; it is unclear if central allocation was done by the epidemiologist. |
| Blinding of participants and personnel (performance bias) All outcomes | Low risk |
Quote: "The study could not be blind because of the differences in packaging and taste between the SMS‐RUTF and the P‐RUTF…". Comment: the cluster‐randomised design was used to limit the potential bias related to no blinding. Children across groups received the same contact time with study personnel, although it could have differed from healthcare centre to healthcare centre. It is unlikely that no blinding of caregivers and study personnel could have led to high risk of performance bias in children for outcomes such as recovery, relapse, death, anthropometrical measurements. It is likely that no blinding could have influenced the acceptability outcome. |
| Blinding of outcome assessment (detection bias) All outcomes | Unclear risk | Comment: outcome assessors were not blinded. The majority of outcomes were dependent on anthropometrical measurements. It is unclear how lack of blinding affected outcome measurements. |
| Incomplete outcome data (attrition bias) All outcomes | Unclear risk | Comment: 43/824 (5.2%) from the control group (SMS‐RUTF) switched to the experimental group (P‐RUTF), while all of those randomised to P‐RUTF (1103/1103) stayed with their allocated food. In total, 282/1103 (25.6%) from the experimental group versus 261/824 (31.7%) children from the control group were lost to follow‐up. Although this is large, as well as differential attrition, "Children who initially accepted the SMS‐RUTF but who at a later point in their treatment subsequently refused to eat the SMS‐RUTF were transferred to the P‐RUTF. These children were kept in the SMS‐RUTF group for the intention‐to‐treat analyses (ITT) but were excluded from the sample for the per protocol (PP) analyses" (quote). It is not reported how missing data for the ITT analyses was handled. |
| Selective reporting (reporting bias) | Unclear risk | Comment: trial registration number: ISRCTN62376241, but it was retrospectively registered. Expected outcomes were prespecified and addressed. However, study authors reported that, at each visit, caregivers were asked about acceptability of the RUTF; however, these results were not reported. |
| Other bias | Unclear risk | Comment: reported baseline characteristics, except for median MUAC which was significantly higher in the SMS‐RUTF (control) group, appeared balanced across groups. Study authors reported that "a greater proportion children in the SMS‐RUTF group had oedema, diarrhoea, dehydration or were undergoing TB treatment on admission but these differences were not statistically significant" (quote). Block randomisation with blocks of 4 was done, and in combination with no blinding, this could have posed a risk to selection bias according to section 8.15.1.3 in the Cochrane Handbook of Systematic Reviews of Interventions (Higgins 2017). |
Jadhav 2016.
| Methods |
Comparison addressed in this review: 1 Study design: individually randomised controlled trial Study period: March 2011‐June 2013 Country and setting: India, at the Nutrition Rehabilitation, Research and Training Centre (NRRTC), situated at the Urban Health Centre, Dharavi, which is associated with Lokmanya Tilak Municipal Medical College and General Hospital, a tertiary care hospital situated in Mumbai Sample size calculation: no, not reported Child growth standards used for anthropometrical data: WHO Child Growth Standards 2006 Quality of anthropometrical measurements: not reported Tested for peanut allergies: not reported |
|
| Participants |
Definition used for SAM: WHZ ≤ −3 or presence of bipedal oedema, or MUAC ≤ 115 mm Eligible age range: 6 months‐5 years All randomised children meet review eligibility criteria: yes Total number randomised: 321 children Inclusion criteria
Exclusion criteria
HIV and TB status and treatment: not reported Baseline characteristics of experimental group: 69/129 = male; 33, 74 and 22 children were aged between 6‐12 months, 1‐3 years and 3‐5 years respectively; mean weight = 6.7 (SD = 1.8) kg; mean height = 73.5 (SD = 10.2) cm; mean MUAC = 11.2 (SD = 1.2) cm; breastfeeding = not reported Baseline characteristics of control group: 54/113 = male; 45, 54 and 14 children were aged between 6‐12 months, 1‐3 years and 3‐5 years respectively; mean weight 6.8 (SD 2.0) kg; mean height = 75.4 (SD = 13.4) cm; mean MUAC = 11.6 (SD = 1.7) cm; breastfeeding = not reported Stabilised in hospital before start of study: yes, for all children. Experimental group (n = 174): 45, 126 and 3 children were hospitalised for 1‐10 days, 11‐14 days and > 15 days respectively. Control group (n = 147): 34, 105 and 8 children were hospitalised for 1‐10 days, 11‐14 days and > 15 days respectively Rehabilitation started in hospital: yes, all children were hospitalised pre‐trial |
|
| Interventions |
Number of arms: 2 Maximum intervention duration: 8 weeks Sample size experimental group: 174 children randomised Sample size control group: 147 children randomised Experimental intervention: "MNT" (quote). RUTF produced in local institution kitchen. Contained 25% peanut paste, 24% skimmed milk powder, 28% sugar, 20.8% soy bean oil, with added micronutrients. Provided 2343 kJ, 14.6% protein, 34.5% fat, and 49.0% carbohydrate of 100 g product; kJ/kg/day not reported Control intervention: "SNT" (quote). High protein and high energy diet comprising milk, sugar and oil, boiled eggs, banana, rice‐green gram porridge with vegetables, jaggery (non‐refined sugar), and oil. 3% of product was protein (other macronutrient composition not reported). Provided 732 kJ/kg/day Other treatment: initially all children received a "F75 equivalent diet" (quote) containing undiluted cow’s milk, puffed rice powder, sugar, oil and micronutrient premix during the stabilisation phase for 2 days; then were given "F100 equivalent diet" (quote) containing undiluted cow’s milk, sugar, oil and micronutrient premix until children passed the appetite test. Caregivers of all children were counselled on good feeding practices, and all children received antibiotics, vitamin A, and deworming. Risk that intervention was shared with siblings: yes. It is likely that in families who were food insecure, RUTF was shared among siblings. There was the same risk in both groups. |
|
| Outcomes |
How often were children assessed during home‐based rehabilitation? Once a week Followed up after intervention period? Yes, monthly visits after the intervention until 6 months Outcomes during or at the end of the intervention period Primary outcomes
Secondary outcomes
Outcomes at follow‐up after the intervention period Primary outcomes
Secondary outcomes
|
|
| Notes |
Trial registry number: CTRI/2014/04/004523 Type of study report: published journal article Contacted study author: yes. We obtained data for length of hospital stay per group, clarity on the control intervention and duration of the intervention. We also requested SDs for the outcome weight gain, but this was not obtained. Ethics approval: the "Staff Research Society Ethics committee of the LTM Medical College and LTM General Hospital" (quote) approved the trial. Informed consent: informed written consent provided by the caretakers Financial contributors: Toddler Food Partners based at Minneapolis, USA Conflict of interest declared: study authors declared they have none. |
|
| Risk of bias | ||
| Bias | Authors' judgement | Support for judgement |
| Random sequence generation (selection bias) | Low risk | Quote: "...computer generated sequence...", but method of randomisation not reported |
| Allocation concealment (selection bias) | Unclear risk | Comment: not reported |
| Blinding of participants and personnel (performance bias) All outcomes | Low risk | Comment: blinding not done. However, it is unlikely that the lack of blinding of caregivers and study personnel could have led to high risk of performance bias in children for outcomes such as recovery, weight gain and time to recovery. Children across groups received the same contact time with study personnel. |
| Blinding of outcome assessment (detection bias) All outcomes | Unclear risk | Comment: outcome assessors were not blinded. The majority of outcomes were dependent on anthropometrical measurements. It is unclear how lack of blinding affected outcome measurements. |
| Incomplete outcome data (attrition bias) All outcomes | High risk | Comment: loss to follow‐up was not differential across groups (98/174 (56.3%) in experimental group and 85/147 (57.8%) in control group), but the total attrition was large: 321 children were randomised, but only 138 (43%) analysed at the end of the intervention period. |
| Selective reporting (reporting bias) | Unclear risk | Comment: trial registration number: CTRI/2014/04/004523. More outcomes were reported in the trial registry entry than were reported in the article's Results section (e.g. number of infection episodes, mortality), and time to recovery was reported in the Results section of the article but was not prespecified in the trial registry entry. |
| Other bias | High risk | Comment: baseline characteristics were reported per group and appear balanced. However, baseline characteristics were only provided for 129/174 and 113/147 for the experimental and control groups respectively. |
Jones 2015.
| Methods |
Comparison addressed in this review: 3 Study design: individually randomised controlled trial Study period: June 2012‐July 2013 Country and setting: coastal Kenya, at Kilifi County Hospital, which has an outpatient therapeutic feeding programme Sample size calculation: yes, erythrocyte n‐3 polyunsaturated fatty acid Child growth standards used for anthropometrical data: WHO Child Growth Standards 2006 Quality of anthropometrical measurements: not reported Tested for peanut allergies: unclear if tests were done in all children, but those with known allergy or hypersensitivity to any RUTF ingredients were excluded |
|
| Participants |
Definition used for SAM: MUAC < 11.5 cm, WHZ < −3 or bilateral pedal oedema Eligible age range: 6‐60 months All randomised children meet review eligibility criteria: yes Total number randomised: 61 children Inclusion criteria
Exclusion criteria
HIV and TB status and treatment: not reported whether all potentially eligible children were tested for HIV and TB Baseline characteristics of experimental group: 12/20 = male; median age = 18 (range = 9‐30) months; bilateral pedal oedema = 1/20; HAZ median = −3.11 (range = −3.90 to ‐1.93); WHZ median = −3.11 (range = −4.43 to −1.89); MUAC median = 11.2 (range = 10.9‐11.4) cm; breastfeeding = 8/20; complementary feeds introduced at median age = 5 (range = 2‐6) months; diarrhoea = 11/20; pneumonia = 3/20; shock = 1/20; congenital heart disease = 3/20; cerebral palsy = 3/20 Baseline characteristics of control group: 10/20 = male; median age = 16 (range = 11‐25) months; bilateral pedal oedema = 1/20; HAZ median = −3.36 (range = −4.58 to −2.55); WHZ median = −3.31 (range = −3.88 to −2.90); MUAC median = 11.3 (range = 10.8‐11.9) cm; breastfeeding = 8/20; complementary feeds introduced at median age = 4 (range = 2‐6) months; diarrhoea = 8/20; pneumonia = 3/20; shock = 2/20; congenital heart disease = 1/20; cerebral palsy = 1/20 Stabilised in hospital before start of study: some children (number not reported) were stabilised in hospital before enrolment into the study. Rehabilitation started in hospital: participants who required ongoing inpatient care started rehabilitation in hospital but then continued rehabilitation at home. |
|
| Interventions |
Number of arms: 3 Maximum intervention duration: 12 weeks Sample size experimental group: 21 children Sample size control group: 20 children Experimental intervention: "S‐RUTF" (quote) manufactured by Valid Nutrition (Malawi). Contained 25% skimmed milk powder, 23% peanut paste, 29% sugar, 20% vegetable oil and fat, with added micronutrients. Packaged in identical 92 g sachets. Provided in dose determined by the child's body weight according to national Kenyan guidelines; if the child was still hungry, additional RUTF was offered. Was the only foodstuff given, apart from breastfeeding, which was also allowed. After recovery (if it was before 12 weeks), RUTF was provided as supplement to 50% of the usual diet. Control intervention: "F‐RUTF" (quote) manufactured by Valid Nutrition (Malawi). Contained 25% skimmed milk powder, 23% peanut paste, 29% sugar, 20% vegetable oil and fat with the addition of cold‐pressed flax seed oil from Seed Oil SA (Somerset West, South Africa). Packaged in identical 92 g sachets. Provided in dose determined by the child's body weight according to national Kenyan guidelines; if the child was still hungry, additional RUTF was offered; was the only foodstuff given, apart from breastfeeding, which was also allowed. After recovery (if it was before 12 weeks), RUTF was provided as supplement to 50% of the usual diet. Concomitant treatment: not reported Risk that intervention was shared with siblings: yes. It is likely that in families who were food insecure, RUTF was shared among siblings. There was the same risk in both groups. |
|
| Outcomes |
How often were children assessed during home‐based rehabilitation? Once a week for the first month, then once a month for the other 2 months Followed up after intervention period? No Outcomes during or at the end of the intervention period Primary outcomes
Secondary outcomes
|
|
| Notes |
Trial registry number: NCT01593969 Type of study report: published journal article Contacted study authors: yes. We obtained the definition and results for recovery; information on the RUTF ingredients; results for change in MUAC, WHZ and HAZ; and clarity on the study RUTF that was stopped due to product peroxidation. Ethics approval: Kenya Medical Research Institute (KEMRI) ethical review committee and the Oxford Tropical Research ethics committee Informed consent: individual written informed consent from a caregiver. Financial contributors: the Bill & Melinda Gates Foundation through the Grand Challenges Explorations initiative (OPP1046183) and by The Wellcome Trust via Fellowships to KDJJ (092088) and JAB (083579) Conflict of interest declared: yes. Study author "SC is the non‐executive chairman of Valid Nutrition, a charity that is a commercial manufacturer of ready‐to‐use foods and manufactured the investigational RUTF products in this study. The other study authors declare no competing interests." (quote) Other: in May 2013, provision of all study RUTF was stopped due to peroxidation of the control group's F‐RUTF. The children who were still on RUTF at that time were switched to standard RUTF supplied by Kenya's Ministry of Health, but all these participants were followed up for the full study duration and included in the ITT analyses. |
|
| Risk of bias | ||
| Bias | Authors' judgement | Support for judgement |
| Random sequence generation (selection bias) | Low risk | Quote: "A randomization list was generated in STATA… with variable block sizes…" |
| Allocation concealment (selection bias) | Low risk | Quote: "The trial statistician prepared 60 opaque envelopes labeled with study numbers, inside each of which was a card identifying a four‐digit RUTF code…"; "When a participant was enrolled in the trial they were allocated the next consecutively available study number, which was entered on the allocation log prior to opening the relevant envelope."; and "Access to the allocation key was restricted to manufacturers and the trial statistician." |
| Blinding of participants and personnel (performance bias) All outcomes | Low risk |
Quote: "The trial was conducted double‐blind between the S‐RUTF and F‐RUTF arms…"; "Both… RUTFs were packaged in identical 92 g sachets…"; "The two recipes were organoleptically indistinguishable." Comment: children across groups received the same contact time with study personnel. |
| Blinding of outcome assessment (detection bias) All outcomes | Low risk |
Quote: "The trial was conducted double‐blind between the S‐RUTF and F‐RUTF arms…"; "Both… RUTFs were packaged in identical 92 g sachets…"; "The two recipes were organoleptically indistinguishable." Comment: it is likely that the outcome assessors were blinded. |
| Incomplete outcome data (attrition bias) All outcomes | Unclear risk | Comment: while only 1/20 children from the experimental group compared to 0/20 from the control group was excluded from the study after randomisation, and in both groups 2/20 discontinued due to high peroxide levels in the RUTFs, 1/20 (5%) from the experimental group compared to 5/20 (25%) participants from the control group voluntarily withdrew. No reason other than "withdrawn at parental request" (quote) was provided. In each group, 20 participants were analysed based on "intention‐to‐treat analysis" (quote) according to study authors. However, it is not reported how missing data for the children who withdrew from participation, or for those who discontinued early, was handled. |
| Selective reporting (reporting bias) | Unclear risk | Comment: trial registration number: NCT01593969. More outcomes were reported in the Results section of the article than were prespecified in the trial registry entry (e.g. safety, acceptability) and Methods section of the article (e.g. HAZ). Furthermore, in the Methods section of the article, it is reported that data for rate of recovery were collected and reported; however, such numerical data were not reported in the article. |
| Other bias | Low risk | Comment: nutritional baseline characteristics were reported per group and appear fairly similar. The study authors reported that the groups were "comparable at baseline" (quote). |
Kerac 2009.
| Methods |
Comparison addressed in this review: 3 Study design: individually randomised controlled trial Study period: July 2006‐March 2007. Country and setting: Malawi, MOYO nutrition rehabilitation unit, Queen Elizabeth Central Hospital Sample size calculation: yes, recovery Child growth standards used for anthropometrical data: NCHS reference Quality of anthropometrical measurements: followed anthropometrical protocols in line with research standards, and measurements for weight, length and MUAC adequately described Tested for peanut allergies: not reported |
|
| Participants |
Definition used for SAM: WHZ < 70% of the median, nutritional oedema (kwashiorkor), or MUAC < 11 cm Eligible age range: 5‐168 months All randomised children meet review eligibility criteria: no, but the subgroup 6‐60 months is eligible for our review and some analyses were performed separately. Total number randomised: 795 children, of which 651 (81.9%) children in the eligible subgroup Inclusion criteria: "All children [with SAM] admitted to the nutrition rehabilitation unit were eligible..." Exclusion criteria: children of caregivers who declined consent. From our eligible subgroup, children meeting ≥ 1 of the following were excluded: age > 60 or < 6 months, cerebral palsy or disability, weight of < 4 kg, surgical problem or complicated MAM. HIV and TB status and treatment? Routine HIV counselling and testing took place, and HIV status was known for 755/795 (95%) of all study children. In the experimental group, 153/318 children were HIV‐infected and 154/318 HIV‐uninfected whereas for the control group it was 141/333 and 173/333 respectively. There was a waiting list for ARV and most children did not start such treatment during the study period. The number of study children who ever had TB, who had a diagnostic test as inpatient, and who were diagnosed with TB at any point in time during the study was similar across groups (data for our eligible subgroup were not reported). Baseline characteristics of experimental group: not available for the eligible subgroup Baseline characteristics of control group: not available for the eligible subgroup Stabilised in hospital before start of study? All children were stabilised as inpatients, and the study started when a child progressed to the rehabilitation phase. Rehabilitation started in hospital: all participants started rehabilitation with RUTF as inpatients, but the majority of the intervention period was at home. |
|
| Interventions |
Number of arms: 2 Maximum intervention duration: 10 weeks Sample size experimental group: 396 children (318 in our eligible subgroup) Sample size control group: 399 children (333 in our eligible subgroup) Experimental intervention: "Control" (quote): S‐RUTF produced in a factory in Malawi. Contained 25% peanut butter, 30% full fat milk powder, 28% sugar, 15% vegetable oil, with added micronutrients. Packaging not reported. Provided 837 kJ/kg/day Control intervention: "Synbiotic" (quote). S‐RUTF plus Synbiotic2000 Forte (Medipharm, Sweden). Freeze‐dried synbiotic powder was factory‐mixed into RUTF at a weight ratio of 1:50. Synbiotic constituents were 4 different probiotic lactic acid bacteria (meeting the "prescribed average dose of more than 1x10¹⁰ colony‐forming units") and 4 prebiotic fermentable bioactive fibres. Packaging not reported. Provided 837 kJ/kg/day Concomitant treatment: all children received a 7‐day course of co‐trimoxazole, and HIV‐infected children continued with such prophylaxis long term. According to clinical need, some children also received parenteral second‐line and third‐line antibiotics. Risk that intervention was shared with siblings: yes. It is likely that in families who were food insecure, RUTF was shared among siblings. There was the same risk in both groups. |
|
| Outcomes |
How often were children assessed during home‐based rehabilitation? Once every 2 weeks Followed up after intervention period? No Outcomes during or at the end of the intervention period (for our eligible subgroup separately) Primary outcomes
Secondary outcomes
|
|
| Notes |
Trial registry number: ISRCTN19364765 Type of study report: published journal article and PhD thesis Contacted study authors: yes. We obtained the link to the PhD thesis, clarity on the duration of the inpatient and outpatient rehabilitation, as well as useful contextual information. Ethics approval: College of Medicine Research and Ethics Committee (Malawi) and the Institute of Child Health (UK) Informed consent: written informed consent from caregivers Financial contributors: Department for International Development (DfID) Conflict of interest declared: yes. Study author "SC is an unpaid director of Valid Nutrition, a charity that produces ready‐to‐use therapeutic food in developing countries" (quote). The other study authors declared no conflicts of interest. |
|
| Risk of bias | ||
| Bias | Authors' judgement | Support for judgement |
| Random sequence generation (selection bias) | Low risk | Quote: "A random sequence for the two study groups was computer generated independently of the field team. Permuted blocks of 50 (25 group 1 and 25 group 2 per block) ensured balanced groups for interim safety analysis." |
| Allocation concealment (selection bias) | Low risk | Quote: "An independent volunteer inserted one of two sticky labels (printed group 1 and group 2) into sealed, opaque, sequentially numbered envelopes." |
| Blinding of participants and personnel (performance bias) All outcomes | Low risk | Quote: "...double blind. Taste, colour, and texture of standard (control) and intervention (Synbiotic) food were indistinguishable, so patients were blind to their group allocation... Project field staff were unaware of whether group 1 or 2 contained the Synbiotic." |
| Blinding of outcome assessment (detection bias) All outcomes | Low risk | Quote: "They [field staff] were also blind to allocation when assessing or managing a patient." |
| Incomplete outcome data (attrition bias) All outcomes | Unclear risk | Comment: loss to follow‐up was small and not differential: 33/318 from experimental group compared to 28/333 from control group. However, only a subgroup of randomised participants was eligible to be included in our review, and it is unclear whether randomisation in this smaller group was preserved. |
| Selective reporting (reporting bias) | Low risk | Comment: trial registration number: ISRCTN19364765. The outcomes prespecified in the trial register were also reported in the Methods section of the article, and addressed in the Results section. |
| Other bias | Unclear risk | Comment: baseline characteristics reported per group; however, the characteristics of the subgroup of children relevant to our review were not reported. |
Manary 2004.
| Methods |
Comparison addressed in this review: 1 and 2 Study design: quasi‐randomised controlled trial; systematically allocated clusters that were the day of the child's discharge in the month. Study period: January‐October 2001 Country and setting: Malawi; outpatients from the Queen Elizabeth Central Hospital in Blantyre Sample size calculation? Yes, recovery Child growth standards used for anthropometrical data? NCHS reference population. Quality of anthropometrical measurements: not reported Tested for peanut allergy: Yes, no child found to be allergic |
|
| Participants |
Definition used for SAM: not reported Eligible age range: > 12 months All randomised children meet review eligibility criteria: yes Total number randomised: 282 children (effective sample size = 275) Inclusion criteria
Exclusion criteria: HIV‐infection, as determined by ELISA where positive tests were confirmed with "a second test" (quote) HIV and TB status and treatment: only children known to be HIV‐uninfected were included; nothing about TB comorbidity reported Baseline characteristics of experimental group, "RUTF" (quote): 42/69 = male; mean age = 29 (SD = 18) months; oedema during hospitalisation = 56/69; mean length of hospital stay = 13 (SD 9) days; mean WAZ = −3.4 (SD = 1.3); mean HAZ = −3.5 (SD = 2.0); mean WHZ = −1.8 (SD = 0.8); mean MUAC = 12.0 (SD = 1.7) cm; mean age weaned = 19 (SD = 7 months Baseline characteristics of control group, "RUTF supplement" (quote): 56/96 = male; mean age = 28 (SD = 14) months; oedema during hospitalisation = 77/96; mean length of hospital stay = 14 (SD = 8) days; mean WAZ = −3.6 (SD = 1.1); mean HAZ = −3.7 (SD = 1.6); mean WHZ = − 2.0 (SD = 0.9); mean MUAC = 11.9 (SD = 1.5) cm; mean age weaned = 20 (SD = 7) months Baseline characteristics of control group, "Maize/soy flour" (quote): 69/117 = males; mean age = 29 (SD = 13) months; oedema during hospitalisation = 98/117; mean length of hospital stay = 11 (SD = 5) days; mean WAZ = −3.4 (SD = 1.0); mean HAZ = −3.6 (SD = 1.3); mean WHZ = −1.9 (SD = 1.0); mean MUAC = 11.9 (SD = 1.8) cm; mean age weaned 19 = (SD = 7) months Stabilised in hospital before start of study? yes, all children were hospitalised pre‐trial Rehabilitation started in hospital: no |
|
| Interventions |
Number of arms: 3 Number of arms used in this review: all 3 Maximum intervention duration: 16 weeks Sample size experimental group, "RUTF" (quote): 69 randomised (effective sample size = 68) Sample size control group, "RUTF supplement" (quote): 96 randomised (effective sample size = 94) Sample size control group, "Maize/soy flour" (quote): 117 randomised (effective sample size = 114) Experimental intervention: "RUTF" (quote). S‐RUTF given in enough quantities to meet total daily nutritional requirements; produced in a factory (Nutriset, Malaunay, France). Contained peanut butter, milk powder, oil, sugar and micronutrients. Product's energy density = 23 kJ/g. Packaging not reported. Provided 733 kJ/kg/day. Received, on average, 276 g/day Control intervention 1: "RUTF supplement" (quote). S‐RUTF given as supplement; produced in a factory (Nutriset, Malaunay, France). Contained peanut butter, milk powder, oil, sugar and micronutrients. Product's energy density = 26 kJ/g. Packaging not reported. Providing 2090 kJ/day. Received 92 g/day Control intervention 2: "Maize/soy flour" (quote). Unfortified blended flour of 80% maize and 20% soy, plus a micronutrient supplement. Assumed to be locally produced. Prepared by caregiver as "nzima" (quote). Provided 4 kJ/g. Received 2400 g/day dry product (enough for whole family) Concomitant treatment: not reported for rehabilitation phase Risk that intervention was shared with siblings: yes. There was risk of sharing in the 2 RUTF groups but not in the maize and soy flour blend control group, as enough flour were given for sharing within the family. |
|
| Outcomes |
How often were children assessed during home‐based rehabilitation? Once every 2 weeks Followed up after intervention period? Yes, at 6 months after the intervention ended Outcomes during or at the end of the intervention period Primary outcomes
Secondary outcomes
Outcomes at follow‐up after the intervention period (only for children who recovered during intervention period) Primary outcomes
Secondary outcomes
|
|
| Notes |
Trial registry number: not reported Type of study report: published journal article Contacted study authors: yes. We obtained the definition of time to recovery, results separately for participants who died or relapsed, the definition of time to recovery, and results for recovery at follow‐up Ethics approval: College of Medicine Research Committee of the University of Malawi; Human Studies Committee of Washington University in St Louis Informed consent: obtained; not reported whether it was provided orally or in writing Financial contributors: Allen Foundation; Craig and Benith MacPherson; RUTF donated by Nutriset (Malaunay, France) Conflict of interest declared: not reported |
|
| Risk of bias | ||
| Bias | Authors' judgement | Support for judgement |
| Random sequence generation (selection bias) | High risk | Quote: "...systematic allocation determined by the day of the child's discharge in the month". |
| Allocation concealment (selection bias) | High risk | Comment: quasi‐randomised study; therefore, prediction of next allocation possible |
| Blinding of participants and personnel (performance bias) All outcomes | Low risk | Comment: blinding not done because the experimental and control interventions looked very different. However, it is unlikely that the lack of blinding of caregivers and study personnel could have led to high risk of performance bias in children for outcomes such as recovery, relapse, mortality, weight gain and time to recovery. Children across groups received the same contact time with study personnel. |
| Blinding of outcome assessment (detection bias) All outcomes | Unclear risk | Comment: outcome assessors were not blinded. The majority of outcomes were dependent on anthropometrical measurements. It is unclear how lack of blinding affected outcome measurements. |
| Incomplete outcome data (attrition bias) All outcomes | High risk | Comment: differential loss to follow‐up: 7/69 (10.1%), 25/96 (26.0%) and 15/117 (12.8%) children dropped out of the RUTF, RUTF supplement, and maize and soy flour blend groups respectively. |
| Selective reporting (reporting bias) | Unclear risk | Comment: protocol and trial registration entry not available, but expected outcomes were stated in the Methods section and addressed in the Results section. |
| Other bias | Low risk | Comment: apart from length of hospital stay, where the control group with 11 days differed slightly from the RUTF (13 days) and RUTF supplement groups (14 days), baseline characteristics appear balanced across groups and the study authors reported that there were no differences in baseline characteristics. |
Ndekha 2005.
| Methods |
Comparison addressed in this review: 1 and 2 Study design: quasi‐randomised controlled trial; systematically allocated clusters that were the week of the child's discharge in the month Study period: January‐September 2001 Country and setting: Malawi; outpatients from the Queen Elizabeth Central Hospital in Blantyre Sample size calculation: not reported Reference standard for anthropometrical data: NCHS reference population Quality of anthropometrical measurements: not reported Tested for peanut allergy: probably, because in Manary 2004 it is reported that "no evidence of peanut allergy was found in this whole population" (quote) |
|
| Participants |
Definition used for SAM: not reported Eligible age range: 12‐60 months All randomised children meet review eligibility criteria: yes Total number randomised: 93 children (effective sample size = 93) Inclusion criteria
Exclusion criteria: not reported HIV and TB treatment: no participant received ARV as it was not available in the country at the time. Nothing about TB comorbidity reported Baseline characteristics of experimental group, "RUTF" (quote): 11/20 = male; mean age = 25 (SD = 10) months; oedema during hospitalisation = 13/20; mean length of hospital stay = 13 (SD = 12) days; mean WAZ = −3.6 (SD = 0.9); mean HAZ = −3.6 (SD = 1.0); mean WHZ = −2.0 (SD = 1.1); mean MUAC = 11.2 (SD = 1.7) cm Baseline characteristics of control group, "RUTF supplement" (quote): 14/28 = male; mean age = 27 (SD = 16) months; oedema during hospitalisation = 11/28; mean length of hospital stay = 11 (SD = 6) days; mean WAZ = −4.0 (SD = 1.0); mean HAZ = −3.4 (SD = 1.5); mean WHZ = −2.8 (SD = 0.9); mean MUAC = 10.6 (SD = 1.4) cm Baseline characteristics of control group, "Maize/soy flour" (quote): 23/45 = male; mean age = 24 (SD = 9) months; oedema during hospitalisation = 19/45; mean length of hospital stay = 14 (SD = 7) days; mean WAZ = −3.7 (SD = 0.9); mean HAZ = −4.0 (SD = 1.3); mean WHZ = −1.8 (SD = 0.8); mean MUAC = 11.3 (SD = 1.5) cm Stabilised in hospital before start of study: yes, all children were hospitalised pre‐trial Rehabilitation started in hospital: no |
|
| Interventions |
Number of arms: 3 Number of arms used in this review: all 3 Maximum intervention duration: "some weeks" (quote) Sample size experimental group, "RUTF" (quote): 20 randomised (effective sample size = 20) Sample size control group, "RUTF supplement" (quote): 28 randomised (effective sample size = 28) Sample size control group, "Maize/soy" (quote): 45 randomised (effective sample size = 45) Experimental intervention: "RUTF" (quote). S‐RUTF given in enough quantities to meet total daily nutritional requirements; produced in a factory (Nutriset, Malaunay, France). Contained peanut butter, milk powder, oil, sugar and micronutrients; product's energy density = 23 kJ/g. Packaging not reported. Provided 733 kJ/kg/day. Received, on average, 276 g/day Control intervention: "RUTF supplement" (quote). S‐RUTF given as supplement; produced in a factory (Nutriset, Malaunay, France). Contained peanut butter, milk powder, oil, sugar and micronutrients; product's energy density = 26 kJ/g. Packaging not reported. Providing 2090 kJ/day. Received 92 g/day Control intervention: "Maize/soy flour" (quote). Unfortified blended flour of 80% maize and 20% soy, plus a micronutrient supplement. Assumed to be locally produced. Prepared by caregiver as "nzima". Provided 4 kJ/g. Received 2400 g/day dry product (enough for whole family) Concomitant treatment: not reported for rehabilitation phase Risk that intervention was shared with siblings: yes. There was risk of sharing in the two RUTF groups but not in the maize and soy flour blend control group, as enough flour were given for sharing within the family. |
|
| Outcomes |
How often were children assessed during home‐based rehabilitation? Once every 2 weeks Followed up after intervention period? Yes, at 6 months after the intervention ended Outcomes during or at the end of the intervention period Primary outcomes
Secondary outcomes
Outcomes at follow‐up after the intervention period (only for children who recovered during intervention period) Primary outcomes
Secondary outcomes
|
|
| Notes |
Trial registry number: not reported Type of study report: published journal article Contacted study authors: yes. We obtained the number of clusters that were randomised, and clarity on how diarrhoea was measured. Ethics approval: College of Medicine Research Committee of the University of Malawi; Human Studies Committee of Washington University in St Louis Informed consent: obtained; not reported whether provided orally or in writing Financial contributors: Allen Foundation; Craig and Benith MacPherson; RUTF donated by Nutriset (Malaunay, France) Conflict of interest declared: not reported |
|
| Risk of bias | ||
| Bias | Authors' judgement | Support for judgement |
| Random sequence generation (selection bias) | High risk | Quote: "...systematically allocated...based on their week of discharge from the hospital" |
| Allocation concealment (selection bias) | High risk | Comment: quasi‐randomised study; therefore, prediction of next allocation possible |
| Blinding of participants and personnel (performance bias) All outcomes | Low risk | Comment: blinding not done because the experimental and control interventions looked very different. However, it is unlikely that the lack of blinding of caregivers and study personnel could have led to high risk of performance bias in children for outcomes such as recovery, relapse, mortality, weight gain and time to recovery. Children across groups received the same contact time with study personnel. |
| Blinding of outcome assessment (detection bias) All outcomes | Unclear risk | Comment: outcome assessors were not blinded. The majority of outcomes were dependent on anthropometrical measurements. It is unclear how lack of blinding affected outcome measurements. |
| Incomplete outcome data (attrition bias) All outcomes | High risk | Comment: differential loss to follow‐up: 2/20 (10%), 8/28 (28.6%) and 7/45 (15.6%) children dropped out of the RUTF, RUTF supplement, and maize and soy flour blend groups respectively. |
| Selective reporting (reporting bias) | Unclear risk | Comment: protocol not available. Expected outcomes were prespecified in the Methods section and addressed in the Results section. However, although results for "time to recovery" (quote) were reported, they were not prespecified in the Methods section as an outcome. |
| Other bias | Low risk | Comment: during hospitalisation, 65% (13/30), 39% (11/28), and 42% (19/45) of children from the RUTF, RUTF supplement, and maize and soy flour blend groups respectively, had oedema. This is likely because of chance as other baseline characteristics appear similar across groups. |
Oakley 2010.
| Methods |
Comparison addressed in this review: 3 Study design: individually randomised controlled trial Study period: July 2008‐April 2009 Country and setting: southern Malawi, 15 rural study sites Sample size calculation: yes, recovery rate Child growth standards used for anthropometrical data: WHO Child Growth Standards 2006 Quality of anthropometrical measurements: performed by trained personnel; scales were calibrated weekly; weight, length/height and MUAC adequately described Tested for peanut allergy: not reported |
|
| Participants |
Definition used for SAM: WHZ < −3 or having bipedal pitting oedema, or both Eligible age range: 6‐59 months All randomised children meet review eligibility criteria: yes Total number randomised: 1874 children Inclusion criteria
Exclusion criteria
HIV and TB status and treatment: not reported whether all potentially eligible children were tested for HIV. Nothing about TB comorbidity was reported Baseline characteristics of experimental group: 432/945 = male; mean age = 19.2 (SD = 9.9) months; oedema = 737/945; mean WAZ = −3.1 (SD = 1.2); mean HAZ = −3.0 (SD = 1.5); mean WHZ = −2.1 (SD = 1.2); mean MUAC = 12.1 (SD = 1.3) cm; prior treatment for malnutrition = 156/937; mother with HIV = 44/945; still being breastfed = 555/938; diarrhoea on admission = 419/945; fever on admission = 524/945; cough on admission = 441/945; vomiting on admission = 221/945 Baseline characteristics of control group: 388/929 = male; mean age = 19.5 (SD = 9.7) months; oedema = 721/929; mean WAZ = −3.1 (SD = 1.2); mean HAZ = −3.0 (SD = 1.5); mean WHZ = −2.0 (SD = 1.2); mean MUAC = 12.2 (SD = 1.3) cm; prior treatment for malnutrition = 145/922; mother with HIV = 34/929; still being breastfed = 539/925; diarrhoea on admission = 387/929; fever on admission = 549/929; cough on admission = 462/929; vomiting on admission= 209/929 Stabilised in hospital before start of study: no Rehabilitation started in hospital: no |
|
| Interventions |
Number of arms: 2 Maximum intervention duration: 8 weeks Sample size experimental group: 945 children randomised Sample size control group: 929 children randomised Experimental intervention: "25% milk RUTF" (quote). Standard RUTF locally produced in a factory. Contained 25% skimmed milk powder, 26% peanut paste, as well as added micronutrients. Provided 2000 kJ/100 g, protein = 15% of product, fat = 40% of product. Packaged in 245 g plastic jars. Provided 733 kJ/kg/day Control intervention: "10% milk RUTF" (quote). RUTF locally produced in a factory. Contained 10% skimmed milk powder, 15% unprocessed soy flour, 26% peanut paste, as well as added micronutrients. Provided 2000 kJ/100 g, protein = 15% of product, fat = 40% of product. Packaged in 245 g plastic jars. Provided 733 kJ/kg/day Concomitant treatment: not reported Risk that intervention was shared with siblings: it is likely that in families who were food insecure, RUTF was shared among siblings. There was a risk of sharing in both groups, although the caregivers were asked to treat the RUTF like medical therapy, and that it should not be mixed or diluted in porridge. |
|
| Outcomes |
How often were children assessed during home‐based rehabilitation? Once every 2 weeks Followed up after intervention period? No Outcomes during or at the end of the intervention period Primary outcomes
Secondary outcomes
|
|
| Notes |
Trial registry number: ISRCTN54186063 Type of study report: published journal article Contacted study authors: yes. We obtained information from the study author that no children were stabilised in hospital pre‐trial and confirmed the number of children randomised. Ethics approval: College of Medicine Research and Ethics Committee of the University of Malawi; Human Studies Committee of Washington University School of Medicine, USA Informed consent: caregivers gave oral and written consent. Financial contributors: Hickey Family Foundation; Academy for Educational Development; NIH grant T32 HD049338 Conflict of interest declared: yes. Study authors declared they had none. |
|
| Risk of bias | ||
| Bias | Authors' judgement | Support for judgement |
| Random sequence generation (selection bias) | Low risk | Quote: "Children were randomly assigned with equal probability to either 25% milk RUTF or 10% milk RUTF... Randomization was blocked for the entire study...". |
| Allocation concealment (selection bias) | Low risk | Quote: "To allocate children to a food group, caretakers chose a sealed envelope that contained 1 of 6 letters: 3 of these letter corresponded to the 25% milk formulation and 3 to the 10% milk formulation." |
| Blinding of participants and personnel (performance bias) All outcomes | Low risk |
Quote: "Caretakers, field workers, and investigators assessing the children remained unaware of what type of food each child received for the duration of the study." Comment: it is not reported how blinding was done, but it is unlikely that children's outcomes such as recovery, relapse, mortality, weight gain and time to recovery, could have been influenced by a lack of blinding. Children across groups received the same contact time with study personnel. |
| Blinding of outcome assessment (detection bias) All outcomes | Unclear risk |
Quote: "Caretakers, field workers, and investigators assessing the children remained unaware of what type of food each child received for the duration of the study." Comment: it is not reported how blinding was done ‐ it is not clear from the article whether the 2 RUTF products looked, tasted and were packaged identically. |
| Incomplete outcome data (attrition bias) All outcomes | Low risk | Comment: loss to follow‐up small and not differential: 28/945 (3%) from the standard RUTF group compared to 23/929 (2.5%) from the RUTF group containing less milk powder were lost to follow‐up. |
| Selective reporting (reporting bias) | Unclear risk | Comment: trial registration number: ISRCTN54186063. Number of days of diarrhoea were prespecified in the trial registry entry, and in the article, it was described that data for this outcome were collected. However, these results were not reported. |
| Other bias | Low risk | Comment: baseline characteristics for all randomised children across groups appear balanced. |
Shewade 2013.
| Methods |
Comparison addressed in this review: 1 Study design: individually randomised controlled trial Study period: 2011 Country and setting: Chandigarh, India in 12 urban "anganwadi" (quote) centres Sample size calculation: yes, for recovery Child growth standards used for anthropometrical data: WHO Child Growth Standards 2006 Quality of anthropometrical measurements: outcome assessors were trained; equipment calibration was done weekly; weight and length/height measurements were well described, but nothing about MUAC reported Tested for peanut allergies: not reported |
|
| Participants |
Definition used for SAM: WHZ < −3 or MUAC < 115 mm Eligible age range: 6 months‐5 years All randomised children meet review eligibility criteria: yes Total number randomised: 26 children Inclusion criteria
Exclusion criteria
HIV and TB status and treatment? not reported Baseline characteristics of experimental group: 3/13 = male; mean age = 28 (SD = 16) months; mean HAZ = −3.44 (SD = 1.36); mean WAZ = −4.28 (SD = 0.9); mean WHZ = −3.47 (SD = 0.88) Baseline characteristics of control group: 10/13 = male; mean age = 30 (SD = 14) months; mean HAZ = −2.81 (SD = 1.85); mean WAZ = −3.63 (SD = 0.96); mean WHZ = −3.18 (SD = 0.32) Stabilised in hospital before start of study: no Rehabilitation started in hospital: no |
|
| Interventions |
Number of arms: 2 Maximum intervention duration: 12 weeks Sample size experimental group: 13 children Sample size control group: 13 children Experimental intervention: RUTF locally prepared by trained personnel once a week in the institution kitchen. Made from 30% skimmed milk powder, 26% sugar, 2.5% soy oil, 14.5% palm oil, 27% peanuts, with added micronutrients. Provided 2167 kJ per 100 g, 14% protein and 49% fat of total energy; at 837 kJ/kg/day. RUTF packets given weekly to family. In addition to RUTF, children also received feeding counselling and supplementary nutrition (not described) from the Anganwadi, as per guidelines for management for malnutrition under the Integrated Child Development Scheme (ICDS): 3347 kJ energy and 20‐25 g protein/day. Control intervention: children received feeding counselling and supplementary nutrition (not described) from the Anganwadi, as per guidelines for management for malnutrition under the Integrated Child Development Scheme (ICDS): 3347 kJ energy and 20 to 25 g protein per day. Concomitant treatment: "case management" (quote) was done, but detail not reported Risk that intervention was shared with siblings: it is likely that in families who were food insecure, RUTF was shared among siblings. There was a risk in the experimental group only, although the mothers were asked to "treat RUTF like medicine" (quote) and not to share with siblings. |
|
| Outcomes |
How often were children assessed during home‐based rehabilitation? Once a week Followed up after intervention period? No Outcomes during or at the end of the intervention period Primary outcomes
Secondary outcomes
|
|
| Notes |
Trial registry number: CTRI/2011/12/002259 Type of study report: published journal article Contacted study authors: no Ethics approval: yes, "Institute ethics committee approval was obtained" (quote) Informed consent: informed consent was obtained from caregivers but it is unclear whether it was provided in writing or orally. Financial contributors: Indian Association of Preventive and Social Medicine (IAPSM) Ford Foundation Epidemiological Research grant, 2011‐12 Conflict of interest declared: not reported |
|
| Risk of bias | ||
| Bias | Authors' judgement | Support for judgement |
| Random sequence generation (selection bias) | Low risk | Quote: "An independent statistician prepared random sequence using block randomization (block size 4) by randomly selecting the blocks."; and "…using a computer‐generated randomization sequence" |
| Allocation concealment (selection bias) | Low risk |
Quote: "Allocation concealment was done using numbered, opaque, sealed envelopes." Comment: not reported whether envelopes were consecutively numbered, but it was probably done. |
| Blinding of participants and personnel (performance bias) All outcomes | Low risk |
Quote: "Blinding of study and control group could not be done for obvious reasons." Comment: it is unlikely that the lack of blinding of caregivers and study personnel could have led to a high risk of performance bias in children for outcomes such as recovery and weight gain. Children across groups received similar contact time with study personnel. |
| Blinding of outcome assessment (detection bias) All outcomes | Unclear risk |
Comment: outcome assessors were not blinded. The majority of outcomes were dependent on anthropometrical measurements. It unclear how lack of blinding affected outcome measurements. Quote: "We tried to limit bias by asking the medical social worker to measure the children in a separate room before the start of the weekly OTP." |
| Incomplete outcome data (attrition bias) All outcomes | Low risk | Comment: no children were lost to follow‐up. |
| Selective reporting (reporting bias) | Unclear risk | Comment: trial registration number: CTRI/2011/12/002259. Recovery was the only outcome prespecified in the trial register and in the Methods section of the article. Weight gain was reported in the Results section. WHZ was also measured but results were not reported per group. |
| Other bias | Unclear risk | Comment: few baseline characteristics per group were provided. The WAZ and HAZ scores in the experimental group appear lower than those in the control group, and the experimental group had 23% male participants (3/13) while the control group had 77% (10/13) male participants. Block randomisation with blocks of 4 was done, and in combination with no blinding, this could have posed a risk to selection bias according to section 8.15.1.3 in the Cochrane Handbook of Systematic Reviews of Interventions (Higgins 2017). |
Sigh 2018.
| Methods |
Comparison addressed in this review: 3 Study design: individually randomised, controlled, superiority trial Study period: September 2015‐January 2017 Country and setting: Cambodia, outpatient department of the National Pediatric Hospital (NPH) in Phnom Penh Sample size calculation: yes, using weight gain Child growth standards used for anthropometrical data: WHO Child Growth Standards 2006 Quality of anthropometrical measurements: outcome assessors trained and a well‐described digital data collection method used; weight, length/height and MUAC measurements adequately described Tested for peanut allergies: not applicable |
|
| Participants |
Definition used for SAM: combination of WHZ ≤ −2.8 or MUAC ≤ 115 mm, and presence of nutritional oedema Eligible age range: 6‐59 months All randomised children meet review eligibility criteria: yes Total number randomised: 121 children Inclusion criteria
Exclusion criteria
HIV and TB status and treatment: HIV and TB was not seen as a complication, and children known with a positive HIV or TB status were eligible. Experimental group: HIV‐infection = 1/61; control group: HIV‐infection = 0/60 Baseline characteristics of experimental group: 40/61 = male; mean age = 19.7 (SD = 12.3) months; breastfeeding = 30/61; mean weight = 7.32 (SD = 1.61) g; mean height =74.8 (SD = 9.2) cm; mean MUAC = 118 (SD = 9.0) mm; mean WHZ = −2.9 (SD = 0.7); mean WAZ = −3.3 (SD = 0.9); mean HAZ = −2.3 (SD 1.3); diarrhoea = 19/61; fever = 41/61; lost appetite = 4/61 Baseline characteristics of control group: 31/60 = male; mean age = 22.7 (SD = 15.1) months; breastfeeding = 27/60; mean weight = 7.71 (SD = 2.02) g; mean height = 77.3 (SD = 10.8) cm; mean MUAC = 119 (SD = 7.3) mm; mean WHZ = −3.0 (SD = 0.6); mean WAZ −3.2 (SD = 0.8); mean HAZ −2.1 (SD = 1.4); diarrhoea = 15/60; fever = 36/60; lost appetite = 8/60 Stabilised in hospital before start of study: only 2/121 children (not reported per group) were stabilised in hospital before enrolment into the trial. Rehabilitation started in hospital: no |
|
| Interventions |
Number of arms: 2 Maximum intervention duration: 8 weeks Sample size experimental group: 61 children Sample size control group: 60 children Experimental intervention: "BP100" (quote). RUTF manufactured in a factory in Norway by Compact. Contained a mixture of cereal, milk powder, vegetable oil, carbohydrates, with added vitamins and minerals (Fleet 2017). Provided 2213.34 kJ/100 g, protein = 11.1% of total energy, fat = 51.6% of total energy. Packaged as bars, with 2 biscuits weighing 28.4 g (Fleet 2017). Provided 669 to 753 kJ/kg/day Control intervention: "Num Trey" (quote). Fish‐based RUTF manufactured in a food factory in Cambodia. Contained 5.9% fish (dried, powdered, whole small fish), 33.3% carbohydrate source (mung beans, rice, soybeans, rice flour), 23.5% fats (canola oil, palm vegetable shortening), 24.2% sugars (refined sugar, icing sugar, maltodextrin), 11.3% other ingredients (coconut, vanilla, desiccated coconut, duck egg), as well as minerals and vitamins. Consisted of paste surrounded by a crispy wafer. Packaged in 140 g sachets of 2 x 7 wafers. Provided 2117 kJ/kg/100 g, protein = 9.7% of total energy, fat = 49.6% of total energy, with added vitamins and minerals. Provided 669 to 753 kJ/kg/day Concomitant treatment: all children were dewormed and provided with general health and nutrition advice. Risk that intervention was shared with siblings: yes. It is likely that in families who were food insecure, RUTF was shared among siblings (even though in the study the caregivers were told that the RUTF was a "medicine" (quote) and only for the specific patients). There was the same risk in both groups. |
|
| Outcomes |
How often were children assessed during home‐based rehabilitation? Once every 2 weeks Followed up after intervention period? No Outcomes during or at the end of the intervention period Primary outcomes
Secondary outcomes
|
|
| Notes |
Trial registry number: NCT02907424 Type of study report: published journal articles Contacted study authors: yes. The study author sent us information on Num Trey, and data in mm/day for height and MUAC gain. Ethics approval: National Ethical Committee for Health Research of the Ministry of Health, Kingdom of Cambodia (April 2015 Version N˚2) Informed consent: written and oral informed consent from parents or legal guardians Financial contributors: UNICEF’s national committees (Australia, Republic of Korea, and Hong Kong), Institut de Recherche pour le Développement, University of Copenhagen, and Neys‐van Hoogstraten (Grant ID; CA271) Conflict of interest declared: the study authors declared no conflicts of interest. Other: all participants were compensated for their time with a small gift after completion of the trial. |
|
| Risk of bias | ||
| Bias | Authors' judgement | Support for judgement |
| Random sequence generation (selection bias) | Low risk | Quote: "A computer‐generated randomization list in blocks of four patients based on the product codes and patient ID number was made prior to the start of the trial..." |
| Allocation concealment (selection bias) | Low risk | Quote: "The list was provided in a closed envelope to the project manager, who enrolled participants and assigned the intervention to the participants based on the list." |
| Blinding of participants and personnel (performance bias) All outcomes | Low risk | Comment: blinding was not done because the experimental and control interventions looked very different. However, it is unlikely that the lack of blinding of caregivers and study personnel could have led to a high risk of performance bias in children for outcomes such as weight and other anthropometrics. Children across groups received the same contact time with study personnel. |
| Blinding of outcome assessment (detection bias) All outcomes | Unclear risk | Comment: outcome assessors were not blinded. The majority of outcomes were dependent on anthropometrical measurements. It is unclear how lack of blinding affected outcome measurements. |
| Incomplete outcome data (attrition bias) All outcomes | High risk | Comment: although loss to follow‐up was not differential, it was large: 23/61 (37.7%) from the experimental group and 24/60 (40%) from the control group. |
| Selective reporting (reporting bias) | Unclear risk | Comment: trial registration number: NCT02907424. Weight gain was the primary outcome prespecified in both the trial register and in the Methods section of the article, and reported in the Results section. Regarding the secondary outcomes, some were prespecified in the trial register that were not addressed in the article (e.g. body composition by skinfold thickness and changes in serum concentrations of fatty acids), and vice versa (e.g. change in height, MUAC, WAZ, HAZ). |
| Other bias | Unclear risk | Comment: baseline characteristics for all randomised children across groups appear balanced. If children did not eat the RUTF to which they were assigned, the alternative RUTF was offered. This happened in both groups: 2/61 children from the experimental group and 1/60 child from the control group. These children stayed in the study in the other group to which they were randomised. However, for the ITT analysis, they were analysed in the group to which they were randomised. Block randomisation with blocks of 4 was done, and in combination with no blinding, this could have posed a risk to selection bias according to section 8.15.1.3 in theCochrane Handbook of Systematic Reviews of Interventions (Higgins 2017). |
Thapa 2017.
| Methods |
Comparison addressed in this review: 1 Study design: individually randomised controlled trial Study period: August 2013‐March 2014 Country and setting: North India, in 3 urban slums Sample size calculation: not reported Child growth standards used for anthropometrical data: WHO Child Growth Standards 2006 Quality of anthropometrical measurements: 2 anthropometrists were recruited; weight, length/height or MUAC measurements described adequately Tested for peanut allergies: not reported |
|
| Participants |
Definition used for SAM: WHZ < −3 with no evidence of infection or oedema Eligible age range: 6‐60 months All randomised children meet review eligibility criteria: yes Total number randomised: 112 children Inclusion criteria
Exclusion criteria
HIV and TB status and treatment: not reported Baseline characteristics of experimental group: mean age = 25.1 (SD = not reported) months; mean weight = 6.44 (SD = 1.6) kg; mean MUAC = 11.12 (SD = 0.47) cm Baseline characteristics of control group: mean age = 32.9 (SD = not reported) months; mean weight = 8.69 (SD = 1.76) kg; mean MUAC = 11.54 (SD = 0.34) cm Stabilised in hospital before start of study: no Rehabilitation started in hospital: no |
|
| Interventions |
Number of arms: 2 Maximum intervention duration: 8 weeks Sample size experimental group: 56 children Sample size control group: 56 children Experimental intervention: "Nutreal" (quote). S‐RUTF was locally produced in an local research institution kitchen. Contained milk powder, vegetable oil, sugar, peanuts (proportions not reported),with added micronutrients. Provided 2280 kJ/100 g, protein = 15.7% of product, fat = 31.4% of product. Packaged in airtight, sterile packets. Children could consume unlimited amounts Control intervention: "Defined food" (quote). A local research institution prepared and pre‐cooked the "defined food" (quote), made from local ingredients (based on cereals, pulses and sugar ‐ "similar to a homemade diet" (quote)) with energy density ranging from 1556 kJ to 1887 kJ per 100 g and protein from 6.8% to 13.6% of product. Packed in sterile packets. A "lady helper" (quote) supported caregivers daily with cooking. Children could consume unlimited amounts Concomitant treatment: not reported Risk that intervention was shared with siblings: no, because the study personnel were involved daily, in cooking and serving the study interventions (in both groups). |
|
| Outcomes |
How often were children assessed during home‐based rehabilitation? Daily Followed up after intervention period? No Outcomes during or at the end of the intervention period Primary outcomes
Secondary outcomes
|
|
| Notes |
Trial registry number: FRAC/Nufl/01 (but cannot locate it on the Internet) Type of study report: published journal article Contacted study authors: yes, but study author did not respond Ethics approval: Food Safety and Standards Authority of India (FSSAI) Ministry of Health and Family Welfare, Government of India (product registration number: 15025/783/2012‐PA/FSSAI) Informed consent: informed consent was obtained from caregivers but it is unclear whether it was provided in writing or orally. Financial contributors: Nuflower Food Private Limited in association with FICCI Research Analysis Centre, New Delhi, India Conflict of interest declared: yes. The study authors declared no potential conflicts of interest with respect to the research, authorship, and/or publication of this article. |
|
| Risk of bias | ||
| Bias | Authors' judgement | Support for judgement |
| Random sequence generation (selection bias) | Unclear risk |
Quote: "The remaining 112 children having uncomplicated SAM were divided into 2 groups of 56 each by simple randomization." Comment: the method of sequence generation was not reported. |
| Allocation concealment (selection bias) | Unclear risk | Comment: not reported |
| Blinding of participants and personnel (performance bias) All outcomes | High risk | Comment: blinding not done because the experimental and control interventions looked very different. The main focus of the study was acceptability, and a lack of blinding is likely to have influenced performance bias (if the caregivers knew what intervention their child was getting, they could have influenced their child to eat more or less of it, according to their own taste preferences or perception of the product). It is unlikely that a lack of blinding could have influenced changes in weight, height and MUAC outcomes. |
| Blinding of outcome assessment (detection bias) All outcomes | Unclear risk | Comment: outcome assessors were not blinded. The majority of outcomes were dependent on anthropometrical measurements. It is unclear how lack of blinding affected outcome measurements. |
| Incomplete outcome data (attrition bias) All outcomes | Low risk | Comment: while not explicitly reported, it appears that there was no loss to follow‐up and that all 112 randomised children (56 per group) completed the trial. |
| Selective reporting (reporting bias) | Unclear risk | Comment: trial registration number: FRAC/Nufl/01, but we could not find this on the Internet and the contact author did not respond to our email. No outcomes prespecified in the Methods section of the article, and recovery, which was the main expected outcome, was not addressed. |
| Other bias | High risk | Comment: there are important differences in baseline age and weight between the experimental and control groups (mean age = 25.1 and 32.9 months, mean weight (kg) = 6.44 (SD = 1.6) and 8.69 (SD = 1.76) kg, respectively). |
A‐HPF: augmented energy‐dense home‐prepared foods; ALA: alpha‐linolenic acid; ARV: anti‐retroviral drugs; CMAM: community‐based management of acute malnutrition; DHA: docosahexaenoic acid; ELISA: enzyme‐linked immunoabsorbent assay; EPA: eicosapentaenoic acid; F‐RUTF: flax‐seed oil‐containing ready‐to‐use therapeutic food; HAZ: height for age z score; Ho‐RUTF: high oleic acid ready‐to‐use therapeutic food; ITT: intention to treat; kCal: kilocalories; kJ: kilo joules; LA: omega‐6 linoleic acid; MAM: moderate acute malnutrition; MUAC: mid‐upper arm circumference; NCHS: National Center for Health Statistics; NRU: nutrition rehabilitation unit; OTP: outpatient therapeutic programme; P‐RUTF: standard peanut‐based ready‐to‐use therapeutic food; RUTF: ready‐to‐use therapeutic food; RUTF‐C: centrally produced ready‐to‐use therapeutic food; RUTF‐L: locally produced ready‐to‐use therapeutic food; S‐RUTF: standard ready‐to‐use therapeutic food; SAM: severe acute malnutrition; SD: standard deviation; SMS‐RUTF: milk‐free soy‐maize‐sorghum‐based ready‐to‐use therapeutic food; TB: tuberculosis; WAZ: weight for age z score; WHO: World Health Organization; WHZ: weight for height z score; WPC: whey protein concentrates
Characteristics of excluded studies [ordered by study ID]
| Study | Reason for exclusion |
|---|---|
| Amthor 2009 | Ineligible study design |
| Ashraf 2017 | Ineligible study design |
| Bahwere 2016 | Ineligible comparison |
| Bahwere 2017 | Ineligible comparison |
| Briend 1999 | Ineligible study design |
| Brown 2015 | Ineligible patient population |
| Choudhury 2018 | Ineligible comparison |
| CTRI/2013/02/003418 | According to the contact person (Shewade 2017 [pers comm]), the study was not conducted due to lack of funding. |
| Dani 2017 | Ineligible study design |
| Diop 2003 | Ineligible comparison |
| Diop 2004 | Ineligible comparison |
| Dube 2009 | Ineligible patient population |
| Greco 2006 | Wrong study design |
| Ige 2014 | Ineligible study design |
| Kuusipalo 2006 | Treatment not RUTF |
| Lagrone 2010 | Ineligible study design |
| LaGrone 2012 | Treatment not RUTF |
| Linneman 2007 | Ineligible study design |
| Lopriore 2004 | Treatment not RUTF |
| Maleta 2004 | Ineligible patient population |
| Malik 2016 | Treatment not RUTF (although it had similar ingredients to WHO‐recommended RUTF, caregivers had to prepare it at home and thus is not "ready‐to‐use") |
| Mallewa 2018 | Ineligible patient population |
| Mamidi 2011 | Ineligible study design |
| Manary 2013 | Ineligible study design |
| Matilsky 2009 | Treatment not RUTF |
| Maust 2015 | Ineligible patient population and ineligible comparison |
| Nackers 2010 | Ineligible patient population |
| Navarro‐Colorado 2005 | Ineligible comparison |
| Nga 2013 | Ineligible patient population |
| Patel 2005 | Prevention study |
| Phuka 2008 | Treatment not RUTF |
| Sandige 2004 | Ineligible comparison |
| Sato 2018 | Ineligible comparison |
| Singh 2010 | Ineligible patient population |
| Thakwalakwa 2010 | Treatment not RUTF |
| Van Hoan 2009 | Treatment not RUTF |
| Wasnik 2012 | Ineligible patient population |
RUTF: ready‐to‐use therapeutic food; WHO: World Health Organization.
Characteristics of studies awaiting assessment [ordered by study ID]
Huq 2013.
| Methods |
Source: conference abstract Design: individually randomised controlled trial Study start and end dates: 2009‐2012 Setting: nutrition rehabilitation unit (NRU), but It is unclear whether it was an inpatient setting only, or home‐based rehabilitation as well Location: Bangladesh, South‐East Asia Objective: "...to assess the comparative acceptability and efficacy of commercial RUTF (Plumpy'nut®) and rice‐lentils based traditional‐diets (khichuri and halwa)." Sample size: 224 children were randomised equally to 2 groups |
| Participants |
Inclusion criteria
Exclusion criteria: not reported |
| Interventions |
Interventions
Intervention duration: not reported Comment: addresses our Comparison 1 |
| Outcomes |
Timing of outcome assessment: not reported |
| Notes |
Comment: we emailed the study authors, but were unsuccessful in obtaining a manuscript with more detail. Sponsors and collaborators: not reported |
Kaleem 2014.
| Methods |
Source: published manuscript Design: individually randomised controlled trial Location: Muzaffargarh, Pakistan Study start and end dates: June 2011‐June 2012 Setting: 4 outpatient therapeutic programme (OTP) units. Home‐based rehabilitation took place Objective: to test "...a special high density diet made from locally available ingredients...against an imported ready to use therapeutic food for the rehabilitation of severely malnourished children" Sample size: 270 children |
| Participants |
Inclusion criteria
Exclusion criteria
|
| Interventions |
Interventions:
Intervention duration: 12 weeks Comment: the first 2 arms are eligible for our review. Addresses our Comparison 1 |
| Outcomes |
Timing of outcome assessment: maximum of 12 weeks |
| Notes |
Comment: the main results for the two relevant groups were exactly the same per group, which we feel is unlikely to have been because of chance or the exact same effects of the interventions. Also, there is a discrepancy in the article for the results of the outcome weight gain, where slightly different results were provided in the table compared to what was reported in the text. There are also some other data errors in the manuscript, where the percentage for the number of events out of the total sample size was not calculated correctly. This raised our concerns about the accuracy of the reporting and we contacted the study author who confirmed that we should use the results in the paper; however, we remain cautious. Sponsors and collaborators? Not explicitly reported. Study authors mentioned that "Unfortunately standard therapy is not widely available in Pakistan. A few Nutritional Rehabilitation Units (NRUs) are functional and these are mostly supported and funded by international agencies." (quote) |
MUAC: mid‐upper arm circumference; NRU: nutrition rehabilitation unit; OTP: outpatient therapeutic programme; RUTF: ready‐to‐use therapeutic food; SAM: severe acute malnutrition; SD: standard deviation; WHZ: weight for height z score;
Characteristics of ongoing studies [ordered by study ID]
CTRI/2014/09/004958.
| Trial name or title |
Public title: To establish effective nutrition protocol for community based management of children with severe acute malnutrition and to demonstrate operational feasibility through the existing Government system in Nandurbar district of Maharashtra in India Scientific title: Community‐based management of acute malnutrition (CMAM) using global protocol ‐ MNT/RUTF in Nandurbar ‐ CMAM |
| Methods | Cluster‐randomised controlled trial |
| Participants |
Inclusion criteria
Exclusion criteria:
|
| Interventions |
Arm 1: semi‐solid RUTF; 500 kCal/92 g (2092 kJ/92 g), given to children at 150‐170 kCal/kg/day (628‐711 kJ/kg/day) for 8 weeks or until discharge criteria achieved Arm 2: locally prepared RUTF; 550 kCal/100 g (2301 kJ/100 g), given to children at 150‐170 kCal/kg/day (628‐711 kJ/kg/day) for 8 weeks or until discharge criteria achieved Arm 3: locally prepared recipes using amylase‐rich flour (with standard micronutrient syrup); 1000 kCal/day (4184 kJ/day), given for 8 weeks or until discharge criteria achieved |
| Outcomes |
Primary outcomes
Secondary outcomes
|
| Starting date | September 2014 |
| Contact information |
Contact person: Mrudula Phadke Email:drmapaa@yahoo.com Affiliation: UNICEF |
| Notes |
Location: India Sponsor(s) and collaborator(s): Jamshetji Tata Trust; Government of Maharashtra; UNICEF |
CTRI/2016/02/006656.
| Trial name or title |
Public title: Gut inflammation markers as determinants of response to recovery in uncomplicated severe acute malnourished children Scientific title: Gut inflammation markers as determinants of response to treatment and recovery in children with uncomplicated severe acute malnutrition undergoing community‐based rehabilitation |
| Methods | Randomised controlled trial, parallel‐group design |
| Participants |
Inclusion criteria
Exclusion criteria
|
| Interventions |
Arm 1: RUTF produced by an Indian company; given as per weight for 16 weeks or until recovery Arm 2: RUTF produced by the study team; given as per weight for 16 weeks or until recovery Arm 3: high‐energy and micronutrient‐rich foods provided to and prepared by caregivers at home; given as per weight for 16 weeks or until recovery |
| Outcomes |
Primary outcomes
|
| Starting date | August 2013 |
| Contact information |
Contact person: Sunita Taneja Email: Sunita.taneja@sas.org.in Affiliation: Centre for Health Research and Development Society for Applied Studies, New Delhi, India |
| Notes |
Location: India Sponsor(s) and collaborator(s): Bill & Melinda Gates Foundation |
ISRCTN30393230.
| Trial name or title |
Public title: Combined protocol for acute malnutrition study (ComPAS) Scientific title: Combined Protocol for Acute Malnutrition Study (ComPAS) ‐ effectiveness of a combined and simplified protocol for the treatment of acute malnutrition: a prospective, multi‐center cluster‐randomized controlled non‐inferiority trial in Kenya and South Sudan |
| Methods | Cluster‐randomised controlled, non‐inferiority trial |
| Participants |
Inclusion criteria
Exclusion criteria
|
| Interventions |
Arm 1: simplified protocol for admission of acutely malnourished children based on MUAC, case management and treatment with a reduced dosage of RUTF (Plumpy'nut®). Children with MUAC < 11.5 cm or oedema, or both: 2 x 92 g sachets RUTF/day (1000 kCal/day, 4184 kJ/day); children with MUAC 11.5 to 12.5 cm: 1 x 92 g sachet RUTF/day (500 kCal/day, 2092 kJ/day) Arm 2: case management and treatment with RUTF (Plumpy'nut®) for children with SAM at 200 kCal/kg/day (837 kJ/kg/day) or RUSF (Plumpy’sup®) for children with MAM at 500 kCal/day (2092 kJ/day), as per national treatment protocols |
| Outcomes |
Primary outcomes
Secondary outcomes
|
| Starting date | January 2017 |
| Contact information |
Contact person: Jeanette Bailey Email:Jeanette.bailey@rescue.org Affiliation: International Rescue Committee, New York, USA |
| Notes |
Location: Kenya and South Sudan Sponsor(s) and Collaborator(s): Children’s Investment Fund Foundation; United States Agency for International Development/Office of Disaster Assistance; London School of Hygiene & Tropical Medicine |
ISRCTN31143316.
| Trial name or title |
Public title: Treatment of severe acute malnutrition delivered by community health workers in Niger Scientific title: A cohort study comparing treatment for severe acute malnutrition (SAM) in children between 6‐59 months, delivered by community health workers (CHWs) compared to a traditional facility based model in Mayahi district, Niger |
| Methods | "Interventional randomised controlled trial" (quote) |
| Participants |
Inclusion criteria
Exclusion criteria
|
| Interventions |
Arm 1: RUTF sachets provided by CHWs Arm 2: "usual treatment" (quote) in health centres Both arms to receive treatment once a week for 12 months |
| Outcomes |
Primary outcomes
Secondary outcomes
|
| Starting date | October 2017 |
| Contact information |
Contact person: Pilar Charle Cuellar Email:pcharle@accioncontraelhambre.org Affiliation: Calle duque de Sevilla nº3, Madrid, Spain |
| Notes |
Location: Niger Sponsor(s) and collaborator(s): Action against Hunger; USAID, USA |
ISRCTN50039021.
| Trial name or title |
Public title: Modelling an alternative nutrition protocol generalizable for outpatient (MANGO) Scientific title: Modelling an alternative nutrition protocol for outpatient (MANGO) ‐ effectiveness of an optimised dosage of RUTF for the treatment of severe acute malnutrition: a randomized controlled, non‐inferiority trial in Burkina Faso |
| Methods | Randomised controlled, non‐inferiority trial |
| Participants |
Inclusion criteria
Exclusion criteria
|
| Interventions |
Arm 1: standard dose of RUTF for the first 2 weeks (about 144‐204 kCal/kg/week (602‐854 kJ/kg/week), depending on weight), and thereafter a reduced dose of RUTF (about 67‐183 kCal/kg/week (280‐766 kJ/kg/week) depending on weight) until discharge Arm 2: standard dose of RUTF for the first 2 weeks (about 144‐204 kCal/kg/week (602‐854 kJ/kg/week), depending on weight), followed by standard dose until discharge |
| Outcomes |
Primary outcomes
Secondary outcomes
|
| Starting date | January 2015 |
| Contact information |
Contact person: Cécile Salpéteur Email:csalpeteur@actioncontrelafaim.org Affiliation: Action Contre la Faim, Paris, France |
| Notes |
Location: Burkina Faso Sponsor(s) and collaborator(s): Children’s Investment Fund Foundation; European Commission’s Humanitarian Aid and Civil Protection Department and Humanitarian Innovation Fund |
NCT00131417.
| Trial name or title |
Public title: Ready to use therapeutic food in the rehabilitation of severely malnourished children Scientific title: Comparison of the efficacy of a ready‐to‐use therapeutic food with a milk‐based diet in the rehabilitation of severely malnourished Ugandan children |
| Methods | Randomised controlled trial, parallel‐group design |
| Participants |
Inclusion criteria
Exclusion criteria
|
| Interventions |
Arm 1: semi‐solid RUTF, providing 545 kCal (2280 kJ) per 100 g, 10% protein and 59% fat, given 5 times daily Arm 2: high‐energy milk, providing 100 kCal (418 kJ) per 100 mL and 2.9% protein, given 5 times daily |
| Outcomes |
Primary outcomes
Secondary outcomes
|
| Starting date | October 2004 |
| Contact information |
Contact person: Harriet Nambuya Email:nambuyaharriet@yahoo.com Affiliation: Makerere University, Uganda |
| Notes |
Location: Uganda Sponsor(s) and collaborator(s): Makerere University, Kampala, Uganda; Norwegian Programme for Development, Research and Education (NUFU) |
NCT00941434.
| Trial name or title |
Public title: Community based management of malnutrition Scientific title: Community based management of malnutrition. A proposal for Pakistan initiative for mothers and newborns |
| Methods | "Step wedge randomised trial", cross‐over design |
| Participants |
Inclusion criteria
Exclusion criteria
|
| Interventions |
Arm 1: RUTF provided until WAZ no longer in severe malnutrition group Arm 2: S‐RUTF (Nutributter) provided until WAZ no longer in severe malnutrition group |
| Outcomes |
Primary outcomes
Secondary outcomes
|
| Starting date | July 2009 |
| Contact information |
Contact person: Zulfiqar A Bhutta Email:Zulfiqar.bhutta@sickkids.ca, zulfiqar.bhutta@aku.edu Affiliation: Aga Khan University, Pakistan |
| Notes |
Location: Pakistan Sponsor(s) and collaborator(s): Aga Khan University, Pakistan; John Snow Inc.; Pakistan Ministry of Health |
NCT01144806.
| Trial name or title |
Public title: Evaluation of energy expenditure, body composition and recovery rates in children with severe acute malnutrition Scientific title: Evaluation of energy expenditure, body composition and recovery rates in children with severe acute malnutrition (SAM) receiving community‐based nutritional rehabilitation therapy |
| Methods | Randomised controlled trial |
| Participants |
Inclusion criteria
Exclusion criteria
|
| Interventions |
Arm 1: RUTF supplement, Plumpy'nut® Arm 2: nutrition education to caregivers using the principles of infant and young child feeding (IYCF), and dietary diversification |
| Outcomes |
Primary outcome
|
| Starting date | June 2010 |
| Contact information |
Contact person: Zulfiqar A Bhutta Email:Zulfiqar.bhutta@sickkids.ca, zulfiqar.bhutta@aku.edu Affiliation: Aga Khan University, Pakistan |
| Notes |
Location: Pakistan Sponsor(s) and collaborator(s): Aga Khan University, Pakistan; International Atomic Energy Agency |
NCT01331044.
| Trial name or title |
Public title: Ready‐to‐use therapeutic food (RUTF) severe malnourished children (RUTF) Scientific title: Efficacy and acceptability of ready‐to‐use therapeutic food (RUTF) in children aged 6‐24 months with severe acute malnutrition in Bangladesh |
| Methods | Randomised, parallel‐group, controlled trial |
| Participants |
Inclusion criteria
Exclusion criteria
|
| Interventions |
Arm 1: RUTF (Plumpy'nut®) at 200 kCal/kg/day (837 kJ/kg/day) in sequential manner; 125 kCal/kg (523 kJ/kg) in the first 24 h, followed by 150 kCal/kg (628 kJ/kg) in the second 24 h, and 200 kCal/kg (837 kJ/kg) by the third day Arm 2: local food (kichuri and halwa) in sequential manner; 125 kCal/kg (523 kJ/kg) in the first 24 h, followed by 150 kCal/kg (628 kJ/kg) in the second 24 h, and 200 kcal/kg (837 kJ/kg) by the third day |
| Outcomes |
Primary outcomes
Secondary outcomes
|
| Starting date | October 2009 |
| Contact information |
Contact person: Sayeeda Huq Email:sayeeda@icddrb.org Affiliation: International Centre for Diarrhoea Diseases Research, Dhaka, Bangladesh |
| Notes |
Location: Bangladesh Sponsor(s) and Collaborator(s): International Centre for Diarrhoea Diseases Research; International Atomic Agency; Washington University School of Medicine; University of Virginia, USA |
NCT01634009.
| Trial name or title |
Public title: Soy‐ready to use therapeutic food (RUTF) in severely malnourished children Scientific title: Efficacy of ready to use therapeutic food using soy protein isolate in under‐5 children with severe acute malnutrition in Bangladesh |
| Methods | Randomised controlled trial, parallel‐group design |
| Participants |
Inclusion criteria
Exclusion criteria
|
| Interventions |
Arm 1: milk‐based (standard) RUTF given daily, until achieving WHZ of −2 Arm 2: soy‐based RUTF given daily until achieving WHZ of −2 |
| Outcomes |
Primary outcome
|
| Starting date | July 2012 |
| Contact information |
Contact person: Iqbal Hossain Email:ihossain@icddrb.org Affiliation: International Centre for Diarrhoea Diseases Research, Dhaka, Bangladesh |
| Notes |
Location: Bangladesh Sponsor(s) and Collaborator(s): International Centre for Diarrhoea Diseases Research |
NCT03094247.
| Trial name or title |
Public title: Feeding malnourished children different types of fatty acids to promote neurocognitive development Scientific title: Improved polyunsaturated ready‐to‐use therapeutic food for improved neurocognitive outcomes in severe acute malnutrition |
| Methods | Randomised controlled trial, parallel‐group design |
| Participants |
Inclusion criteria:
Exclusion criteria
|
| Interventions |
Arm 1: conventional RUTF (formulated with standard peanuts, C‐RUTF) Arm 2: high oleic acid RUTF (formulated with high oleic content peanuts, HO‐RUTF) Arm 3: DHA‐supplemented HO‐RUTF (formulated with high oleic content peanuts and DHA) |
| Outcomes |
Primary outcomes
Secondary outcomes
|
| Starting date | September 2017 |
| Contact information |
Contact person 1: Mark Manary Email:manary@kids.wustl.edu Affiliation: Washington University School of Medicine, USA Contact person 2: Kenneth Maleta Email:ken.maleta@gmail.com Affiliation: University of Malawi College of medicine, Blantyre, Malawi |
| Notes |
Location: Malawi Sponsor(s) and Collaborator(s): Washington University School of Medicine; University of Texas; Cornell University, USA; University of Malawi Colleage of Medicine, Malawi |
NCT03407326.
| Trial name or title |
Public title: Comparison of an alternative therapeutic food for the international food aid market to a standard ready‐to‐use therapeutic food (RUTF) Scientific title: Comparison of an alternative therapeutic food for the international food aid market to a standard ready‐to‐use therapeutic food (RUTF) for the treatment of severe acute malnutrition in children of the western rural region and Pujehun district of Sierra Leone |
| Methods | Randomised controlled trial, parallel‐group design |
| Participants |
Inclusion criteria
Exclusion criteria
|
| Interventions |
Arm 1: alternative RUTF (formulated with oats) at 190 kCal/kg/day until recovery or a maximum of 12 weeks Arm 2: standard RUTF at 190 kCal/kg/day until recovery or a maximum of 12 weeks |
| Outcomes |
Primary outcomes
Secondary outcomes
|
| Starting date | September 2018 |
| Contact information |
Contact person: Mark Manary Email:manarymj@sustl.edu Affiliation: Washington University School of Medicine, USA |
| Notes |
Location: Sierra Leone Sponsor(s) and collaborator(s): Washington University School of Medicine; The Children's Investment Fund Foundation |
CHW: community health workers; CMAM: community management of acute malnutrition; DHA: docosahexaenoic acid; HAZ: height‐for‐age z score; IYCF: infant and young child feeding; kCal: kilocalories; kJ: kilo joules; MAM: moderate acute malnutrition; MUAC: mid‐upper arm circumference; NCHS: National Center for Health Statistics; RUTF: ready‐to‐use therapeutic food; RUSF: ready‐to‐use supplementary food; SAM: severe acute malnutrition; S‐RUTF: standard ready‐to‐use therapeutic food; TB: tuberculosis; WAZ: weight for age z score; WHO: World Health Organization; WHZ: weight for height z score; UNICEF: United Nations International Children's Emergency Fund
Differences between protocol and review
The protocol for this review was published in the February 2011 issue of the Cochrane Library with the title 'Ready‐to‐use therapeutic food for treating undernutrition in children from 6 months to 5 years of age' (Schoonees 2011). The objectives were "to assess the effects of RUTF [ready‐to‐use therapeutic food] on health outcomes such as recovery rate, relapse during the intervention period, anthropometrical status, weight gain and mortality in children with moderate or severe undernutrition" (quote). Therefore, we originally planned to include children with both moderate acute malnutrition (MAM) and severe acute malnutrition (SAM), and include RUTF treatment in facilities and at home. In June 2012, the first review author (AS) presented the draft findings of this review at the South African Cochrane Centre's monthly Cochrane Busting Session, which was attended by national and international researchers doing work on priority topics in low‐ and middle‐income countries, including Cochrane Reviews. At this meeting, questions about the scope of our RUTF review were raised. RUTF was originally developed as a home‐based alternative to the more expensive facility‐based treatment of children with SAM. Points raised included the following.
In rural areas, where people reside far from healthcare facilities, home‐based treatment is more practical.
From a health system's perspective, it is important to know whether the cheaper RUTF regimen (RUTF as a supplement rather than RUTF meeting daily nutritional requirements) and formulation (reduced milk powder content) can achieve similar or better health outcomes.
From a nutritional perspective, it is important that the children's caregivers sustain and improve culture‐specific dietary habits instead of relying solely on provided medical nutritional therapy.
After further discussion, including with additional stakeholders, we decided to change the scope of our RUTF review to include only home‐based RUTF treatment, and to focus only on children with SAM. We assessed the treatment effects of home‐based RUTF compared to the standard diet in children with SAM, and also investigated whether a cheaper RUTF treatment (in smaller amounts or using a cheaper recipe) could achieve similar health outcomes than conventional RUTF. Thus, our review did not overlap with the Cochrane Review by Lazzerini et al, which evaluated the "safety and effectiveness of different types of foods for children with moderate acute malnutrition (MAM) in low‐ and middle‐income countries" (Lazzerini 2012; Lazzerini 2013).
Apart from changing the intended scope of the review, we also made the following small amendments to the Types of outcome measures section, when conducting the first full version of this review (Schoonees 2013).
We changed the first primary outcome, from "recovery rate as defined by the study authors" to "recovery as defined by the study authors", as this is a more inclusive outcome; none of the included studies reported recovery as a rate. In future, should studies provide results for 'recovery rate', we will include them in our review.
We added the words "and beyond" to the outcome of "deterioration or relapse during the intervention period as defined by study authors", so that it read as "deterioration or relapse during and beyond the intervention period as defined by the study authors". We did this because felt that relapse at follow‐up was important, as it is an indication of whether the intervention has a longer‐term effect.
We added "time to recovery (duration of rehabilitation)" as a second secondary outcome, as this is useful from both a cost and clinical perspective.
Differences between protocol, review and this update
In 2017, when we started to update the 2013 review (Schoonees 2013), we made the following small changes.
-
Title.
We refined the title by changing "home‐based treatment" to "home‐based nutritional rehabilitation" of RUTF. We wanted to make it clear to the reader from the outset that we are not focusing on the 'stabilisation' phase of treatment, which usually requires hospitalisation.
-
We kept the comparisons the same, but changed the order for Comparisons 2 and 3 around, so that the experimental group in all comparisons are standard RUTF. We feel, in this way, it is easier for the reader to follow.
-
We added another decision rule to our criteria: where a potentially eligible study randomised participants that were not all eligible to our review (e.g. included MAM children or children outside of our prespecified age range), we included the study if 50% or more of the participants met our review criteria, and we were able to obtain the separate results for our eligible subgroup.
-
We updated our wording in terms of the types of experimental and control interventions. In our previous review all three included studies for Comparison 1 had the same control group and there was only one study that addressed Comparison 3. We had to change our wording to accommodate other eligible studies that used different control groups.
We replaced the phrase "as defined by authors" (quote) in relation to the experimental RUTF with "meeting the WHO recommendations for nutritional composition" (quote).
We added another decision rule to our criteria: where children were stabilised in hospital pre‐trial and started rehabilitation as inpatients, we included the study as long as the majority (≥ 50%) of the trial's intervention period occurred at home.
-
We added acceptability as secondary outcome, as standard RUTF may not be acceptable across cultures and settings.
We added time points to all outcomes, since, for example, for time to recovery and rate of weight gain (g/kg/day), it only makes sense to measure this during the intervention period.
-
We added Epistemonikos to the list of databases in order to identify other relevant systematic reviews.
The Information Specialist of Cochrane Developmental, Psychosocial and Learning Problems added the MeSH term 'food formulated' to increase the sensitivity of search strategy.
We developed a separate search strategy to find cost‐effectiveness studies, and searched NHS Economic Evaluation Database and EconLit in addition to MEDLINE and Embase.
We added an economic commentary in the Discussion section, as this information may be useful to policymakers.
-
Assessment of risk of bias in included studies
In our protocol, Schoonees 2011, and 2013 review, Schoonees 2013, we did not prespecify which domains we considered when assessing the overall risk of bias per included trial. For this review update, we made this decision by looking overall at the domains addressing selection bias, attrition bias (specifically large or differential attrition between groups) and 'other bias'.
-
Subgroup analysis and investigation of heterogeneity
-
We added the following subgroup analyses listed below. In our previous review (Schoonees 2013), all three included studies for Comparison 1 had the same control group and there was only one study that addressed Comparison 3. We had to update our subgroups to address important difference between studies:
pre‐trial hospital stabilisation versus no pre‐trial hospitalisation; and
commercial (i.e. factory) versus non‐commercially produced (i.e. institution kitchen) RUTF.
We were unable to conduct the following subgroup analysis because of the manner in which the data were reported: Age of children: 6 to 12 months, as this is the ideal period to start weaning from a milk‐based diet; 13 months to 5 years, as these children consume a mixed diet (mostly not breast milk although the child may still be taking some).
-
-
Instead of using allocation concealment as a marker of study quality, we used overall low risk of bias, as we felt that other aspects of methodological quality were equally important. This is in line with criteria 12 of the AMSTAR 2 tool (Shea 2017).
-
We previously excluded Dube 2009 in our 2013 review (Schoonees 2013), because the "Outcome [was] not applicable (an acceptability trial)". We reconsidered this trial's eligibility for this update, as it now includes acceptability as an outcome. The study remains excluded because participants, as per Figure 1 in the article, were moderately malnourished and thus the study does not meet our inclusion criteria (Criteria for considering studies for this review).
Contributions of authors
Anel Schoonees (AS) initiated and developed the idea. AS and Jimmy Volmink (JV) wrote the protocol, Schoonees 2011, with input from Martani Lombard (ML) and Etienne Nel (EN). AS, Alfred Musekiwa (AM) and ML screened the 2017 and 2018 search outputs for eligibility and gave reasons for exclusion; the earlier search results were screened by AS and ML. AS, AM, ML and Marianne Visser extracted data. EN, AM and AS extracted economic data. AS and ML assessed risk of bias for the included studies; JV resolved disagreements. AS and ML graded the quality of the evidence using the GRADE approach. AM, AS and ML conducted the analyses and wrote the Results section with input from JV. AS and EN wrote the Discussion and Conclusion sections, with input from ML, JV and AM. EN wrote the economic commentary. EN, ML and AS put together the TIDieR tables. All review authors provided input in the final draft of this systematic review. AS is the guarantor for the review.
Sources of support
Internal sources
-
Effective Health Care Research Consortium, UK.
Anel Schoonees has been partly supported by the Effective Health Care Research Consortium. This Consortium is funded by UK aid from the UK Government for the benefit of developing countries (Grant: 5242). The views expressed in this publication do not necessarily reflect UK Government policy.
-
Research, Evidence and Development Initiative (READ‐It), UK.
Anel Schoonees is partly supported by the Research, Evidence and Development Initiative (READ‐It) project. READ‐It (project number 300342‐104) is funded by UK aid from the UK Government; however, the views expressed do not necessarily reflect the UK Government’s official policies.
External sources
None, Other.
Declarations of interest
Anel Schoonees ‐ none known
Martani Lombard ‐ none known
Alfred Musekiwa ‐ none known
Etienne Nel has received honoraria from the following organisations in 2018 for lectures given:
AbbVie. Topic: Crohn’s Disease in Children
Nestle Nutrition Institute in Africa. Topic: Human Milk Oligosaccharides
Cipla. Topic: Constipation in Children
Jimmy Volmink ‐ none known
New search for studies and content updated (conclusions changed)
References
References to studies included in this review
Bahwere 2014 {published and unpublished data}
- Bahwere P, Banda T, Sadler K, Nyirenda G, Owino V, Shaba B, et al. Effectiveness of milk whey protein‐based ready‐to‐use therapeutic food in treatment of severe acute malnutrition in Malawian under‐5 children: a randomised, double‐blind, controlled non‐inferiority clinical trial. Maternal & Child Nutrition 2014;10(3):436‐51. [DOI: 10.1111/mcn.12112; PUBMED: 24521353] [DOI] [PMC free article] [PubMed] [Google Scholar]
Bhandari 2016 {published data only}
- Bhandari N, Mohan SB, Bose A, Iyengar SD, Taneja S, Mazumder S, et al. Efficacy of three feeding regimens for home‐based management of children with uncomplicated severe acute malnutrition: a randomised trial in India. BMJ Global Health 2016;1(4):e000144. [DOI: 10.1136/bmjgh-2016-000144] [DOI] [PMC free article] [PubMed] [Google Scholar]
Ciliberto 2005 {published and unpublished data}
- Ciliberto MA, Sandige H, Ndekha MJ, Ashorn P, Briend A, Ciliberto HM, et al. Comparison of home‐based therapy with ready‐to‐use therapeutic food with standard therapy in the treatment of malnourished Malawian children: a controlled, clinical effectiveness trial. American Journal of Clinical Nutrition 2005;81(4):864‐70. [DOI: 10.1093/ajcn/81.4.864; PUBMED: 15817865] [DOI] [PubMed] [Google Scholar]
Hsieh 2015a {published data only}
- Hsieh J‐C, Liu L, Zeilani M, Ickes S, Trehan I, Maleta K, et al. High‐oleic ready‐to‐use therapeutic food maintains docosahexaenoic acid status in severe malnutrition. Journal of Pediatric Gastroenterology and Nutrition 2015;61(1):138‐43. [DOI: 10.1097/MPG.0000000000000741; PMC4483140; PUBMED: 25633498] [DOI] [PMC free article] [PubMed] [Google Scholar]
Hsieh 2015b {published and unpublished data}
- Hsieh J‐C, Liu L, Zeilani M, Ickes S, Trehan I, Maleta K, et al. High‐oleic ready‐to‐use therapeutic food maintains docosahexaenoic acid status in severe malnutrition. Journal of Pediatric Gastroenterology and Nutrition 2015;61(1):138‐43. [DOI: 10.1097/MPG.0000000000000741; PMC4483140; PUBMED: 25633498] [DOI] [PMC free article] [PubMed] [Google Scholar]
Irena 2015 {published and unpublished data}
- Irena AH, Bahwere P, Owino VO, Diop EI, Bachmann MO, Mbwili‐Muleya C, et al. Comparison of the effectiveness of a milk‐free soy‐maize‐sorghum‐based ready‐to‐use therapeutic food to standard ready‐to‐use therapeutic food with 25% milk in nutrition management of severely acutely malnourished Zambian children: an equivalence non‐blinded cluster randomised controlled trial. Maternal & Child Nutrition 2015;11(Suppl 4):105‐19. [DOI: 10.1111/mcn.12054; PUBMED: 23782554] [DOI] [PMC free article] [PubMed] [Google Scholar]
Jadhav 2016 {published and unpublished data}
- Jadhav A, Dias B, Shah N, Fernandes L, Fernandes S, Surve A, et al. A randomized controlled facility based trial to assess the impact of indigenously prepared ready to use therapeutic food (RUTF) for children with severe acute malnutrition in Inda. Pediatric Oncall 2016;13(4):93‐8. [DOI: 10.7199/ped.oncall.2016.61] [DOI] [Google Scholar]
Jones 2015 {published data only}
- Jones KD, Ali R, Khasira MA, Odera D, West AL, Koster G, et al. Ready‐to‐use therapeutic food with elevated n‐3 polyunsaturated fatty acid content, with or without fish oil, to treat severe acute malnutrition: a randomized controlled trial. BMC Medicine 2015;13:93. [DOI: 10.1186/s12916-015-0315-6; PMC4407555; PUBMED: 25902844] [DOI] [PMC free article] [PubMed] [Google Scholar]
Kerac 2009 {published and unpublished data}
- Kerac M. Improving the Treatment of Severe Acute Malnutrition in Childhood: A Randomized Controlled Trial of Synbiotic‐enhanced Therapeutic Food with Long Term Follow‐up of Post‐treatment Mortality and Morbidity [Doctoral thesis]. London (UK): University College London, 2011. [discovery.ucl.ac.uk/1306755/] [Google Scholar]
- Kerac M, Bunn J, Seal A, Thindwa M, Tomkins A, Sadler K, et al. Probiotics and prebiotics for severe acute malnutrition (PRONUT study): a double‐blind efficacy randomised controlled trial in Malawi. Lancet 2009;374(9684):136‐44. [DOI: 10.1016/S0140-6736(09)60884-9; PUBMED: 19595348] [DOI] [PubMed] [Google Scholar]
Manary 2004 {published and unpublished data}
- Manary MJ, Ndekha MJ, Ashorn P, Maleta K, Briend A. Home based therapy for severe malnutrition with ready‐to‐use food. Archives of Disease in Childhood 2004;89(6):557‐61. [PMC1719944; PUBMED: 15155403] [DOI] [PMC free article] [PubMed] [Google Scholar]
Ndekha 2005 {published data only (unpublished sought but not used)}
- Ndekha MJ, Manary MJ, Ashorn P, Briend A. Home‐based therapy with ready‐to‐use therapeutic food is of benefit to malnourished, HIV‐infected Malawian children. Acta Paediatrica 2005;94(2):222‐5. [PUBMED: 15981758] [DOI] [PubMed] [Google Scholar]
Oakley 2010 {published and unpublished data}
- Oakley E, Reinking J, Sandige H, Trehan I, Kennedy G, Maleta K, et al. A ready‐to‐use therapeutic food containing 10% milk is less effective than one with 25% milk in the treatment of severely malnourished children. The Journal of Nutrition 2010;140(12):2248‐52. [DOI: 10.3945/jn.110.123828; PMC2981006; PUBMED: 20980648] [DOI] [PMC free article] [PubMed] [Google Scholar]
Shewade 2013 {published data only}
- Shewade HD, Patro BK, Bharti B, Soundappan K, Kaur A, Taneja N. Effectiveness of indigenous ready‐to‐use therapeutic food in community‐based management of uncomplicated severe acute malnutrition: a randomized controlled trial from India. Journal of Tropical Pediatrics 2013;59(5):393‐8. [DOI: 10.1093/tropej/fmt039; PUBMED: 23751252] [DOI] [PubMed] [Google Scholar]
Sigh 2018 {unpublished data only}
- Sigh S, Roos N, Chamnan C, Laillou A, Prak S, Wieringa FT. Effectiveness of a locally produced, fish‐based food product on weight gain among Cambodian children in the treatment of acute malnutrition: a randomized controlled trial. Nutrients 2018;10(7):e909. [DOI: 10.3390/nu10070909; PMC6073612; PUBMED: 30012981] [DOI] [PMC free article] [PubMed] [Google Scholar]
- Sigh S, Roos N, Sok D, Borg B, Chamnan C, Laillou A, et al. Development and acceptability of locally made fish‐based, ready‐to‐use products for the prevention and treatment of malnutrition in Cambodia. Food and Nutrition Bulletin 2018;39(3):420‐34. [DOI: 10.1177/0379572118788266; PUBMED: 30092653 ] [DOI] [PubMed] [Google Scholar]
Thapa 2017 {published data only}
- Thapa BR, Goyal P, Menon J, Sharma A. Acceptability and efficacy of locally produced ready‐to‐use therapeutic food Nutreal in the management of severe acute malnutrition in comparison with defined food. Food and Nutrition Bulletin 2017;38(1):18‐26. [DOI: 10.1177/0379572116689743; PUBMED: 28125907] [DOI] [PubMed] [Google Scholar]
References to studies excluded from this review
Amthor 2009 {published data only}
- Amthor RE, Cole SM, Manary MJ. The use of home‐based therapy with ready‐to‐use therapeutic food to treat malnutrition in a rural area during a food crisis. Journal of the American Dietetic Association 2009;109(3):464‐7. [DOI: 10.1016/j.jada.2008.11.028; PUBMED: 19248863] [DOI] [PubMed] [Google Scholar]
Ashraf 2017 {published data only}
- Ashraf M, Mahmood S, Chaudhry MA. Effect of F‐75, F‐100 and RUTF (ready to use therapeutic food) supplementation in children with severe malnutrition. Pakistan Journal of Medical & Health Sciences 2017;11(1):339‐42. [www.pjmhsonline.com/2017/jan_march/pdf/339.pdf] [Google Scholar]
Bahwere 2016 {published data only}
- Bahwere P, Balaluka B, Wells JC, Mbiribindi CN, Sadler K, Akomo P, et al. Cereals and pulse‐based ready‐to‐use therapeutic food as an alternative to the standard milk‐ and peanut paste‐based formulation for treating severe acute malnutrition: a noninferiority, individually randomized controlled efficacy clinical trial. American Journal of Clinical Nutrition 2016;103(4):1145‐61. [DOI: 10.3945/ajcn.115.119537; PUBMED: 26984485] [DOI] [PubMed] [Google Scholar]
Bahwere 2017 {published data only}
- Bahwere P, Akomo P, Mwale M, Murakami H, Banda C, Kathumba S, et al. Soya, maize, and sorghum–based ready‐to‐use therapeutic food with amino acid is as efficacious as the standard milk and peanut paste–based formulation for the treatment of severe acute malnutrition in children: a noninferiority individually randomized controlled efficacy clinical trial in Malawi. Americal Journal of Clinical Nutrition 2017;106(4):1100–12. [DOI: ; PUBMED: 28814393] [DOI] [PubMed] [Google Scholar]
Briend 1999 {published data only}
- Briend A, Lacsala R, Prudhon C, Mounier B, Grellety Y, Golden MH. Ready‐to‐use therapeutic food for treatment of marasmus. Lancet 1999;353(9166):1767‐8. [DOI: 10.1016/S0140-6736(99)01078-8; PUBMED: 10347999] [DOI] [PubMed] [Google Scholar]
Brown 2015 {published data only}
- Brown M, Nga TT, Hoang M‐A, Maalouf‐Manasseh Z, Hammond W, Thuc TM, et al. Acceptability of two ready‐to‐use therapeutic foods by HIV‐positive patients in Vietnam. Food and Nutrition Bulletin 2015;36(2):102‐10. [DOI: 10.1177/0379572115587498; PUBMED: 26121696] [DOI] [PubMed] [Google Scholar]
Choudhury 2018 {published data only}
- Choudhury N, Ahmed T, Hossain I, Islam MM, Sarker SA, Zeilani M, et al. Ready‐to‐use therapeutic food made from locally available food ingredients is well accepted by children having severe acute malnutrition in Bangladesh. Food and Nutrition Bulletin 2018;39(1):116‐26. [DOI: 10.1177/0379572117743929; PUBMED: 29258336] [DOI] [PubMed] [Google Scholar]
CTRI/2013/02/003418 {published data only}
- CTRI/2013/02/003418. Effectiveness of ready to eat food in treating severely malnourished children in community settings, a study from Puducherry [Effectiveness of indigenous ready to use therapeutic food (RUTF) in community‐based management of uncomplicated severe acute malnutrition (SAM): a randomized trial from Puducherry, India]. www.ctri.nic.in/Clinicaltrials/pdf_generate.php?trialid=6017&EncHid=&modid=&compid=%27,%276017det%27 (first received 21 February 2013).
Dani 2017 {published data only}
- Dani V, Satav K, Pendharkar J, Satav A, Ughade S, Adhav A, et al. Community‐based management of severe malnutrition: SAM and SUW in the tribal area of Melghat, Maharashtra, India. Clinical Epidemiology and Global Health 2017;5(2):62‐9. [DOI: 10.1016/j.cegh.2016.11.003] [DOI] [Google Scholar]
Diop 2003 {published data only}
- Diop EH, Dossou NI, Ndour MM, Briend A, Wade S. Comparison of the efficacy of a solid ready‐to‐use food and a liquid, milk‐based diet for the rehabilitation of severely malnourished children: a randomized trial. American Journal of Clinical Nutrition 2003;78(2):302‐7. [DOI: 10.1093/ajcn/78.2.302; PUBMED: 12885713] [DOI] [PubMed] [Google Scholar]
Diop 2004 {published data only}
- Diop EI, Dossou NI, Briend A, Yaya MM, Ndour MM, Wade S. Home‐based rehabilitation for severely malnourished children using locally made ready‐to‐use therapeutic food (RTUF). Second World Congress of Pediatric Gastroenterology, Hepatology and Nutrition; 2004 Jul 3‐7; Paris (FR) 2004:101‐5.
Dube 2009 {published data only}
- Dube B, Rongsen T, Mazumder S, Taneja S, Rafiqui F, Bhandari N, et al. Comparison of ready‐to‐use therapeutic food with cereal legume‐based khichri among malnourished children. Indian Pediatrics 2009;46(5):383‐8. [PUBMED: 19179743] [PubMed] [Google Scholar]
Greco 2006 {published data only}
- Greco L, Balungi J, Amono K, Iriso R, Corrado B. Effect of a low‐cost food on the recovery and death rate of malnourished children. Journal of Pediatric Gastroenterology and Nutrition 2006;43(4):512‐7. [DOI: 10.1097/01.mpg.0000239740.17606.49; PUBMED: 17033528] [DOI] [PubMed] [Google Scholar]
Ige 2014 {published data only}
- Ige OK, Oladokun RE, Kikelomo O. Comparative weight gain with ready‐to‐use therapeutic food in stunted HIV‐infected and ‐uninfected children in a Nigerian Hospital. South African Journal of Child Health 2014;8(3):104‐7. [DOI: 10.7196/SAJCH.723] [DOI] [Google Scholar]
Kuusipalo 2006 {published data only}
- Kuusipalo H, Maleta K, Briend A, Manary M, Ashorn P. Growth and change in blood haemoglobin concentration among underweight Malawian infants receiving fortified spreads for 12 weeks: a preliminary trial. Journal of Pediatric Gastroenterology and Nutrition 2006;43(4):525‐32. [DOI: 10.1097/01.mpg.0000235981.26700.d3; PUBMED: 17033530] [DOI] [PubMed] [Google Scholar]
Lagrone 2010 {published data only}
- Lagrone L, Cole S, Schondelmeyer A, Maleta K, Manary MJ. Locally produced ready‐to‐use supplementary food is an effective treatment of moderate acute malnutrition in an operational setting. Annals of Tropical Paediatrics 2010;30(2):103‐8. [DOI: 10.1179/146532810X12703901870651; PUBMED: 20522296] [DOI] [PubMed] [Google Scholar]
LaGrone 2012 {published data only}
- LaGrone LN, Trehan I, Meuli GJ, Wang RJ, Thakwalakwa C, Maleta K, et al. A novel fortified blended flour, corn‐soy blend "plus‐plus," is not inferior to lipid‐based ready‐to‐use supplementary foods for the treatment of moderate acute malnutrition in Malawian children. American Journal of Clinical Nutrition 2012;95(1):212‐9. [DOI: 10.3945/ajcn.111.022525; PMC3238461; PUBMED: 22170366] [DOI] [PMC free article] [PubMed] [Google Scholar]
Linneman 2007 {published data only}
- Linneman Z, Matilsky D, Ndekha M, Manary MJ, Maleta K, Manary MJ. A large‐scale operational study of home‐based therapy with ready‐to‐use therapeutic food in childhood malnutrition in Malawi. Maternal & Child Nutrition 2007;3(3):206‐15. [DOI: 10.1111/j.1740-8709.2007.00095.x; PUBMED: 17539889] [DOI] [PMC free article] [PubMed] [Google Scholar]
Lopriore 2004 {published data only}
- Lopriore C, Guidoum Y, Briend A, Branca F. Spread fortified with vitamins and minerals induces catch‐up growth and eradicates severe anemia in stunted refugee children aged 3‐6 y. American Journal of Clinical Nutrition 2004;80(4):973‐81. [DOI: 10.1093/ajcn/80.4.973; PUBMED: 15447908] [DOI] [PubMed] [Google Scholar]
Maleta 2004 {published data only}
- Maleta K, Kuittinen J, Duggan MB, Briend A, Manary M, Wales J, et al. Supplementary feeding of underweight, stunted Malawian children with ready‐to‐use food. Journal of Pediatric Gastroenterology and Nutrition 2004;38(2):152‐8. [PUBMED: 14734876] [DOI] [PubMed] [Google Scholar]
Malik 2016 {published and unpublished data}
- Malik S, Mittal M, Kushwaha KP. WHO/UNICEF recommended therapeutic food versus home based therapeutic food in the management of severe acute malnutrition: a randomized controlled trial. Sudanese Journal of Paediatrics 2016;16(2):21‐7. [PMC5237831; www.sudanjp.org; PUBMED: 28096555] [PMC free article] [PubMed] [Google Scholar]
Mallewa 2018 {published data only}
- Mallewa J, Szubert AJ, Mugyenyi P, Chidziva E, Thomason MJ, Chepkorir P, et al. Effect of ready‐to‐use supplementary food on mortality in severely immunocompromised HIV‐infected individuals in Africa initiating antiretroviral therapy (REALITY): an open‐label, parallel‐group, randomised controlled trial. Lancet HIV 2018;5(5):e231–40. [DOI: 10.1016/S2352-3018(18)30038-9; PMC5932190; PUBMED: 29653915] [DOI] [PMC free article] [PubMed] [Google Scholar]
Mamidi 2011 {published data only}
- Mamidi RS, Kulkarni B, Radhakrishna KV. Hospital‐based nutrition rehabilitation of children with severe acute malnutrition ‐ experiences from a nutrition centre in India. Nutrition Therapy & Metabolism 2011;29(3):107‐18. [Issn Print: 0393‐5585; Ovid insights.ovid.com/nthme/201129030/01698830‐201129030‐00001] [Google Scholar]
Manary 2013 {published data only}
- Manary M. Protein source and quality in therapeutic foods affect the immune response and outcome in severe acute malnutrition. Food and Nutrition Bulletin 2013;34(2):256‐8. [PUBMED: 23964405] [PubMed] [Google Scholar]
Matilsky 2009 {published data only}
- Matilsky DK, Maleta K, Castleman T, Manary MJ. Supplementary feeding with fortified spreads results in higher recovery rates than with a corn/soy blend in moderately wasted children. Journal of Nutrition 2009;139(4):773‐8. [DOI: 10.3945/jn.108.104018; PMC3151028; PUBMED: 19225128] [DOI] [PMC free article] [PubMed] [Google Scholar]
Maust 2015 {published data only}
- Maust A, Koroma AS, Abla C, Molokwu N, Ryan KN, Singh L, et al. Severe and moderate acute malnutrition can be successfully managed with an integrated protocol in Sierra Leone. Journal of Nutrition 2015;145(11):2604‐9. [DOI: 10.3945/jn.115.214957; PUBMED: 26423737] [DOI] [PubMed] [Google Scholar]
Nackers 2010 {published and unpublished data}
- Nackers F, Broillet F, Oumarou D, Djibo A, Gaboulaud V, Guerin PJ. Effectiveness of ready‐to‐use therapeutic food compared to a corn/soy‐blend‐based pre‐mix for the treatment of childhood moderate acute malnutrition in Niger. Journal of Tropical Pediatrics 2010;56(6):407‐13. [DOI: 10.1093/tropej/fmq019; PUBMED: 20332221] [DOI] [PubMed] [Google Scholar]
Navarro‐Colorado 2005 {published data only}
- Navarro‐Colorado C, Laquière S. Clinical trial of BP100 vs F100 milk for rehabilitation of severe malnutrition. Field Exchange 2005;24:22‐4. [www.ennonline.net/fex/24/clinical] [Google Scholar]
Nga 2013 {published data only}
- Nga TT, Nguyen M, Mathisen R, Hoa DT, Minh HN, Hop LT, et al. Effectiveness of a locally produced ready‐to‐use‐therapeutic food for the treatment of children with acute malnutrition in Vietnam. Annals of Nutrition & Metabolism 2013;63(Suppl 1):1084. [DOI: 10.1159/000354245; PO1727; www.karger.com/Article/Pdf/354245] [DOI] [Google Scholar]
Patel 2005 {published data only}
- Patel MP, Sandige HL, Ndekha MJ, Briend A, Ashorn P, Manary MJ. Supplemental feeding with ready‐to‐use therapeutic food in Malawian children at risk of malnutrition. Journal of Health, Population and Nutrition 2005;23(4):351‐7. [PUBMED: 16599106] [PubMed] [Google Scholar]
Phuka 2008 {published data only}
- Phuka JC, Maleta K, Thakwalakwa C, Cheung YB, Briend A, Manary MJ, et al. Complementary feeding with fortified spread and incidence of severe stunting in 6‐ to 18‐month‐old rural Malawians. Archives of Pediatrics & Adolescent Medicine 2008;162(7):619‐26. [DOI: 10.1001/archpedi.162.7.619; PMC3721756; PUBMED: 18606932] [DOI] [PMC free article] [PubMed] [Google Scholar]
Sandige 2004 {published and unpublished data}
- Sandige H, Ndekha MJ, Briend A, Ashorn P, Manary MJ. Home‐based treatment of malnourished Malawian children with locally produced or imported ready‐to‐use food. Journal of Pediatric Gastroenterology and Nutrition 2004;39(2):141‐6. [PUBMED: 15269617] [DOI] [PubMed] [Google Scholar]
Sato 2018 {published data only}
- Sato W, Furuta C, Matsunaga K, Bahwere P, Collins S, Sadler K, et al. Amino‐acid‐enriched cereals ready‐to‐use therapeutic foods (RUTF) are as effective as milk‐based RUTF in recovering essential amino acid during the treatment of severe acute malnutrition in children: an individually randomized control trial in Malawi. PLoS ONE 2018;13(8):e0201686. [DOI: 10.1371/journal.pone.0201686; PMC6086422; PUBMED: 30096200] [DOI] [PMC free article] [PubMed] [Google Scholar]
Singh 2010 {published data only}
- Singh AS, Kang G, Ramachandran A, Sarkar R, Peter P, Bose A. Locally made ready‐to‐use therapeutic food for treatment of malnutrition: a randomized controlled trial. Indian Pediatrics 2010;47(8):679‐86. [PUBMED: 20972285] [DOI] [PubMed] [Google Scholar]
Thakwalakwa 2010 {published data only}
- Thakwalakwa C, Ashorn P, Phuka J, Cheung YB, Briend A, Puumalainen T, et al. A lipid‐based nutrient supplement but not corn‐soy blend modestly increases weight gain among 6‐ to 18‐month‐old moderately underweight children in rural Malawi. Journal of Nutrition 2010;140(11):2008‐13. [DOI] [PubMed] [Google Scholar]
Van Hoan 2009 {published data only}
- Hoan N, Phu P, Salvignol B, Berger J, Trèche S. Effect of the consumption of high energy dense and fortified gruels on energy and nutrient intakes of 6‐10‐month‐old Vietnamese infants. Appetite 2009;53(2):233‐40. [DOI: 10.1016/j.appet.2009.07.002; PUBMED: 19591885] [DOI] [PubMed] [Google Scholar]
Wasnik 2012 {published data only}
- Wasnik VR, Rathi M. Effect of locally made ready‐to‐use therapeutic food (mushpro health drink powder – MHDP) for treatment of malnutrition on children aged 6 to 72 months in tribal area of Amravati district of Maharashtra, India: a randomized control trial. International Journal of Collaborative Research on Internal Medicine & Public Health 2012;4(7):1472‐87. [internalmedicine.imedpub.com/effect‐of‐locally‐made‐readytouse‐therapeutic‐foodmushpro‐health‐drink‐powder‐‐mhdp‐for‐treatment‐ofmalnutrition‐on‐children‐aged‐6‐to‐72‐months‐in‐tribalarea‐of‐amravati‐district‐of‐maharashtra‐india‐arandomized‐control‐trial.pdf] [Google Scholar]
References to studies awaiting assessment
Huq 2013 {published data only}
- Huq S, Hossain MI, Islam MM, Ahmed T. Acceptability and efficacy of ready‐to‐use therapeutic food in 6‐24 months old children with severe acute malnutrition in Bangladesh. Annals of Nutrition & Metabolism 2013;63(Suppl 1):309. [DOI: 10.1159/000354245; PO109] [DOI] [Google Scholar]
Kaleem 2014 {published data only}
- Kaleem R, Aziz N, Zaman S, Salimi MA. Nutritional rehabilitation of severely malnourished children by high density diet in comparison to ready to use therapeutic food. Pakistan Paediatric Journal 2014;38(4):235‐43. [ISSN 2305‐820X; www.pakmedinet.com/22343] [Google Scholar]
References to ongoing studies
CTRI/2014/09/004958 {published data only}
- CTRI/2014/09/004958. To establish effective nutrition protocol for community based management of children with severe acute malnutrition and to demonstrate operational feasibility through the existing Government system in Nandurbar district of Maharashtra in India [Community based management of acute malnutrition (CMAM) using global protocol ‐ MNT/RUTF in Nandurbar ‐ CMAM]. apps.who.int/trialsearch/Trial2.aspx?trialid=CTRI/2014/09/004958 (first received 2 September 2014). [www.ctri.nic.in/Clinicaltrials/pmaindet2.php?trialid=10011]
CTRI/2016/02/006656 {published data only}
- CTRI/2016/02/006656. Gut inflammation markers as determinants of response to recovery in uncomplicated severely malnourished children [Gut inflammation markers as determinants of response to treatment and recovery in children with uncomplicated severe acute malnutrition undergoing community based rehabilitation ‐ gut markers predictor of recovery in SAM children]. apps.who.int/trialsearch/Trial2.aspx?trialid=CTRI/2016/02/006656 (first received 17 February 2016). [www.ctri.nic.in/Clinicaltrials/pmaindet2.php?trialid=7346]
ISRCTN30393230 {published data only}
- Bailey J, Lelijveld N, Marron B, Onyoo P, Ho LS, Manray M, et al. Combined protocol for acute malnutrition study (ComPAS) in rural South Sudan and urban Kenya: study protocol for a randomized controlled trial. Trials 2018;19(1):251. [DOI: 10.1186/s13063-018-2643-2; PMC5978994; PUBMED: 29690916] [DOI] [PMC free article] [PubMed] [Google Scholar]
- ISRCTN30393230. Combined protocol for acute malnutrition study (ComPAS) [Combined protocol for acute malnutrition study (ComPAS) ‐ effectiveness of a combined and simplified protocol for the treatment of acute malnutrition: a prospective, multi‐center cluster‐randomized controlled non‐inferiority trial in Kenya and South Sudan]. www.isrctn.com/ISRCTN30393230?q=&filters=recruitmentCountry:South%20Sudan&sort=&offset=1&totalResults=1&page=1&pageSize=10&searchType=basic‐search (first received 18 January 2017). [DOI: 10.1186/ISRCTN30393230] [DOI]
- Lelijveld N, Bailey J, Mayberry A, Trenouth L, N’Diaye DS, Haghparast‐Bidgoli H, et al. The "ComPAS Trial" combined treatment model for acute malnutrition: study protocol for the economic evaluation. Trials 2018;19(1):252. [DOI: 10.1186/s13063-018-2594-7; PMC5916722; PUBMED: 29690899] [DOI] [PMC free article] [PubMed] [Google Scholar]
ISRCTN31143316 {unpublished data only}
- ISRCTN31143316. Treatment of severe acute malnutrition delivered by community health workers in Niger [A cohort study comparing treatment for severe acute malnutrition (SAM) in children between 6‐59 months, delivered by community health workers (CHWs) compared to a traditional facility based model in Mayahi district, Niger]. www.isrctn.com/ISRCTN31143316 (first received 31 July 2018). [10.1186/ISRCTN31143316]
ISRCTN50039021 {published data only}
- ISRCTN50039021. Modelling an alternative nutrition protocol generalizable for outpatient (MANGO) [Modelling an alternative nutrition protocol generalizable for outpatient (MANGO) ‐ effectiveness of an optimized dosage of RUTF for the treatment of severe acute malnutrition: a randomized controlled, non‐inferiority trial in Burkina Faso]. www.isrctn.com/ISRCTN50039021 (first received 13 April 2016). [DOI: 10.1186/ISRCTN50039021] [DOI]
NCT00131417 {unpublished data only}
- NCT00131417. Ready to use therapeutic food in the rehabilitation of severely malnourished children [Comparison of the efficacy of a ready‐to‐use therapeutic food with a milk‐based diet in the rehabilitation of severely malnourished Ugandan children]. www.clinicaltrials.gov/ct2/show/NCT00131417 (first received 17 August 2005).
NCT00941434 {unpublished data only}
- NCT00941434. Community based management of malnutrition [Community based management of malnutrition. A proposal for Pakistan initiative for mothers and newborns]. www.clinicaltrials.gov/ct2/show/NCT00941434 (first received 16 July 2009).
NCT01144806 {unpublished data only}
- NCT01144806. Evaluation of energy expenditure, body composition and recovery rates in children with severe acute malnutrition [Evaluation of energy expenditure, body composition and recovery rates in children with severe acute malnutrition (SAM) receiving community‐based nutritional rehabilitation therapy]. www.clinicaltrials.gov/show/NCT01144806 (first received 15 June 2010).
NCT01331044 {published data only}
- NCT01331044. Ready to use therapeutic food (RUTF) in severe malnourished children (RUTF) [Efficacy and acceptability of ready to use therapeutic food (RUTF) in children aged 6‐24 months with severe acute malnutrition in Bangladesh]. clinicaltrials.gov/ct2/show/NCT01331044 (first received 6 April 2011).
NCT01634009 {unpublished data only}
- NCT01634009. Soy‐ready to use therapeutic food (RUTF) in severely malnourished children [Efficacy of ready to use therapeutic food using soy protein isolate in under‐5 children with severe acute malnutrition in Bangladesh]. www.clinicaltrials.gov/ct2/show/NCT01634009 (first received 12 June 2012).
NCT03094247 {published data only}
- NCT03094247. Feeding malnourished children different types of fatty acids to promote neurocognitive development [Improved polyunsaturated ready‐to‐use therapeutic food for improved neurocognitive outcomes in severe acute malnutrition]. clinicaltrials.gov/ct2/show/NCT03094247 (first received 23 March 2017).
NCT03407326 {unpublished data only}
- NCT03407326. Comparison of an alternative therapeutic food for the international food aid market to a standard ready‐to‐use therapeutic food (RUTF) for the treatment of severe acute malnutrition in children [Comparison of an alternative therapeutic food for the international food aid market to a standard ready‐to‐use therapeutic food (RUTF) for the treatment of severe acute malnutrition in children of the Western Rural Region and Pujehun District of Sierra Leone]. clinicaltrials.gov/ct2/show/NCT03407326 (first received 16 January 2018).
Additional references
Action Against Hunger 2009
- Action against hunger. Acute malnutrition: a preventable pandemic. www.actionagainsthunger.org/sites/default/files/publications/Acute_Malnutrition_A_Preventable_Pandemic_01.2009.pdf (accessed 20 May 2013).
Akparibo 2017
- Akparibo R, Harris J, Blank L, Campbell MJ, Holdsworth M. Severe acute malnutrition in children aged under 5 years can be successfully managed in a non‐emergency routine community healthcare setting in Ghana. Maternal & Child Nutrition 2017;13(4):e12417. [DOI: 10.1111/mcn.12417; MEDLINE: ] [DOI] [PMC free article] [PubMed] [Google Scholar]
Ashworth 2003
- Ashworth A, Khanum S, Jackson A, Schofield C. Guidelines for the inpatient treatment of severely malnourished children. www.who.int/nutrition/publications/guide_inpatient_text.pdf (accessed 2 November 2017).
Bachmann 2009
- Bachmann MO. Cost effectiveness of community‐based therapeutic care for children with severe acute malnutrition in Zambia: decision tree model. Cost Effectiveness and Resource Allocation 2009;7:2. [DOI: 10.1186/1478-7547-7-2; PMC2630929; PUBMED: 19146668] [DOI] [PMC free article] [PubMed] [Google Scholar]
Balhara 2017
- Balhara KS, Silvestri DM, Winders WT, Selvam A, Kivlehan SM, Becker TK, et al. Impact of nutrition interventions on pediatric mortality and nutrition outcomes in humanitarian emergencies: a systematic review. Tropical Medicine & International Health 2017;22(12):1464‐92. [DOI: 10.1111/tmi.12986; PUBMED: 28992388] [DOI] [PubMed] [Google Scholar]
Bazzano 2017
- Bazzano AN, Potts KS, Bazzano LA, Mason JB. The life course implications of ready to use therapeutic food for children in low‐income countries. International Journal of Environmental Research and Public Health 2017;14(4):403. [DOI: 10.3390/ijerph14040403; PMC5409604; PUBMED: 28398257] [DOI] [PMC free article] [PubMed] [Google Scholar]
Black 2008
- Black RE, Allen LH, Bhutta ZA, Caulfield LE, Onis M, Ezzati M, et al. Maternal and child undernutrition: global and regional exposures and health consequences. Lancet 2008;371(9608):243‐60. [DOI: 10.1016/S0140-6736(07)61690-0] [DOI] [PubMed] [Google Scholar]
Black 2013
- Black RE, Victora CG, Walker SP, Bhutta ZA, Christian P, Onis M, et al. Maternal and child undernutrition and overweight in low‐income and middle‐income countries. Lancet 2013;382(9890):427‐51. [DOI: 10.1016/S0140-6736(13)60937-X] [DOI] [PubMed] [Google Scholar]
Brewster 2006
- Brewster DR. Critical appraisal of the management of severe malnutrition: 2. Dietary management. Journal of Paediatrics and Child Health 2006;42(10):575‐82. [DOI: 10.1111/j.1440-1754.2006.00932.x; PUBMED: 16972962] [DOI] [PubMed] [Google Scholar]
Collins 2002
- Collins S, Sadler K. Outpatient care for severely malnourished children in emergency relief programmes: a retrospective cohort study. Lancet 2002;360(9348):1824‐30. [DOI: 10.1016/S0140-6736(02)11770-3] [DOI] [PubMed] [Google Scholar]
Collins 2003
- Collins S, Yates R. The need to update the classification of acute malnutrition. Lancet 2003;362(9379):249. [DOI: 10.1016/S0140-6736(03)13926-8; PUBMED: 12885498] [DOI] [PubMed] [Google Scholar]
Collins 2004
- Collins S, Henry J. Alternative RUTF formulations (special supplement 2). Community‐based Therapeutic Care 2004;Suppl 2:35. [www.ennonline.net/fex/102/4‐3‐2] [Google Scholar]
Collins 2006a
- Collins S, Dent N, Binns P, Bahwere P, Sadler K, Hallam A. Management of severe acute malnutrition in children. Lancet 2006;368(9551):1992‐2000. [DOI: 10.1016/S0140-6736(06)69443-9; PUBMED: 17141707] [DOI] [PubMed] [Google Scholar]
Collins 2006b
- Collins S, Sadler K, Dent N, Khara T, Guerrero S, Myatt M, et al. Key issues in the success of community‐based management of severe malnutrition. Food and Nutrition Bulletin 2006;27(Suppl 3):S49‐82. [DOI: 10.1177/15648265060273S304; PUBMED: 17076213] [DOI] [PubMed] [Google Scholar]
Covidence [Computer program]
- Veritas Health Innovation. Covidence. Version accessed 27 February 2019. Melbourne, Australia: Veritas Health Innovation.
DFID 2009
- Department for International Development (DFID). The Neglected Crisis of Undernutrition: Evidence for Action. London (UK): Department for International Development, 2009. [Google Scholar]
Fleet 2017
- Fleet A. Product specifications sheet: RUTF biscuit (BP100) (Version 2.0). www.unicef.org/supply/files/RUTF_Biscuit_BP‐100_UNICEF_specs.pdf (accessed 17 November 2017).
Frankenburg 1992
- Frankenburg W, Dodds J, Archer P, Shapiro H, Bresnick B. The Denver II: a major revision and restandardization of the Denver Developmental Screening Test. Pediatrics 1992;89(1):91‐7. [PubMed] [Google Scholar]
Gabouland 2007
- Gabouland V, Dan‐Bouzoua N, Brasher C, Fedida G, Gergonne B, Brown V. Could nutritional rehabilitation at home complement or replace centre‐based therapeutic feeding programmes for severe malnutrition?. Journal of Tropical Paediatrics 2007;53(1):49‐51. [DOI: 10.1093/tropej/fml052; PUBMED: 17030533] [DOI] [PubMed] [Google Scholar]
Garg 2018
- Garg CC, Mazumder S, Taneja S, Shekhar M, Mohan SB, Bose A, et al. Costing of three feeding regimens for home‐based management of children with uncomplicated severe acute malnutrition from a randomised trial in India. BMJ Global Health 2018;3:e000702. [DOI: 10.1136/bmjgh-2017-000702] [DOI] [PMC free article] [PubMed] [Google Scholar]
Gera 2010
- Gera T. Efficacy and safety of therapeutic nutrition products for home based therapeutic nutrition for severe acute malnutrition: a systematic review. Indian Pediatrics 2010;47(8):709‐18. [PUBMED: 20972288] [DOI] [PubMed] [Google Scholar]
Gera 2017
- Gera T, Pena‐Rosas JP, Boy‐Mena E, Sachdev HS. Lipid based nutrient supplements (LNS) for treatment of children (6 months to 59 months) with moderate acute malnutrition (MAM): a systematic review. PLoS One 2017;12(9):e0182096. [DOI: 10.1371/journal.pone.0182096; PMC5608196; PUBMED: 28934235] [DOI] [PMC free article] [PubMed] [Google Scholar]
GRADEPro GDT 2015 [Computer program]
- McMaster University (developed by Evidence Prime). GradePro GDT. Version (accessed 27 February 2019). Hamilton (ON): McMaster University (developed by Evidence Prime), 2015.
Greiner 2014
- Greiner T. Breastfeeding Briefs N° 56/57, September 2014. The advantages, disadvantages and risks of ready‐to‐use foods. ibfan.org/breastfeedingbreafs/BB%2056‐57‐The%20advantages‐disadvantages‐and‐risks‐of‐ready‐to‐use%20foods.pdf (accessed 4 August 2017).
Grellety 2000
- Grellety Y. Management of Severe Malnutrition in Africa [PhD thesis]. Aberdeen (UK): University of Aberdeen, 2000. [Google Scholar]
Guyatt 2011
- Guyatt G, Oxman AD, Akl EA, Kunz R, Vist G, Brozek J, et al. GRADE guidelines: 1. Introduction‐GRADE evidence profiles and summary of findings tables. Journal of Clinical Epidemiology 2011;64(4):383‐94. [DOI: 10.1016/j.jclinepi.2010.04.026; PUBMED: 21195583] [DOI] [PubMed] [Google Scholar]
Hamil 1979
- Hamill PV, Drizd TA, Johnson CL, Reed RB, Roche AF, Moore WM. Physical growth: National Center for Health Statistics percentiles. American Journal of Clinical Nutrition 1979;32(3):607‐29. [DOI: 10.1093/ajcn/32.3.607] [DOI] [PubMed] [Google Scholar]
Hawkes 2015
- Hawkes C, Haddad L, Udomkesmalee E, Co‐Chairs of the Independent Expert Group of the Global Nutrition Report. The Global Nutrition Report 2015: what we need to do to advance progress in addressing malnutrition in all its forms. Public Health Nutrition 2015;18(17):3067‐9. [DOI: 10.1017/S1368980015003158; PUBMED: 26551284] [DOI] [PMC free article] [PubMed] [Google Scholar]
Heikens 2008
- Heikens GT, Bunn J, Amadi B, Manary M, Chhagan M, Berkley JA, et al. Case management of HIV‐infected severely malnourished children: challenges in the area of highest prevalence. Lancet 2008;371(9620):1305‐7. [DOI: 10.1016/S0140-6736(08)60565-6; PUBMED: 18406865] [DOI] [PubMed] [Google Scholar]
Higgins 2002
- Higgins JP, Thompson SG. Quantifying heterogeneity in a meta‐analysis. Statistics in Medicine 2002;21(11):1539‐58. [DOI: 10.1002/sim.1186; PUBMED: 12111919] [DOI] [PubMed] [Google Scholar]
Higgins 2003
- Higgins JP, Thompson SG, Deeks JJ, Altman DG. Measuring inconsistency in meta‐analysis. BMJ 2003;327(7414):557‐60. [DOI: 10.1136/bmj.327.7414.557; PMC192859; PUBMED: 12958120] [DOI] [PMC free article] [PubMed] [Google Scholar]
Higgins 2011
- Higgins JP, Deeks JJ, Altman DG, editor(s). Chapter 16: Special topics in statistics. In: Higgins JPT, Green S, editor(s). Cochrane Handbook for Systematic Reviews of Interventions Version 5.1.0 (updated March 2011). The Cochrane Collaboration, 2011. Available from handbook.cochrane.org.
Higgins 2017
- Higgins JP, Altman DG, Sterne JA, editor(s). Chapter 8: Assessing risk of bias in included studies. In: Higgins JPT, Churchill R, Chandler J, Cumpston MS , editor(s). Cochrane Handbook for Systematic Reviews of Interventions version 5.2.0 (updated June 2017). Cochrane, 2017. Available from www.training.cochrane.org/handbook.
Hoffmann 2017
- Hoffmann TC, Oxman AD, Ioannidis JP, Moher D, Lasserson TJ, Tovey DI, et al. Enhancing the usability of systematic reviews by improving the consideration and description of interventions. BMJ 2017;357:j2998. [DOI: 10.1136/bmj.j2998; PUBMED: 28729459] [DOI] [PubMed] [Google Scholar]
Hoskens 2018
- Hoskens J, Klingels K, Smits‐Engelsman B. Validity and cross‐cultural differences of the Bayley Scales of Infant and Toddler Development, Third Edition in typically developing infants. Early Human Development 2018;25:17‐25. [DOI] [PubMed] [Google Scholar]
Iannotti 2015
- Iannotti LL, Trehan I, Clitheroe KL, Manary MJ. Diagnosis and treatment of severely malnourished children with diarrhoea. Journal of Paediatrics and Child Health 2015;51(4):387‐95. [DOI: 10.1111/jpc.12711; PUBMED: 25196813] [DOI] [PubMed] [Google Scholar]
Isanaka 2009
- Isanaka S, Nombela N, Djibo A, Poupard M, Beckhoven D, Gabouland V, et al. Effect of preventive supplementation with ready‐to‐use therapeutic food on the nutritional status, mortality, and morbidity of children aged 6 to 60 months in Niger: a cluster randomized trial. JAMA 2009;301(3):277‐85. [DOI: 10.1001/jama.2008.1018; PMC3144630; NCT00682708; PUBMED: 19155454] [DOI] [PMC free article] [PubMed] [Google Scholar]
Isanaka 2017
- Isanaka S, Menzies NA, Sayyad J, Ayoola M, Grais RF, Doyon S. Cost analysis of the treatment of severe acute malnutrition in West Africa. Maternal & Child Nutrition 2017;13(4):e12398. [DOI: 10.1111/mcn.12398; PUBMED: 27921381] [DOI] [PMC free article] [PubMed] [Google Scholar]
James 2015
- James PT, Briel N, Rozet A, Israël AD, Fenn B, Navarro‐Colorado C. Low‐dose RUTF protocol and improved service delivery lead to good programme outcomes in the treatment of uncomplicated SAM: a programme report from Myanmar. Maternal & Child Nutrition 2015;11(4):859‐69. [DOI: 10.1111/mcn; PMC4672709; PUBMED: 25850698] [DOI] [PMC free article] [PubMed] [Google Scholar]
Jayatissa 2012
- Jayatissa R, Bekele A, Kethiswaran A, Silva AH. Community‐based management of severe and moderate acute malnutrition during emergencies in Sri Lanka: challenges of implementation. Food and Nutrition Bulletin 2012;33(4):251‐60. [DOI: 10.1177/156482651203300405] [DOI] [PubMed] [Google Scholar]
Jones 2014
- Jones KD, Berkley JA. Severe acute malnutrition and infection. Paediatrics and International Child Health 2014;34(Suppl 1):1‐29. [DOI: 10.1179/2046904714Z.000000000218; PMC4266374; PUBMED: 25475887] [DOI] [PMC free article] [PubMed] [Google Scholar]
Kabalo 2017
- Kabalo MY, Seifu CN. Treatment outcomes of severe acute malnutrition in children treated within Outpatient Therapeutic Program (OTP) at Wolaita Zone, Southern Ethiopia: retrospective cross‐sectional study. Journal of Health, Population and Nutrition 2017;36(1):7. [DOI: 10.1186/s41043-017-0083-3; PMC5345228; PUBMED: 28279227] [DOI] [PMC free article] [PubMed] [Google Scholar]
Kassebaum 2017
- The Global Burden of Disease Child and Adolescent Health Collaboration. Child and adolescent health from 1990 to 2015 findings from the Global Burden of Diseases, Injuries, and Risk factors 2015 study. JAMA Pediatrics 2017;171(6):573‐92. [DOI: 10.1001/jamapediatrics.2017.0250; PMC5540012; PUBMED: 28384795] [DOI] [PMC free article] [PubMed] [Google Scholar]
Komrska 2010a
- Komrska J. UNICEF requirements for RUTF manufacturers. www.unicef.org/supply/files/Technical_Requirements_for_RUTF_Manufacturers.pdf (accessed 4 August 2017).
Komrska 2010b
- Komrska J. Overview of UNICEF’s RUTF procurement in 2010 and past years. www.unicef.org/supply/files/Overview_of_UNICEF_RUTF_Procurement_in_2010.pdf (accessed 4 August 2017).
Kruger 2008
- Kruger HS, Hendricks M, Puoane T. Nutritional management of multiple nutrient deficiencies. In: Steyn NP, Temple NJ editor(s). Community Nutrition Textbook for South Africa: A Rights‐Based Approach. Tygerberg (ZA): Chronic Diseases of Lifestyle Unit, Medical Research Council, 2008:674‐9. [Google Scholar]
Lazzerini 2012
- Lazzerini M, Rubert L, Ronfani L, Pani P, Montico M. Specially formulated foods for treating children with acute moderate malnutrition in low‐ and middle‐income countries. Cochrane Database of Systematic Reviews 2012, Issue 1. [DOI: 10.1002/14651858.CD009584] [DOI] [PubMed] [Google Scholar]
Lazzerini 2013
- Lazzerini M, Rubert L, Pani P. Specially formulated foods for treating children with moderate acute malnutrition in low‐ and middle‐income countries. Cochrane Database of Systematic Reviews 2013, Issue 6. [DOI: 10.1002/14651858.CD009584.pub2; PUBMED: 23794237] [DOI] [PubMed] [Google Scholar]
Lenters 2013
- Lenters LM, Wazny K, Webb P, Ahmed T, Bhutta ZA. Treatment of severe and moderate acute malnutrition in low‐ and middle‐income settings: a systematic review, meta‐analysis and Delphi process. BMC Public Health 2013;13(Suppl 3):S23. [DOI: 10.1186/1471-2458-13-S3-S23; PMC3847503 ; PUBMED: 24564235] [DOI] [PMC free article] [PubMed] [Google Scholar]
Lin 2008
- Lin CA, Manary MJ, Maleta K, Briend A, Ashorn P. An energy‐dense complementary food is associated with a modest increase in weight gain when compared with a fortified porridge in Malawian children aged 8‐18 months. Journal of Nutrition 2008;138(3):593‐8. [DOI: 10.1093/jn/138.3.593] [DOI] [PubMed] [Google Scholar]
Manary 2006
- Manary MJ. Local production and provision of ready‐to‐use therapeutic food (RUTF) spread for the treatment of severe childhood malnutrition. Food and Nutrition Bulletin 2006;27(3 Suppl):S83‐9. [DOI: 10.1177/15648265060273S305; PUBMED: 17076214] [DOI] [PubMed] [Google Scholar]
Manary 2008
- Manary MJ, Sandige HL. Management of acute moderate and severe childhood malnutrition. BMJ 2008;337:a2180. [DOI: 10.1136/bmj.a2180; PUBMED: 19008271] [DOI] [PubMed] [Google Scholar]
Manary 2016
- Manary M, Callaghan M, Singh L, Briend A. Protein quality and growth in malnourished children. Food and Nutrition Bulletin 2016;37(Suppl 1):S29‐36. [DOI: 10.1177/0379572116629023; PUBMED: 26857118] [DOI] [PubMed] [Google Scholar]
Mody 2014
- Mody A, Bartz S, Hornik CP, Kiyimba T, Bain J, Muehlbauer M, et al. Effects of HIV infection on the metabolic and hormonal status of children with severe acute malnutrition. PLoS One 2014;9(7):e102233. [DOI: 10.1371/journal.pone.0102233; PMC4106836; PUBMED: 25050734] [DOI] [PMC free article] [PubMed] [Google Scholar]
Moher 2009
- Moher D, Liberati A, Tetzlaff J, Altman DG, the PRISMA Group. Preferred reporting items for systematic reviews and meta‐analyses: the PRISMA Statement. Annals of Internal Medicine 2009;151:264‐9. [DOI] [PubMed] [Google Scholar]
Moss 2006
- Moss WJ, Ramakrishnan M, Storms D, Henderson Siegle A, Weiss WM, Lejnev I, et al. Child health in complex emergencies. Bulletin of the World Health Organization 2006;84:58‐64. [www.who.int/hac/techguidance/pht/Child_health_in_emergencies.pdf] [DOI] [PMC free article] [PubMed] [Google Scholar]
Naude 2008
- Naude CE, Labuschange IL, Labadarios D. Nutritional management of HIV/AIDS and TB. In: Steyn NP, Temple NJ editor(s). Community Nutrition Textbook for South Africa: A Rights‐Based Approach. Tygerberg (ZA): Chronic Diseases of Lifestyle Unit, Medical Research Council, 2008:751‐94. [Google Scholar]
Puett 2013
- Puett C, Sadler K, Alderman H, Coates J, Fiedler JL, Myatt M. Cost‐effectiveness of the community‐based management of severe acute malnutrition by community health workers in southern Bangladesh. Health Policy and Planning 2013;28(4):386‐99. [DOI: 10.1093/heapol/czs070; PUBMED: 22879522] [DOI] [PubMed] [Google Scholar]
Review Manager 2014 [Computer program]
- Nordic Cochrane Centre, The Cochrane Collaboration. Review Manager 5 (RevMan 5). Version 5.3. Copenhagen: Nordic Cochrane Centre, The Cochrane Collaboration, 2014.
Rogers 2018
- Rogers E, Martínez K, Morán JL, Alé FG, Charle P, Guerrero S, et al. Cost‐effectiveness of the treatment of uncomplicated severe acute malnutrition by community health workers compared to treatment provided at an outpatient facility in rural Mali. Human Resources for Health 2018;16(1):12. [DOI: 10.1186/s12960-018-0273-0; PMC5819265; PUBMED: 29458382] [DOI] [PMC free article] [PubMed] [Google Scholar]
Sanghvi 2014
- Sanghvi J, Mehta S, Kumar R. Predicators for weight gain in children treated for severe acute malnutrition: a prospective study at nutritional rehabilitation center. ISRN Pediatrics 2014;2014:808756. [DOI: 10.1155/2014/808756; PMC3972911; PUBMED: 25006491] [DOI] [PMC free article] [PubMed] [Google Scholar]
Seal 2007
- Seal A, Kerac M. Operational implications of using 2006 World Health Organization growth standards in nutrition programmes: secondary data analysis. BMJ 2007;334:733‐8. [DOI: 10.1136/bmj.39101.664109.AE] [DOI] [PMC free article] [PubMed] [Google Scholar]
Segré 2017
- Segrè J, Liu G, Komrska J. Local versus offshore production of ready‐to‐use therapeutic foods and small quantity lipid‐based nutrient supplements. Maternal & Child Nutrition 2017;13(4):e12376. [DOI: 10.1111/mcn.12376; PUBMED: 27863004] [DOI] [PMC free article] [PubMed] [Google Scholar]
Shea 2017
- Shea BJ, Reeves BC, Wells G, Thuku M, Hamel C, Moran J, et al. AMSTAR 2: a critical appraisal tool for systematic reviews that include randomised or non‐randomised studies of healthcare interventions, or both. BMJ 2017;358:j4008. [DOI: 10.1136/bmj.j4008] [DOI] [PMC free article] [PubMed] [Google Scholar]
Shewade 2017 [pers comm]
- Shewade HD. CTRI/2013/02/003418 [personal communication]. Email to: A Schoonees 1 August 2017.
Simpore 2006
- Simpore J, Kabore F, Zongo F, Dansou D, Bere A, Pignatelli S, et al. Nutrition rehabilitation of undernourished children utilizing Spiruline and Misola. Nutrition Journal 2006;5:3. [DOI: 10.1186/1475-2891-5-3; PMC1386687; PUBMED: 16430775] [DOI] [PMC free article] [PubMed] [Google Scholar]
Sinclair 2012
- Sinclair D, Donegan S, Isba R, Lalloo DG. Artesunate versus quinine for treating severe malaria. Cochrane Database of Systematic Reviews 2012, Issue 6. [DOI: 10.1002/14651858.CD005967.pub4; PUBMED: 22696354] [DOI] [PMC free article] [PubMed] [Google Scholar]
Sterne 2017
- Sterne JA, Egger M, Moher D, Boutron I (editors). Chapter 10: Addressing reporting biases. In: Higgins JPT, Churchill R, Chandler J, Cumpston MS (editors), Cochrane Handbook for Systematic Reviews of Interventions version 5.2.0 (updated June 2017), Cochrane, 2017. Available from www.training.cochrane.org/handbook.
Tekeste 2012
- Tekeste A, Wondafrash M, Azene G, Deribe K. Cost effectiveness of community‐based and in‐patient therapeutic feeding programs to treat severe acute malnutrition in Ethiopia. Cost Effectiveness and Resource Allocation 2012;10:4. [DOI: 10.1186/1478-7547-10-4; PMC3323427; PUBMED: 22429892] [DOI] [PMC free article] [PubMed] [Google Scholar]
Trehan 2015
- Trehan I, Manary MJ. Management of severe acute malnutrition in low‐income and middle‐income countries. Archives of Disease in Childhood 2015;100(3):283‐7. [DOI: 10.1136/archdischild-2014-306026; PUBMED: 25421910] [DOI] [PubMed] [Google Scholar]
UNICEF 2013a
- United Nations Children’s Fund (UNICEF). Improving child nutrition: the achievable imperative for global progress. www.unicef.org/publications/files/Nutrition_Report_final_lo_res_8_April.pdf (accessed 1 August 2018).
UNICEF 2013b
- United Nations Children's Fund (UNICEF). Ready‐to‐use therapeutic food for children with severe acute malnutrition. www.unicef.org/media/files/Current_Issues_Paper_‐_Ready_To_Use_Therapeutic_Food.pdf (accessed 4 August 2017).
UNICEF 2013c
- United Nations Children's Fund (UNICEF) Evaluation Office. Evaluation of community management of acute malnutrition: global synthesis report. www.unicef.org/evaldatabase/files/Final_CMAM_synthesis_FINAL_VERSION_with_ExSum_translations.pdf (accessed 11 August 2017).
UNICEF 2015a
- United Nations Children’s Fund (UNICEF). Management of severe acute malnutrition in children: working towards results at scale. www.childrenandaids.org/sites/default/files/2017‐05/SAM%20Guidance.pdf (accessed 4 August 2017).
UNICEF 2015b
- United Nations Children’s Fund (UNICEF) Supply Division. Ready‐to‐use therapeutic food demand. www.unicef.org/supply/files/UNICEF_RUTF_Demand.pdf (accessed 11 August 2017).
UNICEF/WHO/WBG 2017
- United Nations Children’s Fund, World Health Organization, World Bank Group. Levels and trends in child malnutrition. www.who.int/nutgrowthdb/jme_brochoure2017.pdf?ua=1 (accessed 4 August 2017).
Weber 2016
- Weber J, Callaghan M. Optimizing ready‐to‐use therapeutic foods for protein quality, cost, and acceptability. Food and Nutrition Bulletin 2016;37(Suppl 1):S37‐46. [DOI: 10.1177/0379572116629257; PUBMED: 26864957] [DOI] [PubMed] [Google Scholar]
WHO 2006
- World Health Organization. The WHO child growth standards. www.who.int/childgrowth/en/ (accessed 30 November 2017).
WHO 2008
- World Health Organization (WHO). Training course on child growth assessment: WHO child growth standards. www.who.int/childgrowth/training/module_c_interpreting_indicators.pdf (accessed 8 November 2017).
WHO 2012
- World Health Organization (WHO). Technical note: supplementary foods for the management of moderate acute malnutrition in infants and children 6–59 months of age. apps.who.int/iris/bitstream/10665/75836/1/9789241504423_eng.pdf?ua=1&ua=1 (accessed 4 August 2017).
WHO 2013
- World Health Organization (WHO). Guideline: updates on the management of severe acute malnutrition in infants and children. apps.who.int/iris/bitstream/10665/95584/1/9789241506328_eng.pdf (accessed 18 September 2017). [PubMed]
WHO 2017a
- World Health Organization (WHO). Ambition and action in nutrition 2016–2025. www.who.int/nutrition/publications/nutrition‐strategy‐2016to2025/en/ (accessed 11 August 2017).
WHO 2017b
- World Health Organization (WHO). Management of severe acute malnutrition in infants and children. www.who.int/elena/titles/full_recommendations/sam_management/en/ (accessed 8 November 2017). [PubMed]
WHO/UNICEF 2009
- World Health Organization, United Nations Children's Fund. WHO child growth standards and the identification of severe acute malnutrition in infants and children: a joint statement. www.who.int/nutrition/publications/severemalnutrition/9789241598163/en/index.html (accessed 20 May 2013). [PubMed]
WHO/WFP/UNSCN/UNICEF 2007
- World Health Organization, World Food Programme, United Nations System Standing Committee on Nutrition (UNSCN), United Nations Children's Fund (UNICEF). Community‐based management of severe acute malnutrition. www.who.int/nutrition/topics/Statement_community_based_man_sev_acute_mal_eng.pdf (accessed 20 May 2013).
Wilford 2012
- Wilford R, Golden K, Walker DG. Cost‐effectiveness of community‐based management of acute malnutrition in Malawi. Health Policy and Planning 2012;27(2):127‐37. [DOI: 10.1093/heapol/czr017; PUBMED: 21378101] [DOI] [PubMed] [Google Scholar]
References to other published versions of this review
Schoonees 2011
- Schoonees A, Lombard M, Nel E, Volmink J. Ready‐to‐use therapeutic food for treating undernutrition in children from 6 months to 5 years of age. Cochrane Database of Systematic Reviews 2011, Issue 2. [DOI: 10.1002/14651858.CD009000] [DOI] [Google Scholar]
Schoonees 2013
- Schoonees A, Lombard M, Musekiwa A, Nel E, Volmink J. Ready‐to‐use therapeutic food for home‐based treatment of severe acute malnutrition in children from six months to five years of age. Cochrane Database of Systematic Reviews 2013, Issue 6. [DOI: 10.1002/14651858.CD009000.pub2] [DOI] [PMC free article] [PubMed] [Google Scholar]