Abstract
Background: Accumulating evidence has demonstrated that single nucleotide polymorphisms (SNPs) in microRNAs (miRNAs) (referred to as miR-SNPs) participate in the process of carcinogenesis by altering the expression and structure of mature miRNAs. However, the associations between several previously reported miR-SNPs, including miR-196a2 rs11614913, miR-146a rs2910164, miR-34b/c rs4938723, and miR-423 rs6505162 and the susceptibility of esophageal squamous cell carcinoma (ESCC) remain controversial. We, therefore, performed a comprehensive meta-analysis to systemically evaluate the correlation of genetic polymorphisms in these four miRNAs with the risk of ESCC.
Methods: Relevant studies were searched in PubMed and other electronic databases up to August 2018, supplemented by a manual search of references from retrieved articles. The pooled ORs with 95% CIs were calculated using a random-effects model.
Results: A total of 22 studies from 13 published articles were included in the meta-analysis. All studies have a relatively high score of quality assessment. The pooled analysis indicated that individuals with the variant TT genotype of rs11614913 in miR-196a2 gene have a significantly decreased risk of ESCC compared with CC genotype (OR =0.83, 95% CI: 0.73–0.95). The decreased risk of ESCC was also shown in the recessive model (TT vs CT/CC: OR=0.86, 95%CI: 0.77–0.96) and allele model (T vs C: OR=0.93, 95%CI: 0.87–0.99). The significantly reduced risk of ESCC was also observed in the polymorphisms of the miR-34b/c rs4938723 locus. The similar tendency was presented in the subgroup of Chinese Han population when stratified by ethnicity. However, no significant associations were observed in the miR-146a rs2910164 and miR-423 rs6505162 with the susceptibility of ESCC in any genetic model.
Conclusion: Our results suggested that the polymorphisms of miR-196a and miR-34b/c genes were related to the risk of ESCC, especially among Chinese. The findings of this study, however, need to be confirmed in further researches.
Keywords: microRNA, single nucleotide polymorphism, ESCC, meta-analysis
Introduction
Esophageal cancer is one of the most common malignancies in the world. It ranks the seventh in terms of incidence (572,000 new cases) and the sixth in mortality overall (509,000 deaths) in 2018.1 Esophageal squamous cell carcinoma (ESCC) accounts for over 90% of all esophageal cancer cases in lower income countries, especially in parts of Asia.1 The 5-year survival rate of ESCC patients is less than 15%.2 However, patients diagnosed at earlier stages have better outcomes than those diagnosed latterly.3 Therefore, to identify and treat ESCC at early stages may continue to be the most effective strategy for improving patient survival. Thus, screening patients who are at high risk and identifying more efficient risk predicting factors for ESCC are urgently needed.
Single nucleotide polymorphisms (SNPs) have been found to be associated with the risk of ESCC in different areas and populations, indicating that specific SNPs may affect the susceptibility to ESCC and potentially be used as biomarkers of ESCC.4–6 MicroRNAs (miRNA) are involved in a variety of biological and pathologic processes including cell differentiation, proliferation, apoptosis, and metabolism, and are emerging as highly tissue-specific biomarkers with potential clinical applicability for defining cancer types and origins.7–10 Furthermore, accumulating evidence showed that specific SNPs in miRNA genes (miR-SNPs) can influence the function of the corresponding miRNA by modulating the transcription of the primary transcript, the pri-miRNA and pre-miRNA processing and maturation, and miRNA–mRNA interactions and thereby affect the risk of developing cancer.11,12 Therefore, investigations into the genetic variations of miRNAs involved in ESCC may provide new insights into the pathogenesis and help in finding novel biomarkers of this disease.
Recently, several research groups have reported the relationship of miR-SNPs with the risk of esophageal cancer.13–25 However, the results of these studies were controversial and inconclusive. For example, three studies reported that TT genotype in rs11614913/miR-196a2 might contribute to ESCC susceptibility in the Chinese population,14,19,23 whereas the other two studies showed different results.17,20 For the SNP rs4938723 in miR-34b/c, two articles reported that CC genotype and C allele could decrease the risk of ESCC.21,24 However, another two studies found different results.18,22 Therefore, we conducted this meta-analysis in order to comprehensively analyze the associations between the SNPs in four ESCC-involving miRNAs, including miR-196a2 rs11614913, miR-146a rs2910164, miR-34b/c rs4938723, and miR-423 rs6505162, and the susceptibility to ESCC and to evaluate their potential as a risk-predicting biomarker for ESCC.
Methods
Search strategy
To identify all potentially eligible studies, we performed a comprehensive literature search in National Library of Medicine (PubMed), ISI Web of Science databases, Wiley, Embase, the Cochrane Library, Google Scholar, Controlled Trials metaRegister, China National Knowledge Infrastructure (CNKI) and Chinese Wanfang databases until August 15th, 2018 with language limited to English. The following keywords were used for literature retrieval: “esophageal cancer OR esophageal neoplasms OR esophageal squamous cell carcinoma OR esophageal adenocarcinoma” AND “polymorphism or variation OR susceptibility” and “microRNA OR miRNA OR microRNAs”. We also manually screened the references of eligible articles and reviewed articles for other related studies. This study was performed in accordance with the PRISMA statement checklist (S1 PRISMA checklist).
Inclusion and exclusion criteria
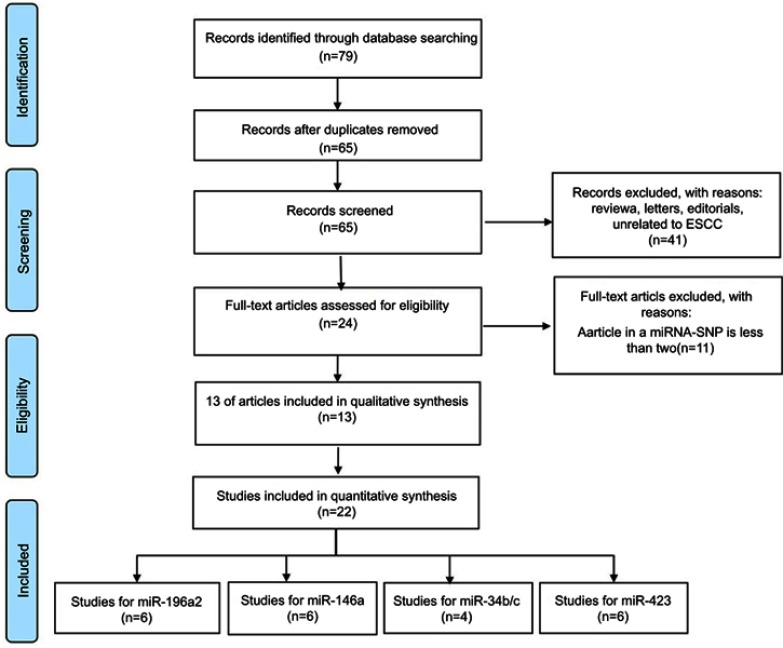
Studies were included in the meta-analysis only if they met all of the following criteria: (1) an evaluation of the association between the polymorphisms of miR-196a2 rs11614913, miR-146a rs2910164, miR-34b/c rs4938723 and miR-423 rs6505162 locus and ESCC susceptibility (with full text); (2) a case-control study; (3) detailed genotype data were available for calculating ORs and the corresponding 95% CI; and (4) the genotype distribution of the studies had to be consistent with a Hardy–Weinberg equilibrium (HWE) in the control group (P>0.05). Articles were excluded for the reasons indicated in Figure 1. Two authors independently assessed all retrieved studies based on the inclusion and exclusion criteria. Any disagreement was resolved through discussion or consultation with a third author.
Figure 1.
The process of study selection.
Abbreviations: ESCC, esophageal squamous cell carcinoma; SNPs, single nucleotide polymorphisms; miRNAs, microRNAs.
Data extraction and quality assessment
The following information from each publication was independently extracted by two authors: the first author’s last name, year of publication, ethnicity, genotyping methods, the source of the control group, sample size and genotype frequency.
The quality of the included studies was evaluated independently by two investigators using the Newcastle-Ottawa scale (NOS).26,27 The NOS criterion is divided into three categories: (1) subject selection; (2) the comparability of the subject; (3) exposure. The total score is nine, a study scored from zero to four is classified as low-quality, from five to six is classified as moderate-quality and from seven to nine is considered as a high-quality study. The moderate- and high-quality studies were included in the meta-analysis. Any disagreement was resolved by discussion before any final decision was made.
Statistical analysis
The strength of association between miR-SNPs and ESCC susceptibility was analyzed by the pooled OR with its 95% CI based on different gene models. There are five common genetic models including allele model (W vs V) (W for the wild allele, V for variation allele), heterozygote model (WV vs WW), homozygote model (VV vs WW), dominant model (WV+VV vs WW), and recessive model (VV vs WW+WV). A χ2-based Cochran’s Q test and I2 statistics were used to assess the heterogeneity among studies.28,29 If there were significant heterogeneities among studies (P<0.1 or I2>50%), the random effect model was used for calculation of pooled OR value. Otherwise, the fixed effect model was used. The significance of the pooled OR was determined by the Z test, a P<0.05 was considered significant. Moreover, a sensitivity analysis was used to assess the stability of the results. Subgroup analyses were performed to explore the potential heterogeneity among the included studies. Finally, publication bias was investigated by Begg’s funnel plot and Egger’s linear regression test. All statistical analyses in this meta-analysis were performed with STATA version 14.0 (Stata Corporation, College Station, TX, USA). All P-values were two-sided.
Trial sequential analysis
Trial sequential analysis (TSA) was performed as described by the user manual using the TSA software version 0.9.5.10 Beta (www.ctu.dk/TSA). After adopting a level of significance at 5% for type I error, 20% for type II error and a relative risk reduction (RRR) assumption of 10%, the required information size was calculated and TSA monitoring boundaries were built.
RNA secondary structure analysis
The RNAfold Web Server was used to analyze the potential secondary structure modification caused by the mutant allele of miRNAs polymorphisms (http://rna.tbi.univie.ac.at/cgi-bin/RNAWebSuite/RNAfold.cgi).30,31
Results
Characteristics of the included studies
The literature search process of this meta-analysis is shown in Figure 1. Seventy-nine articles were retrieved by the online and manual search, and 65 abstracts were remains after removing duplicate studies. The title and abstract of the studies were then screened, and the full text of remaining articles was read. Finally, thirteen published articles were included in this meta-analysis (Table 1).13–25
Table 1.
Characteristics of the included literature in this meta-analysis
| First author | Year | Ethnicity | Genotyping methods | Source of control | Sample size cases/controls | Genotypes distribution of cases and controls | NOS | ||
|---|---|---|---|---|---|---|---|---|---|
| miR-196a2 rs11614913 | |||||||||
| TT | TC | CC | |||||||
| Shen et al. | 2016 | Chinese Han | SNaPshot assay | HB | 1400/2185 | 407/672 | 698/1121 | 295/392 | 7 |
| Wang et al. | 2014 | Chinese Han | PCR-LDR | PB | 597/597 | 162/154 | 307/298 | 128/145 | 8 |
| Qu et al. | 2014 | Chinese Han | PCR-RFLP | PB | 381/426 | 48/82 | 207/211 | 126/133 | 8 |
| Umar et al. | 2013 | Indian | PCR-RFLP | HB | 289/309 | 146/171 | 121/171 | 22/16 | 7 |
| Wei et al. | 2013 | Chinese Han | SNPscan | HB | 380/380 | 106/113 | 196/170 | 65/87 | 7 |
| Wang et al. | 2010 | Chinese Han | SNaPshot assay | HB | 458/489 | 148/128 | 262/250 | 48/111 | 7 |
| miR-146a rs2910164 | |||||||||
| CC | GC | GG | |||||||
| Shen et al. | 2016 | Chinese Han | SNaPshot assay | PB | 1400/2185 | 220/345 | 685/1060 | 495/780 | 7 |
| Zhu et al. | 2015 | Chinese Kazakh | MALDI-TOF MS | HB | 248/300 | 82/99 | 120/139 | 36/40 | 7 |
| Qu et al. | 2014 | Chinese Han | PCR-RFLP | PB | 381/426 | 116/123 | 203/228 | 62/75 | 8 |
| Umar et al. | 2013 | Indian | PCR-RFLP | HB | 289/309 | 146/171 | 121/122 | 22/16 | 7 |
| Wei et al. | 2013 | Chinese Han | SNPscan | HB | 380/380 | 117/122 | 184/181 | 67/67 | 7 |
| Guo et al. | 2010 | Chinese Han | SNaPshot assay | HB | 444/468 | 234/206 | 190/220 | 20/42 | 7 |
| miR-34b/c rs4938723 | |||||||||
| TT | TC | CC | |||||||
| Bulibu et al. | 2017 | Chinese Han | DHPLC | HB | 175/186 | 64/52 | 74/81 | 37/53 | 8 |
| Zhu et al. | 2015 | Chinese Kazakh | MALDI-TOF MS | HB | 248/300 | 113/122 | 99/122 | 25/30 | 7 |
| Zhang et al. | 2014 | Chinese Han | SNaPshot assay | PB | 1109/1275 | 489/569 | 536/573 | 84/133 | 8 |
| Yin et al. | 2013 | Chinese Han | PCR-LDR | HB | 629/686 | 277/310 | 278/290 | 45/73 | 7 |
| miR-423 rs6505162 | |||||||||
| CC | CA | AA | |||||||
| Nariman-Saleh-Fam et al. | 2017 | Iran Caucasian | PCR-RFLP | HB | 200/300 | 141/110 | 123/81 | 36/9 | 7 |
| Shen et al. | 2016 | Chinese Han | SNaPshot assay | PB | 1400/2185 | 920/1421 | 421/680 | 59/84 | 7 |
| Zhu et al. | 2015 | Chinese Kazakh | MALDI-TOF MS | HB | 248/300 | 99/109 | 122/140 | 21/31 | 7 |
| Umar et al. | 2013 | Indian | PCR-RFLP | HB | 289/309 | 90/96 | 132/143 | 67/70 | 7 |
| Wang et al. | 2013 | Africa Black | TaqMan | PB | 565/1000 | 16/12 | 128/184 | 207/376 | 8 |
| Yin et al. | 2013 | Chinese Han | PCR-LDR | HB | 629/686 | 374/425 | 197/207 | 29/19 | 7 |
Abbreviations: HB, hospital-based; PB, population-based DHPLC, denaturing high-performance liquid chromatography; MALDI-TOF MS, Matrix-Assisted Laser Desorption/Ionization Time of Flight Mass Spectrometry; PCR-LDR, Polymerase Chain Reaction ligase detection reaction; PCR-RFLP, Polymerase Chain Reaction restriction fragment length polymorphism NOS, Newcastle-Ottawa scale.
In total, 22 studies from 13 articles covering 4 types of miR-SNPs were included in this meta-analysis. Among the 22 studies, 17 studies were conducted in China, 3 in India, 1 in Iran and 1 in Africa. All of the studied miR-SNPs fulfilled the HWE (P>0.05).
The quality of the included articles was assessed by the NOS scores (Table S1). Overall, all the included studies had a high quality (Table 1).
Table S1.
The Newcastle-Ottawa Scale (NOS) for assessing the quality of studies in the meta-analyses
| Studies | Selection | Comparability | Exposure | Total quality score | |||||
|---|---|---|---|---|---|---|---|---|---|
| Author, year | Is the case definition adequate? | Representativenessof the cases | Selection of controls | Definition of controls | Comparability of cases and controls | Ascertainment of exposure | Same method of ascertainment for cases and controls | Non-response rate | |
| Nariman-Saleh-Fam et al, 201713 | * | * | * | ** | * | * | 7 | ||
| Bulibu et al, 201712 | * | * | * | * | ** | * | * | 8 | |
| Shen et al, 201611 | * | * | * | ** | * | * | 7 | ||
| Zhu et al, 201510 | * | * | * | ** | * | * | 7 | ||
| Zhang et al, 20149 | * | * | * | * | ** | * | * | 8 | |
| Wang et al, 20148 | * | * | * | * | ** | * | * | 8 | |
| Qu et al, 20147 | * | * | * | * | ** | * | * | 8 | |
| Wang et al, 20134 | * | * | * | * | ** | * | * | 8 | |
| Wei et al, 20135 | * | * | * | ** | * | * | 7 | ||
| Yin et al, 20136 | * | * | * | ** | * | * | 7 | ||
| Umar et al, 20133 | * | * | * | ** | * | * | 7 | ||
| Guo et al, 20101 | * | * | * | ** | * | * | 7 | ||
| Wang et al, 20102 | * | * | * | ** | * | * | 7 | ||
The associations between miRNA polymorphisms and ESCC risk
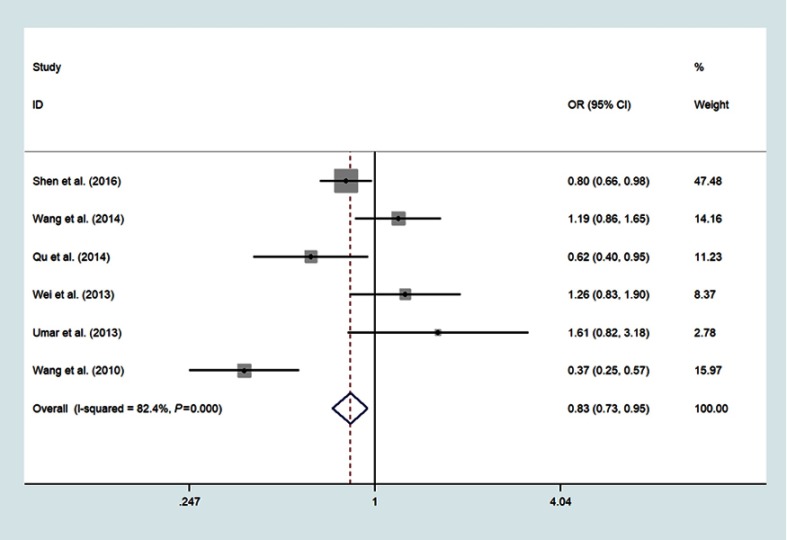
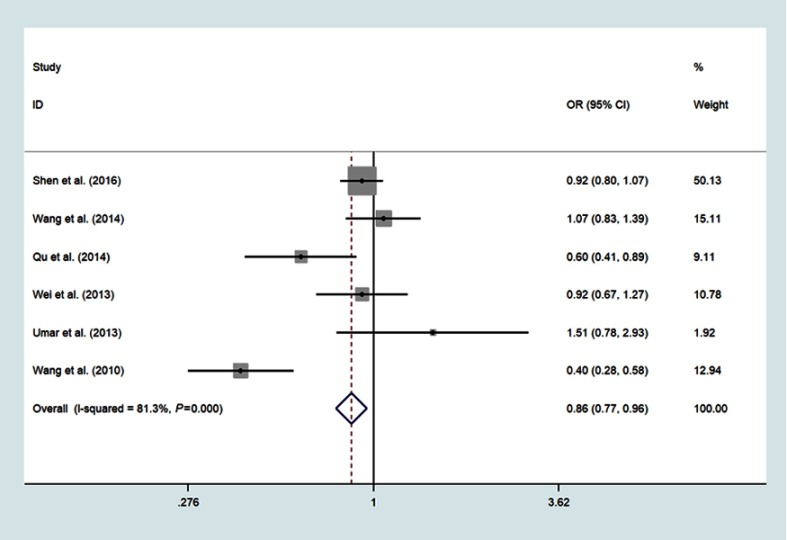
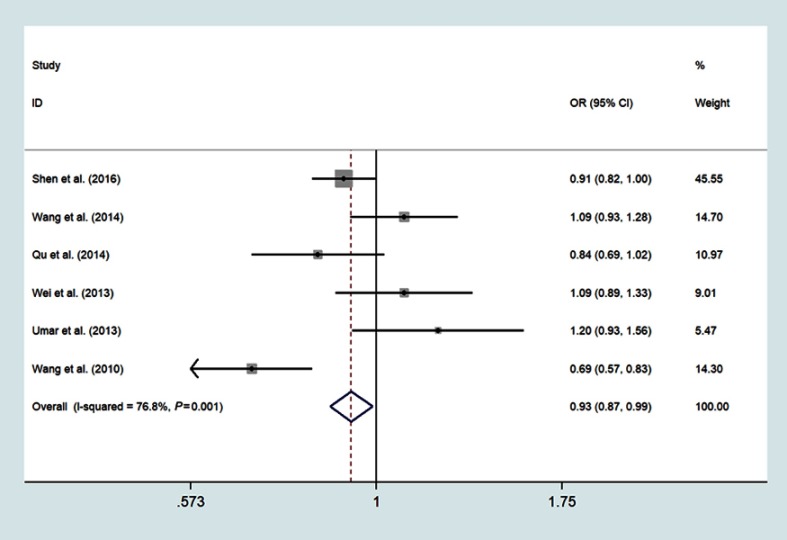
Six studies involving 3505 cases and 4386 controls investigated the association between miR-196a2 rs11614913 T>C variant and ESCC susceptibility;14,15,17,19,20,23 The meta-analysis results were summarized in Table 2. The pooled analysis indicated that individuals with the variant TT genotype have a significantly decreased risk of ESCC compared with CC genotype (OR =0.83, 95% CI: 0.73–0.95, P=0.006, I2=82.4%) (Figure 2). The decreased risk of ESCC was also found in the recessive model (TT vs CT/CC: OR=0.86, 95%CI: 0.77–0.96, P=0.005, I2=81.3%) (Figure 3) and allele model (T vs C: OR=0.93, 95%CI: 0.87–0.99, P=0.021, I2=76.8%) (Figure 4)
Table 2.
Meta-analysis of the association between miR-196a2 rs11614913 and esophageal cancer risk
| miR-196a2 | N | T/C | TT/CC | CT/CC | TT+CT/CC | TT/CT+CC | |||||
|---|---|---|---|---|---|---|---|---|---|---|---|
| OR (95%CI) | P | OR (95%CI) | P | OR (95%CI) | P | OR (95%CI) | P | OR (95%CI) | P | ||
| Overall | 6 | 0.93(0.87–0.99) | 0.021 | 0.83(0.73–0.95) | 0.006 | 1.00(0.90–1.12) | 0.92 | 0.95(0.85–1.05) | 0.319 | 0.86(0.77–0.96) | 0.005 |
| Ethnicity | |||||||||||
| Chinese Han | 5 | 0.91(0.85–0.97) | 0.006 | 0.81(0.71–0.93) | 0.002 | 1.04(0.84–1.27) | 0.738 | 0.92(0.82–1.03) | 0.143 | 0.85(0.76–0.94) | 0.002 |
| Indian | 1 | 1.20(0.93–1.56) | 0.157 | 1.61(0.82–3.18) | 0.170 | 1.16(0.83–1.62) | 0.380 | 1.21(0.88–1.67) | 0.238 | 1.51(0.78–2.93) | 0.225 |
| Genotyping methods | |||||||||||
| PCR-LDR | 2 | 0.95(0.88–1.03) | 0.323 | 0.89(0.76–1.06) | 0.187 | 0.91(0.78–1.06) | 0.230 | 0.91(0.79–1.05) | 0.182 | 0.96 (0.84–1.09) | 0.501 |
| PCR-RFLP | 2 | 0.96(0.82–1.12) | 0.617 | 0.82(0.57–1.17) | 0.264 | 1.09(0.87–1.37) | 0.448 | 1.05(0.80–1.29) | 0.700 | 0.76(0.55–1.06) | 0.106 |
| SNPscan | 1 | 1.09(0.89–1.34) | 0.424 | 1.26(0.83–1.90) | 0.284 | 1.54(1.05–2.26) | 0.026 | 1.42(0.99–2.04) | 0.052 | 0.92(0.67–1.26) | 0.622 |
| SNaPshot assay | 1 | 0.68(0.57–0.82) | <0.001 | 0.37(0.25–0.57) | <0.001 | 0.90(0.67–1.22) | 0.511 | 0.74(0.56–0.98) | 0.038 | 0.39(0.27–0.57) | <0.001 |
| Design | |||||||||||
| PB | 2 | 0.98(0.87–0.99) | 0.770 | 0.94(0.73–1.21) | 0.624 | 1.11(0.90–1.36) | 0.354 | 1.05(0.86–1.28) | 0.627 | 0.90(0.72–1.11) | 0.310 |
| HB | 4 | 0.91(0.84–0.98) | 0.012 | 0.79(0.68–0.93) | 0.004 | 0.96(0.84–1.09) | 0.488 | 0.91(0.81–1.03) | 0.140 | 0.85(0.75–0.96) | 0.008 |
Abbreviations: HB, hospital-based; PB, population-based; PCR-LDR, Polymerase Chain Reaction ligase detection reaction; PCR-RFLP, Polymerase Chain Reaction restriction fragment length polymorphism.
Figure 2.
Forest plot shows the odds ratio for the associations between miR-196a2 gene rs11614913 polymorphism and ESCC risk (TT vs CC).
Figure 3.
Forest plot shows the odds ratio for the associations between miR-196a2 gene rs11614913 polymorphism recessive model and ESCC risk (TT vs CC+CT).
Figure 4.
Forest plot shows the odds ratio for the associations between miR-196a2 gene rs11614913 polymorphism allele model and ESCC risk (T vs C).
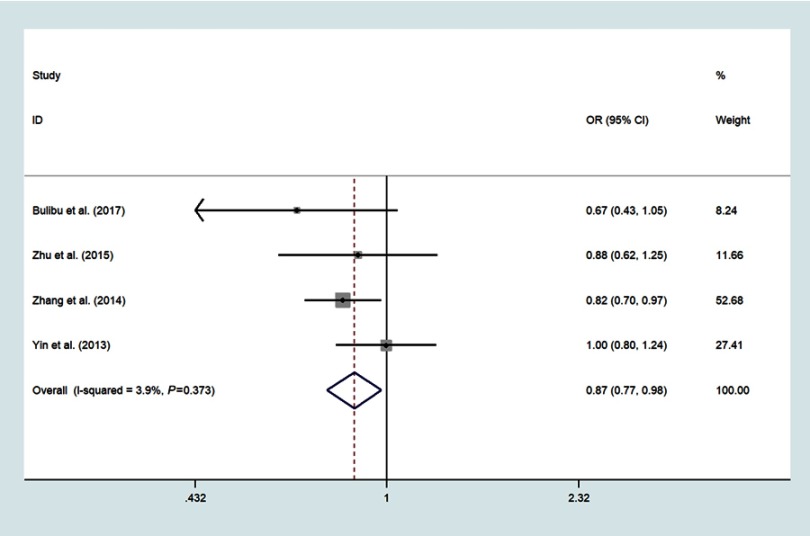
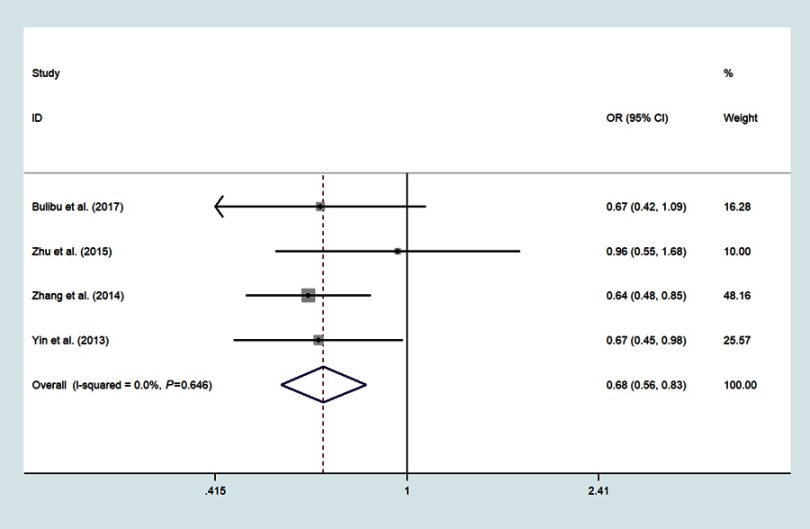
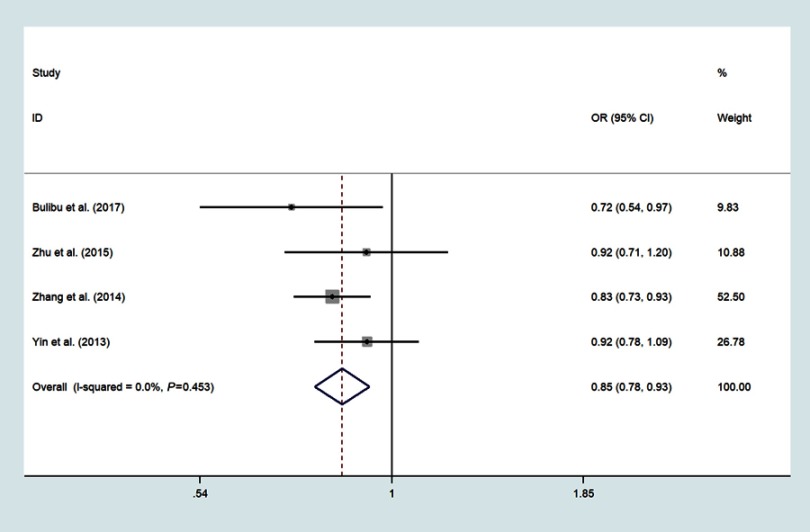
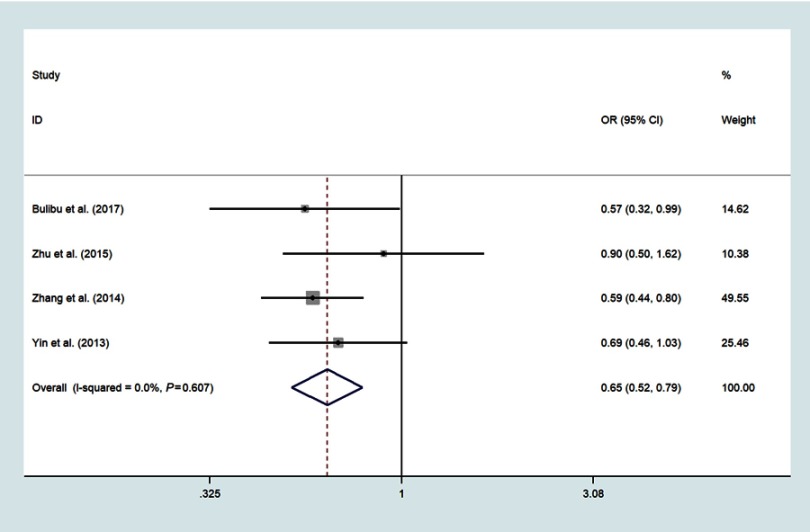
Four studies focused on miR-34b/c rs4938723 T>C, which included 2161 ESCC and 2447 controls;18,21,22,24 The pooled analysis indicated that the polymorphisms of the miR-34b/c rs4938723 locus was correlated with decreased risk of ESCC in the domain model (CC/CT vs.TT, OR=0.87, 95%CI: 0.77–0.98, P=0.018, I2=3.9%) (Figure 5), recessive model (CC vs CT+TT, OR=0.68, 95%CI: 0.56–0.83, P<0.001, I2=0.0%)(Figure 6), allele model (C vs T, OR=0.85, 95%CI: 0.78–0.93, P<0.001, I2=0.0%) (Figure 7) and CC vs.TT (OR=0.65, 95%CI: 0.52–0.79, P<0.001, I2=0.0%) (Figure 8).
Figure 5.
Forest plot shows the odds ratio for the associations between miR-34b/c rs4938723 polymorphism domain model and ESCC risk (CC+CT vs TT).
Figure 6.
Forest plot shows the odds ratio for the associations between miR-34b/c rs4938723 polymorphism recessive model and ESCC risk (CC vs CT+TT).
Figure 7.
Forest plot shows the odds ratio for the associations between miR-34b/c rs4938723 polymorphism allele model and ESCC risk (C vs T).
Figure 8.
Forest plot shows the odds ratio for the associations between miR-34b/c rs4938723 homozygote mode and ESCC risk. (CC vs TT).
For miR-146a rs2910164 C>G polymorphism, six relevant studies with 3120 cases and 4036 controls were included in this meta-analysis.13,15,17,19,22,23 We did not find significant associations with ESCC risk in any genetic models, as well as in the subgroup analysis (Table S2).
Table S2.
Meta-analysis of the association between miR-146a rs2910164 and esophageal cancer risk
| miR-146a | N | C/G | CC/GG | CG/CC | GG+CG/CC | GG/CG+CC | |||||
|---|---|---|---|---|---|---|---|---|---|---|---|
| OR (95%CI) | P | OR (95%CI) | P | OR (95%CI) | P | OR (95%CI) | P | OR (95%CI) | P | ||
| 6 | 1.074(0.965–1.195) | 0.193 | 1.035(0.924–1.159) | 0.554 | 1.125(0.892–1.420) | 0.319 | 1.062(0.915–1.233) | 0.426 | 1.190(0.445–3.181) | 0.729 | |
| Ethnicity | |||||||||||
| Chinese Han | 4 | 1.067(0.923–1.233) | 0.381 | 1.058(0.894–1.250) | 0.513 | 1.149(0.826–1.598) | 0.410 | 1.091(0.877–1.358) | 0.433 | 0.978(0.320–2.986) | 0.969 |
| Chinese Kazakh | 1 | 1.040(0.810–1.336) | 0.757 | 1.042(0.712–1.526) | 0.831 | 1.087(0.635–1.859) | 0.762 | 1.052(0.732–1.513) | 0.784 | 0.428(0.280–0.655) | 0.000 |
| Indian | 1 | 1.182(0.917–1.524) | 0.198 | 0.904(0.492–1.660) | 0.744 | 1.183(0.654–2.139) | 0.578 | 1.057(0.595–1.878) | 0.850 | 7.379(4.610–11.810) | 0.000 |
| Design | |||||||||||
| PB | 1 | 0.943(0.774–1.148) | 0.557 | 0.944(0.688–1.295) | 0.722 | 0.877(0.575–1.336) | 0.540 | 0.927(0.685–1.255) | 0.625 | 0.555(0.394–0.780) | 0.001 |
| HB | 5 | 1.103(0.976–1.247) | 0.115 | 1.049(0.929–1.185) | 0.440 | 1.195(0.909–1.572) | 0.202 | 1.105(0.921–1.327) | 0.283 | 1.389(0.415–4.653) | 0.594 |
Abbreviations: HB, hospital-based; PB, population-based
At last, six studies with 3083 patients and 4483 controls reported the association of miR-423 rs6505162 C>A polymorphism with the risk of ESCC.15,16,18,22,23,25 No statistically significant association was observed in the pooled analysis for CC genotype compared with all genetic carriers, and the results are summarized in Table S3. We also did not find a significant association of this miR-SNP with ESCC risk in the subgroup analysis (Table S3).
Table S3.
Meta-analysis of the association between miR-423 rs6505162 and esophageal cancer risk
| miR-423 | N | A/C | CA/CC | AA/CC | AA+CA/CC | AA/CA+CC | |||||
|---|---|---|---|---|---|---|---|---|---|---|---|
| OR (95%CI) | P | OR (95%CI) | P | OR (95%CI) | P | OR (95%CI) | P | OR (95%CI) | P | ||
| 6 | 1.010(0.933–1.093) | 0.807 | 0.989(0.888–1.100) | 0.834 | 1.112(0.904–1.368) | 0.314 | 1.014(0.915–1.123) | 0.795 | 1.008(0.856–1.187) | 0.926 | |
| Ethnicity | |||||||||||
| Chinese Han | 2 | 1.035(0.934–1.146) | 0.512 | 0.989(0.873–1.121) | 0.863 | 1.223(0.911–1.642) | 0.181 | 1.013(0.898–1.142) | 0.834 | 1.228(0.917–1.645) | 0.169 |
| Chinese Kazakh | 1 | 0.908(0.704–1.172) | 0.460 | 0.959(0.666–1.382) | 0.824 | 0.746(0.402–1.383) | 0.352 | 0.921(0.648–1.308) | 0.645 | 0.763(0.426–1.367) | 0.364 |
| Indian | 1 | 1.009(0.804–1.267) | 0.937 | 0.985(0.678–1.429) | 0.935 | 1.021(0.657–1.588) | 0.927 | 0.997(0.705–1.409) | 0.984 | 1.030(0.704–1.509) | 0.878 |
| Caucasian | 1 | 1.464(1.102–1.945) | 0.009 | 1.185(0.814–1.724) | 0.376 | 3.121(1.442–6.752) | 0.004 | 1.378(0.962–1.974) | 0.080 | 2.894(1.362–6.150) | 0.006 |
| Black | 1 | 0.753(0.597–0.949) | 0.016 | 0.522(0.239–1.140) | 0.103 | 0.413(0.192–0.889) | 0.024 | 0.449(0.210–0.960) | 0.039 | 0.749(0.570–0.985) | 0.039 |
| Genotyping methods | |||||||||||
| PCR-LDR | 2 | 1.035(0.934–1.146) | 0.512 | 0.989(0.873–1.121) | 0.863 | 1.223(0.911–1.642) | 0.181 | 1.013(0.898–1.142) | 0.834 | 1.228(0.917–1.645) | 0.169 |
| PCR-RFLP | 2 | 1.169(0.980–1.395) | 0.083 | 1.079(0.829–1.406) | 0.571 | 1.399(0.965–2.030) | 0.077 | 1.165(0.908–1.495) | 0.229 | 1.319(0.946–1.837) | 0.102 |
| TaqMan | 1 | 0.753(0.597–0.949) | 0.016 | 0.522(0.239–1.140) | 0.103 | 0.413(0.192–0.889) | 0.024 | 0.449(0.210–0.960) | 0.039 | 0.749(0.570–0.985) | 0.039 |
| MALDI- TOF MS | 1 | 0.908(0.704-1.172) | 0.460 | 0.959(0.666–1.382) | 0.824 | 0.746(0.402–1.383) | 0.352 | 0.921(0.648–1.308) | 0.645 | 0.763(0.426–1.367) | 0.364 |
| Design | |||||||||||
| PB | 1 | 0.753(0.597–0.949) | 0.016 | 0.522(0.239–1.140) | 0.103 | 0.413(0.192–0.889) | 0.024 | 0.449(0.210–0.960) | 0.039 | 0.749(0.570–0.985) | 0.039 |
| HB | 5 | 1.049(0.965–1.140) | 0.264 | 1.001(0.898–1.115) | 0.987 | 1.204(0.970–1.493) | 0.092 | 1.029(0.928–1.141) | 0.585 | 1.188(0.969–1.458) | 0.098 |
Abbreviations: HB, hospital-based; PB, population-based; MALDI-TOF MS, Matrix-Assisted Laser Desorption/Ionization Time of Flight Mass Spectrometry; PCR-LDR, Polymerase Chain Reaction ligase detection reaction; PCR-RFLP, Polymerase Chain Reaction restriction fragment length polymorphism.
Subgroup analysis and sensitivity analysis
For miR-196a2 rs11614913, the meta-analysis results indicated the existence of significant heterogeneity in the overall analysis. Therefore, we further carried out different subgroup analyses according to study population (Chinese/Indian), genotyping method (PCR-LDR/PCR-RFLP/SNPscan/SNaPshot assay), and source of controls (hospital/population). As shown in Table 2, the subgroup analysis performed based on the ethnicity of subjects (Chinese vs Indian) indicated that homozygote variant genotype (TT vs CC: OR=0.81, 95%CI: 0.71–0.93, P=0.002), allele model (T vs C: OR=0.91, 95%CI: 0.85–0.97, P=0.006), and recessive model (TT vs CT+CC: OR=0.85, 95%CI: 0.76–0.94, P=0.002) were all correlated with a decreased ESCC risk in Chinese Han population. In the subgroup analysis based on the source of controls showed that there were significant correlations with a decreased ESCC risk in hospital-based control for allele model (T vs C: OR=0.91, 95%CI: 0.84–0.98, P=0.012), homozygote variant genotype (TT vs CC: OR=0.79, 95%CI: 0.68–0.93, P=0.004) and recessive model (TT vs CT+CC: OR=0.85, 95%CI: 0.75–0.96, P=0.008). The same tendency was found in the subgroup analyses based on the SNaPshot assay genotyping method (Table 2).
Although the heterogeneity analysis result was negative for the miR-34b/c rs4938723, we still performed subgroup analyses based on study population (Chinese Han/Chinese Kazakh) and source of controls (hospital/population) to further explore the potential correlation of miR-34b/c rs4938723 polymorphism with the susceptibility of ESCC. As shown in Table 3, the subgroup analysis results indicated that reduced ESCC risk in Chinese Han population was observed for allele model (C vs T: OR=0.84, 95%CI: 0.76–0.94, P=0.001), homozygote variant genotype (CC vs TT: OR=0.59, 95%CI: 0.44–0.80, P=0.001), recessive model (CC vs CT+TT: OR=0.65, 95%CI: 0.56–0.83, P<0.001) and domain model (CC+CT vs TT: OR=0.86, 95%CI: 0.76–0.98, P=0.018). The same tendency was observed in the population-based study for allele model (C vs T: OR=0.83, 95%CI: 0.73–0.94, P=0.002) (Table 3).
Table 3.
Meta-analysis of the association between miR-34b/c rs4938723 and esophageal cancer risk
| miR-34b/c | N | C/T | CC/TT | CT/TT | CC+CT/TT | CC/CT+TT | |||||
|---|---|---|---|---|---|---|---|---|---|---|---|
| OR (95%CI) | P | OR (95%CI) | P | OR (95%CI) | P | OR (95%CI) | P | OR (95%CI) | P | ||
| 4 | 0.85(0.78–0.93) | <0.001 | 0.65(0.52–0.79) | <0.001 | 0.92(0.81–1.04) | 0.196 | 0.87(0.77–0.98) | 0.018 | 0.68(0.56–0.83) | <0.001 | |
| Ethnicity | |||||||||||
| Chinese Han | 3 | 0.84(0.76–0.94) | 0.001 | 0.62(0.49–0.77) | <0.001 | 0.93(0.78–1.09) | 0.382 | 0.86(0.76–0.98) | 0.024 | 0.65(0.52–0.80) | <0.001 |
| Chinese Kazakh | 1 | 0.92(0.70–1.19) | 0.545 | 0.90(0.49–1.62) | 0.725 | 0.88(0.61–1.26) | 0.482 | 0.88(0.62–1.24) | 0.476 | 0.95(0.54–1.68) | 0.884 |
| Design | |||||||||||
| PB | 1 | 0.83(0.73–0.94) | 0.002 | 0.59(0.44–0.80) | 0.001 | 0.88(0.74–1.04) | 0.142 | 0.82(0.69–0.97) | 0.023 | 0.63(0.47–0.84) | 0.002 |
| HB | 3 | 0.88(0.77–1.00) | 0.059 | 0.70(0.52–0.93) | 0.014 | 0.96(0.79–1.16) | 0.691 | 0.89(0.73–1.09) | 0.288 | 0.72(0.55–0.94) | 0.018 |
Abbreviations: HB, hospital-based; PB, population-based.
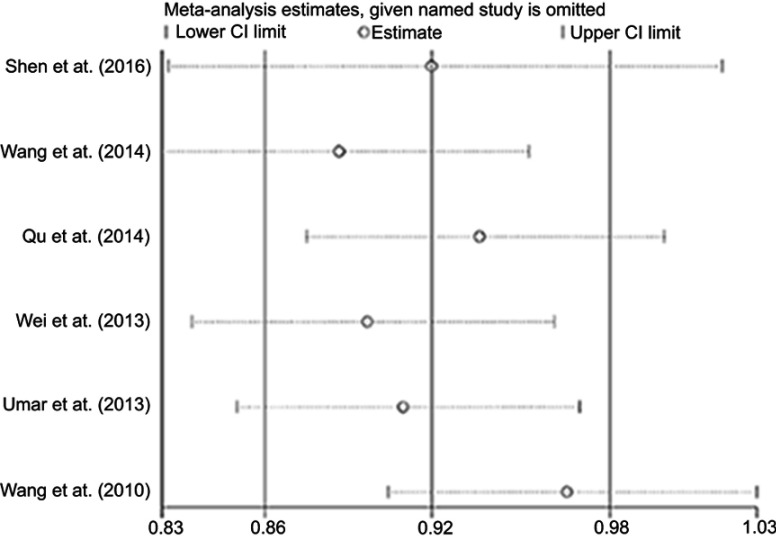
The sensitivity analysis of miR-196a2 rs11614913 was conducted by sequentially removing one individual study per time to weigh the influence of each study on the overall meta-analysis. No significant change in the heterogeneity was observed for this polymorphism (Figure S1).
Figure S1.
Forest plot of OR for the sensitivity analysis of miR-196a2 rs11614913 polymorphism and ESCC risk.
Publication bias
We found no evidence of publication bias using the Begg’s funnel plots and Egger’s test for all genetic models of miR-SNPs included in this study (data not shown).
Trial sequential analysis
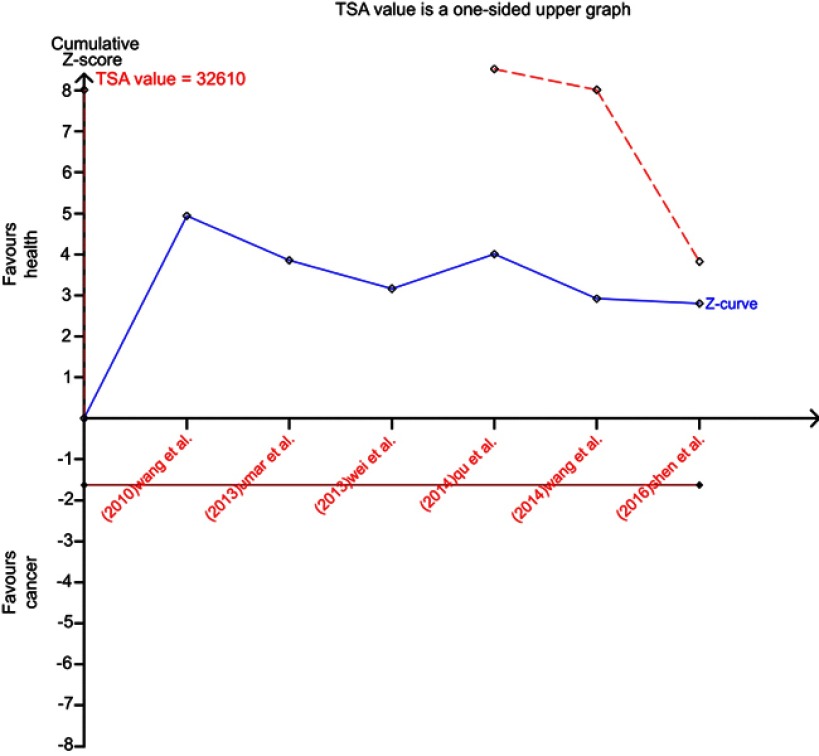
The recessive model for miR-196a2 rs11614913 was then subjected to the trial sequential analysis to further strengthen the robustness of its association with ESCC risk. According to TSA result, the required information size was 32610 subjects to demonstrate the issue (Figure S2). Until now, the cumulative Z-curve has not crossed the trial monitoring boundary before reaching the required information size, indicating that the current evidence is insufficient and more trials need to be included for this assay.
Figure S2.
Trial sequential analysis for association between miR-196a2 rs11614913 and ESCC risk in the recessive model.
RNA secondary structure analysis
We conducted an RNA secondary structure analysis of the miR-196a2 rs11614913 polymorphisms using the RNAfold Web server. This SNP decreased the minimum free energy (MFE) from −52.02 kcal/mol of the C allele to −46.52 kcal/mol of the T allele, suggesting a less stable secondary structure for the variant T allele, and therefore this variant might affect the stability of the secondary structure of miR-196a2.
Discussion
This meta-analysis shows that overall, variant TT genotype and T allele carriers of the rs116149138473 polymorphism of miR-196a2 gene are correlated to reduced risk for ESCC, especially among Chinese population (Table 2 and Figures 2–4). The miR-196a2 polymorphism site rs11614913 is located in the mature sequence of miR-196a-3p (passenger strand), and it could lead to less efficient processing of the miRNA precursor to its mature form and therefore reduce the capacity of mature miR-196a-3p in regulating target genes.32 Another research reported that miR-196a2 rs11614913 not only influences the levels of mature miR-196a but also has an effect on target gene expression.33 Our further RNA secondary structure analysis suggested that the variant T allele might affect the stability of the secondary structure of miR-196a2.
In the subgroup analyses, we did not find rs116149138473 polymorphism of miR-196a2 gene was associated with the ESCC risk in the population-based studies. Since only two studies were included in this subgroup analysis, the limited sample size may not have enough power to detect the significance. In addition, other specific factors, such as patient stratification, genotyping errors, and environmental exposure, may also contribute to this observed discrepancy.34
Moreover, our meta-analysis found that the CC genotype or C allele of miR-34b/c rs4938723 had significant associations with decreased risk of ESCC, especially among Chinese Han population (Table 3 and Figures 5–8). The miR-34b/c rs4938723 is located in CpG islands in miR-34b/c promoter region and may take part in the epigenetic silencing of miR-34b/c.35 To the best of our knowledge, this study is the first systematic review and meta-analysis to evaluate the association of miR-34b/c rs4938723 with the risk of ESCC. In addition, we also conducted pooled analysis with the other two polymorphisms, miR-146a rs2910164 G>C and miR-423 rs6505162 C>A. However, we didn’t find a significant association with ESCC risk in any genetic models, even though they have been reported to be biomarkers of various types of cancer.36,37 Further studies need to be done to explore the association of these miR-SNPs with susceptibility in a larger cohort of ESCC patients and verify the association with laboratory experiments.
A meta-analysis by Ji et al has evaluated the association between miR-196a2 rs11614913, miR-146a rs2910164, and miR-423 rs6505162 polymorphisms and esophageal cancer risk.38 The main difference between our systematic reviews is that we included the most updated publication and more miRNA-SNPs, which can provide a more comprehensive understanding of the relationship between miRNA-SNPs and ESCC risk. Furthermore, the advantages of our meta-analysis are as follows: first, our meta-analysis included only the squamous cell carcinomas cases but not adenocarcinoma,39 because these two major subtypes of esophageal cancer have quite different molecular mechanisms. Second, we performed subgroup analyses to comprehensively investigate the impact of the miR-SNPs on esophageal cancer risk. Third, in addition to the regular meta-analysis, we conducted the TSA and RNA secondary structure analysis to determine if the current evidence is reliable and conclusive and predict the potential biological significance of these miR-SNPs.
Although considerable efforts have been made to discover possible associations between miR-SNPs and ESCC risk, there are still some inherent limitations of this study that may decrease the robustness of the findings of this study. Firstly, gene-environment interactions are of great interest to evaluate the exact roles of genetic polymorphism. However, not all of the reviewed studies analyzed the same environmental factors such as tobacco use and alcohol drinking. Thus, this limitation hindered the evaluation of the potential influence of gene-environment interactions in the association between miR-SNPs and ESCC risk. Secondly, this meta-analysis was based on case-control studies, but this type of study has inherent limitations, such as selection bias and recall bias. Finally, as shown in Table 1, most included studies were from China; therefore, further studies based on Caucasian, African, and other ethnic populations are needed to generalize the conclusion of this study. And these results also suggested that the biological functions of genetic variations in miRNAs might be influenced by ethnics, ages and environment factors (smoking, drinking). In order to verify this hypothesis, larger sample size and more detailed sample information such as environmental factors are needed in further studies.
Conclusion
In summary, despite these limitations, a systematic review of the association of miR-SNPs with esophageal cancer risk is statistically more powerful than any single study. The present study indicated that the polymorphisms of miR-196a2 rs11614913 and miR-34b/c rs4938723 are associated with decreased risk of ESCC, especially in Chinese people. However, the current data suggested that miR-146a rs2910164 or miR-423 rs6505162 are not related to the susceptibility of ESCC in any genetic model. Moreover, no obvious publication bias was detected in this analysis. Further large-scale prospective studies from different ethnic groups and with gene-environment interactions in the relationship between miR-SNPs and esophageal cancer risks are warranted to confirm our conclusions.
Acknowledgments
This work was partly supported by grants from the Beijing Natural Science Foundation (7172025), National Natural Science Foundation of China (81874277, 81473056 and 81573224) and Scientific Research Project of Beijing Educational Committee (SQKM201710025006). The funders had no role in study design, data collection, and analysis, decision to publish, or preparation of the manuscript.
Author contributions
F Liu and XD Guo designed research; XD Guo, Y Shen, and Y Shao collected and analyzed the data; L Zhao, XD Guo, and F Liu wrote the manuscript; L Zhao and F Liu, WQ Wei contributed to the discussion and revised the manuscript. All authors contributed to data analysis, drafting and revising the article, gave final approval of the version to be published, and agree to be accountable for all aspects of the work.
Disclosure
The authors report no conflicts of interest in this work.
Supplementary materials
References
- 1.Bray F, Ferlay J, Soerjomataram I, Siegel RL, Torre LA, Jemal A. Global cancer statistics 2018: GLOBOCAN estimates of incidence and mortality worldwide for 36 cancers in 185 countries. CA Cancer J Clin. 2018;68(6):394–424. doi: 10.3322/caac.21492 [DOI] [PubMed] [Google Scholar]
- 2.Pennathur A, Farkas A, Krasinskas AM, et al. Esophagectomy for T1 esophageal cancer: outcomes in 100 patients and implications for endoscopic therapy. Ann Thorac Surg. 2009;87(4):1048–1054. doi: 10.1016/j.athoracsur.2008.12.060 [DOI] [PMC free article] [PubMed] [Google Scholar]
- 3.Pennathur A, Gibson MK, Jobe BA, Luketich JD. Oesophageal carcinoma. Lancet. 2013;381(9864):400–412. doi: 10.1016/S0140-6736(12)60643-6 [DOI] [PubMed] [Google Scholar]
- 4.Umar M, Upadhyay R, Kumar S, Ghoshal UC, Mittal B. Role of novel and GWAS originated PLCE1 genetic variants in susceptibility and prognosis of esophageal cancer patients in northern Indian population. Tumour Biol. 2014;35(11):11667–11676. doi: 10.1007/s13277-014-2458-z [DOI] [PubMed] [Google Scholar]
- 5.Chang J, Wei L, Miao X, et al. Two novel variants on 13q22.1 are associated with risk of esophageal squamous cell carcinoma. Cancer Epidemiol Biomarkers Prev. 2015;24(11):1774–1780. doi: 10.1158/1055-9965.EPI-15-0154-T [DOI] [PubMed] [Google Scholar]
- 6.Levine DM, Ek WE, Zhang R, et al. A genome-wide association study identifies new susceptibility loci for esophageal adenocarcinoma and Barrett‘s esophagus. Nat Genet. 2013;45(12):1487–1493. doi: 10.1038/ng.2796 [DOI] [PMC free article] [PubMed] [Google Scholar]
- 7.Chang TC, Yu D, Lee YS, et al. Widespread microRNA repression by Myc contributes to tumorigenesis. Nat Genet. 2008;40(1):43–50. doi: 10.1038/ng.2007.30 [DOI] [PMC free article] [PubMed] [Google Scholar]
- 8.Kumar MS, Lu J, Mercer KL, Golub TR, Jacks T. Impaired microRNA processing enhances cellular transformation and tumorigenesis. Nat Genet. 2007;39(5):673–677. doi: 10.1038/ng2003 [DOI] [PubMed] [Google Scholar]
- 9.Lu J, Getz G, Miska EA, et al. MicroRNA expression profiles classify human cancers. Nature. 2005;435(7043):834–838. doi: 10.1038/nature03702 [DOI] [PubMed] [Google Scholar]
- 10.Melo SA, Ropero S, Moutinho C, et al. A TARBP2 mutation in human cancer impairs microRNA processing and DICER1 function. Nat Genet. 2009;41(3):365–370. doi: 10.1038/ng.317 [DOI] [PMC free article] [PubMed] [Google Scholar] [Retracted]
- 11.Nicoloso MS, Sun H, Spizzo R, et al. Single-nucleotide polymorphisms inside microRNA target sites influence tumor susceptibility. Cancer Res. 2010;70(7):2789–2798. doi: 10.1158/0008-5472.CAN-09-3541 [DOI] [PMC free article] [PubMed] [Google Scholar]
- 12.Ryan BM, Robles AI, Harris CC. Genetic variation in microRNA networks: the implications for cancer research. Nat Rev Cancer. 2010;10(6):389–402. doi: 10.1038/nrc2867 [DOI] [PMC free article] [PubMed] [Google Scholar]
- 13.Guo H, Wang K, Xiong G, et al. A functional varient in microRNA-146a is associated with risk of esophageal squamous cell carcinoma in Chinese Han. Fam Cancer. 2010;9(4):599–603. doi: 10.1007/s10689-010-9370-5 [DOI] [PubMed] [Google Scholar]
- 14.Wang K, Guo H, Hu H, et al. A functional variation in pre-microRNA-196a is associated with susceptibility of esophageal squamous cell carcinoma risk in Chinese Han. Biomarkers. 2010;15(7):614–618. doi: 10.3109/1354750X.2010.505299 [DOI] [PubMed] [Google Scholar]
- 15.Umar M, Upadhyay R, Prakash G, Kumar S, Ghoshal UC, Mittal B. Evaluation of common genetic variants in pre-microRNA in susceptibility and prognosis of esophageal cancer. Mol Carcinog. 2013;52(Suppl 1):E10–E18. doi: 10.1002/mc.21931 [DOI] [PubMed] [Google Scholar]
- 16.Wang Y, Vogelsang M, Schafer G, Matejcic M, Parker MI, Mittal B. MicroRNA polymorphisms and environmental smoke exposure as risk factors for oesophageal squamous cell carcinoma. PLoS One. 2013;8(10):e78520. doi: 10.1371/journal.pone.0078520 [DOI] [PMC free article] [PubMed] [Google Scholar]
- 17.Wei J, Zheng L, Liu S, et al. MiR-196a2 rs11614913 T>C polymorphism and risk of esophageal cancer in a Chinese population. Hum Immunol. 2013;74(9):1199–1205. doi: 10.1016/j.humimm.2013.06.012 [DOI] [PubMed] [Google Scholar]
- 18.Yin J, Wang X, Zheng L, et al. Hsa-miR-34b/c rs4938723 T>C and hsa-miR-423 rs6505162 C>A polymorphisms are associated with the risk of esophageal cancer in a Chinese population. PLoS One. 2013;8(11):e80570. doi: 10.1371/journal.pone.0080570 [DOI] [PMC free article] [PubMed] [Google Scholar]
- 19.Qu Y, Qu H, Luo M, et al. MicroRNAs related polymorphisms and genetic susceptibility to esophageal squamous cell carcinoma. Mol Genet Genomics. 2014;289(6):1123–1130. doi: 10.1007/s00438-014-0873-x [DOI] [PubMed] [Google Scholar]
- 20.Wang N, Li Y, Zhou RM, et al. Hsa-miR-196a2 functional SNP is associated with the risk of ESCC in individuals under 60 years old. Biomarkers. 2014;19(1):43–48. doi: 10.3109/1354750X.2013.866164 [DOI] [PubMed] [Google Scholar]
- 21.Zhang J, Huang X, Xiao J, et al. Pri-miR-124 rs531564 and pri-miR-34b/c rs4938723 polymorphisms are associated with decreased risk of esophageal squamous cell carcinoma in Chinese populations. PLoS One. 2014;9(6):e100055. doi: 10.1371/journal.pone.0100055 [DOI] [PMC free article] [PubMed] [Google Scholar]
- 22.Zhu J, Song X, Yang L, et al. Genetic variation in miR-100 rs1834306 is associated with decreased risk for esophageal squamous cell carcinoma in Kazakh patients in northwest China. Int J Clin Exp Pathol. 2015;8(6):7332–7340. [PMC free article] [PubMed] [Google Scholar]
- 23.Shen F, Chen J, Guo S, et al. Genetic variants in miR-196a2 and miR-499 are associated with susceptibility to esophageal squamous cell carcinoma in Chinese Han population. Tumor Biol. 2016;37(4):4777–4784. doi: 10.1007/s13277-015-4268-3 [DOI] [PubMed] [Google Scholar]
- 24.Bulibu J, Wang W, Tang Y, et al. Association between polymorphisms in the promoter region of microRNA-34b/c and the chemoradiotherapy efficacy for locally advanced esophageal squamous cell carcinoma in Chinese Han population. Pathol Oncol Res. 2019;25(1):421–427. [DOI] [PubMed] [Google Scholar]
- 25.Nariman-Saleh-Fam Z, Bastami M, Somi MH, et al. miRNA-related polymorphisms in miR-423 (rs6505162) and PEX6 (rs1129186) and risk of esophageal squamous cell carcinoma in an Iranian Cohort. Genet Test Mol Biomarkers. 2017;21(6):382–390. doi: 10.1089/gtmb.2016.0346 [DOI] [PubMed] [Google Scholar]
- 26.Stang A. Critical evaluation of the Newcastle-Ottawa scale for the assessment of the quality of nonrandomized studies in meta-analyses. Eur J Epidemiol. 2010;25(9):603–605. doi: 10.1007/s10654-010-9491-z [DOI] [PubMed] [Google Scholar]
- 27.Wells GA, Shea B, O’Connell D et al. The Newcastle-Ottawa Scale (NOS) for assessing the quality of nonrandomised studies in meta-analyses. Available from: http://www.ohri.ca/programs/clinical_epidemiology/oxford.asp. Accessed March3, 2019.
- 28.Lau J, Ioannidis JP, Schmid CH, et al. Quantitative synthesis in systematic reviews. Ann Intern Med. 1997;127(9):820–826. [DOI] [PubMed] [Google Scholar]
- 29.Higgins JP, Thompson SG, Deeks JJ, Altman DG. Measuring inconsistency in meta-analyses. BMJ. 2003;327(7414):557–560. doi: 10.1136/bmj.327.7414.557 [DOI] [PMC free article] [PubMed] [Google Scholar]
- 30.Gruber AR, Lorenz R, Bernhart SH, Neuböck R, Hofacker IL. The Vienna RNA websuite. Nucleic Acids Res. 2008;36(WebServer issue):W70–W74. doi: 10.1093/nar/gkn188 [DOI] [PMC free article] [PubMed] [Google Scholar]
- 31.Zuker M, Stiegler P. Optimal computer folding of large RNA sequences using thermodynamics and auxiliary information. Nucleic Acids Res. 1981;9(1):133–148. [DOI] [PMC free article] [PubMed] [Google Scholar]
- 32.Hu Z, Liang J, Wang Z, et al. Common genetic variants in pre-microRNAs were associated with increased risk of breast cancer in Chinese women. Hum Mutat. 2009;30(1):79–84. doi: 10.1002/humu.20837 [DOI] [PubMed] [Google Scholar]
- 33.Hoffman AE, Zheng T, Yi C, et al. microRNA miR-196a-2 and breast cancer: a genetic and epigenetic association study and functional analysis. Cancer Res. 2009;69(14):5970–5977. doi: 10.1158/0008-5472.CAN-09-0236 [DOI] [PMC free article] [PubMed] [Google Scholar]
- 34.Gourraud PA. When is the absence of evidence, evidence of absence? Use of equivalence-based analyses in genetic epidemiology and a conclusion for the KIF1B rs10492972*C allelic association in multiple sclerosis. Genet Epidemiol. 2011;35(6):568–571. doi: 10.1002/gepi.20589 [DOI] [PMC free article] [PubMed] [Google Scholar]
- 35.Xu Y, Liu L, Liu J, et al. A potentially functional polymorphism in the promoter region of miR-34b/c is associated with an increased risk for primary hepatocellular carcinoma. Int J Cancer. 2011;128(2):412–417. doi: 10.1002/ijc.25342 [DOI] [PubMed] [Google Scholar]
- 36.Wang BG, Jiang LY, Xu Q. Comprehensive assessment for miRNA polymorphisms in hepatocellular cancer risk: a systematic review and meta-analysis. Biosci Rep. 2018;38(5):BSR20180712. [DOI] [PMC free article] [PubMed] [Google Scholar]
- 37.Chen R, Zheng Y, Zhuo L, Wang S. The association between miR-423 rs6505162 polymorphism and cancer susceptibility: a systematic review and meta-analysis. Oncotarget. 2017;8(25):40204–40213. doi: 10.18632/oncotarget.16319 [DOI] [PMC free article] [PubMed] [Google Scholar]
- 38.Ji HH, Hong L, Huang GL, et al. Association between microRNA-196a2 rs11614913, microRNA-146a rs2910164, and microRNA-423 rs6505162 polymorphisms and esophageal cancer risk: a meta-analysis. Meta Gene. 2015;3:14–25. doi: 10.1016/j.mgene.2014.12.001 [DOI] [PMC free article] [PubMed] [Google Scholar]
- 39.Ye Y, Wang KK, Gu J, et al. Genetic variations in microRNA-related genes are novel susceptibility loci for esophageal cancer risk. Cancer Prev Res (Phila). 2008;1(6):260–469. doi: 10.1158/1940-6207.CAPR-08-0135 [DOI] [PMC free article] [PubMed] [Google Scholar]
References
- 1.Guo H, Wang K, Xiong G, et al. A functional varient in microRNA-146a is associated with risk of esophageal squamous cell carcinoma in Chinese Han. Familial Cancer. 2010;9(4):599–603. [DOI] [PubMed] [Google Scholar]
- 2.Wang K, Guo H, Hu H, et al. A functional variation in pre-microRNA-196a is associated with susceptibility of esophageal squamous cell carcinoma risk in Chinese Han. Biomarkers. 2010;15(7):614–618. [DOI] [PubMed] [Google Scholar]
- 3.Umar M, Upadhyay R, Prakash G, et al. Evaluation of common genetic variants in pre-microRNA in susceptibility and prognosis of esophageal cancer. Molecular Carcinogenesis. 2013;52 Suppl 1: E10–18. [DOI] [PubMed] [Google Scholar]
- 4.Wang Y, Vogelsang M, Schafer G, et al. MicroRNA polymorphisms and environmental smoke exposure as risk factors for oesophageal squamous cell carcinoma. PloS One. 2013;8(10):e78520. [DOI] [PMC free article] [PubMed] [Google Scholar]
- 5.Wei J, Zheng L, Liu S, et al. MiR-196a2 rs11614913 T > C polymorphism and risk of esophageal cancer in a Chinese population. Human Immunology. 2013;74(9):1199–1205. [DOI] [PubMed] [Google Scholar]
- 6.Yin J, Wang X, Zheng L, et al. Hsa-miR-34b/c rs4938723 T>C and hsa-miR-423 rs6505162 C>A polymorphisms are associated with the risk of esophageal cancer in a Chinese population. PloS One. 2013;8(11):e80570. [DOI] [PMC free article] [PubMed] [Google Scholar]
- 7.Qu Y, Qu H, Luo M, et al. MicroRNAs related polymorphisms and genetic susceptibility to esophageal squamous cell carcinoma. Mol Genet Genomics. 2014;289(6):1123–1130. [DOI] [PubMed] [Google Scholar]
- 8.Wang N, Li Y, Zhou RM, et al. Hsa-miR-196a2 functional SNP is associated with the risk of ESCC in individuals under 60 years old. Biomarkers. February 2014;19(1):43–48. [DOI] [PubMed] [Google Scholar]
- 9.Zhang J, Huang X, Xiao J, et al. Pri-miR-124 rs531564 and pri-miR-34b/c rs4938723 polymorphisms are associated with decreased risk of esophageal squamous cell carcinoma in Chinese populations. PloS One. 2014;9(6):e100055. [DOI] [PMC free article] [PubMed] [Google Scholar]
- 10.Zhu J, Song X, LY, et al. Genetic variation in miR-100 rs1834306 is associated with decreased risk for esophageal squamous cell carcinoma in Kazakh patients in northwest China. Int J Clin Exp Pathol. 2015;8(6):7332–7340. [PMC free article] [PubMed] [Google Scholar]
- 11.Shen F, Chen J, Guo S, et al. Genetic variants in miR-196a2 and miR-499 are associated with susceptibility to esophageal squamous cell carcinoma in Chinese Han population. Tumour Biology. 2016;37(4):4777–4784. [DOI] [PubMed] [Google Scholar]
- 12.Bulibu J, Wang W, Tang Y, et al. Association Between Polymorphisms in the Promoter Region of microRNA-34b/c and the Chemoradiotherapy Efficacy for Locally Advanced Esophageal Squamous Cell Carcinoma in Chinese Han Population. Pathol Oncolo Res. 2017. [DOI] [PubMed] [Google Scholar]
- 13.Nariman-Saleh-Fam Z, Bastami M, Somi MH, et al. miRNA-Related Polymorphisms in miR-423 (rs6505162) and PEX6 (rs1129186) and Risk of Esophageal Squamous Cell Carcinoma in an Iranian Cohort. Genet Test Mol Biomarkers. 2017;21(6):382–390. [DOI] [PubMed] [Google Scholar]


