

Abstract
Background
Limited data are available on HBV, HCV, and HIV co-infections and triple infection. We characterized co-occurrence of HIV, HBV, and HCV infections at the population level in British Columbia (BC) to identify patterns of predisposing factors unique to co-infection subgroups.
Methods
We analyzed data from the BC Hepatitis Testers Cohort, which includes all individuals tested for HCV or HIV in BC between 1992 and 2013, or included in provincial public health registries of HIV, HCV, HBV, and active tuberculosis. Individuals were classified as negative, mono-, and co-infection groups based on HIV, HBV, and HCV status. We evaluated associations between risk factors (injection drug use, sexual orientation etc.) and co-infection groups using multivariate multinomial logistic regression.
Findings
Of a total of 1,376,989 individuals included in the analysis, 1,276,290 were negative and 100,699 were positive for HIV, HBV, and/or HCV. Most cases (91,399, 90.8%) were mono-infected, while 3991 (4.0%) had HBV/HCV, 670 HBV/HIV (0.7%), 3459 HCV/HIV (3.4%), and 1180 HBV/HCV/HIV (1.2%) co-infection. Risk factor and demographic distribution varied across co-infection categories. MSM classification was associated with higher odds of all HIV co-infection groups, particularly HBV/HIV (OR 6.8; 95% CI: 5.6, 8.27), while injection drug use was most strongly associated with triple infection (OR 64.19; 95% CI: 55.11, 74.77) and HIV/HCV (OR 23.23; 95% CI: 21.32, 25.31).
Interpretation
Syndemics of substance use, sexual practices, mental illness, socioeconomic marginalization, and co-infections differ among population groups, highlighting avenues for optimal composition and context for health services to meet each population's unique needs.
Funding
BC Centre for Disease Control and Canadian Institutes of Health Research.
Keywords: Hepatitis B, Hepatitis C, HIV, Substance use, Syndemics, Co-infection
Highlights
-
•
Individuals with multiple infections have higher frequency of various risk factors.
-
•
Being MSM was associated with higher odds of all HIV co-infection groups.
-
•
Injection drug use was most strongly associated with triple infection and HIV/HCV.
-
•
MSM who also injected drugs had 2-4 times higher odds of HBV, HIV, HBV/HIV, HCV/HIV and HBV/HCV/HIV.
-
•
Among non–PWID, mental illness, problematic alcohol use, and material deprivation were associated with higher odds of various mono- and co-infections.
-
•
The study highlights the presence of syndemics of IDU, sexual practices, mental illness, socioeconomic deprivation, and infections.
Research in context
Evidence before this study
Human immunodeficiency virus (HIV), hepatitis B virus (HBV), and hepatitis C virus (HCV) infections are major public health concerns globally. Various population groups, including people who inject drugs (PWID), immigrants from infection endemic countries, indigenous populations, men who have sex with men (MSM), and high-risk heterosexual people, have high burden of these infections; however, the level of co-occurrence may differ across and within population groups, depending on risk activities and vulnerabilities. While it is known that individuals with multiple or repeat infections tend to engage in higher risk activities that increase transmission risk, data on co-occurrence of these infections at a broader population level is limited.
We searched PubMed for articles published up to November 30, 2017, describing HIV, HCV, and HBV infections, focusing on characteristics, co-morbidities, and risk factors associated with co-infection. There have been several studies describing syndemics of HIV, HCV, and HBV for specific population groups, such as people who inject drugs, as well as several studies of HBV and HCV co-infection among HIV positive individuals; however, we did not identify any study that included individuals diagnosed with all three pathogens, in addition to those testing negative and their predisposing conditions, among a general population sample at a provincial, state, or country level.
Added value of this study
This is one of the largest population-based cohort studies in the world and first to incorporate all diagnosed cases of HIV, HCV, HBV, and individuals testing negative for HCV and/or HIV within the province to characterize co-occurrence of bloodborne infections, mental illness, substance use, sexual orientation, and socioeconomic marginalization. We found that distribution of risk factors differs by infection group. Substance use was associated with higher odds of all infection groups except HBV, with strongest association with HIV/HCV, HBV/HCV coinfection and triple infection. MSM also had higher odds of HIV and HBV/HIV. HBV mono-infection was mainly associated with urban residence and higher material deprivation. Stratification by substance use revealed further heterogeneity in risk factor distribution.
Implications of all the available evidence
Our results provide key data on understanding distribution of various infections and co-occurring risk and vulnerabilities. Difference in distribution of various infection groups by PWID, MSM and HBV being in low risk population (potentially immigrants) highlights the need for tailoring integration of prevention, care and treatment services by population groups.
Alt-text: Unlabelled Box
1. Introduction
Despite advances in treatment and prevention, human immunodeficiency virus (HIV), hepatitis B virus (HBV), and hepatitis C virus (HCV) continue to constitute a considerable burden on health. Although more prevalent in Africa, Asia, and the Middle East, these pathogens affect a sizeable portion of the North American population [1], [2]. Recent estimates suggest that 136,000–246,000 Canadians are infected with HCV, while over 75,500 live with HIV and 285,000 with HBV; however, the proportion with multiple concurrent HIV, HCV, and HBV infections is not known [1], [2], [3].
Each of these infections is associated with substantial morbidity and mortality. According to Global Burden of Disease estimates, HIV and hepatitis were directly associated with over 1.6 million deaths and 59 million years of life lost in 2016 [4]. Therapeutic improvements have dramatically extended the life expectancy and reduced morbidity and mortality for individuals infected with HIV; however, HCV related morbidity and mortality have been increasing [5]. The advent of highly effective direct acting antiviral (DAA) agents is expected to halt this rising tide of HCV related morbidity and mortality. In combination, these infections (HIV, HCV, HBV) increase the risk of morbidity and mortality when compared to mono-infection [6], [7]. Improved therapeutic interventions for HCV and HIV could reduce the impact of co-occurring infections; however, they do not address the underlying factors that lead to acquisition and re-acquisition of these infections.
HIV, HCV, and HBV share transmission routes, leading to increased risk of co-occurrence among populations with similar predisposing vulnerabilities and risk behaviors. Previous studies of HIV/HCV co-infections suggested the distribution of these factors may vary across coinfection groups [8]. Individuals with coinfections have higher levels of co-occurrence of socioeconomic vulnerabilities and psycho-social conditions, such as mental illness, drug use, alcohol use, and homelessness [8]. This suggests the presence of multiple underlying factors increases the risk of acquiring multiple infections sharing the same transmission routes and population clustering, such as the blood-borne transmission of HIV, HBV, and HCV through injection drug use. The concept of co-occurring and interacting social conditions and vulnerabilities leading to clustering of infections and related increased morbidity and mortality is also referred as a syndemic [9], [10]. Syndemic theory provides an important framework to investigate co-occurrence of disease and social conditions, which may inform the design of public health programs to address challenges at the individual and population levels [11].
Although HCV/HIV coinfection has been widely studied, there is very little data regarding the co-occurrence of triple infection at the population level. Large scale, population-based studies that investigate co-occurrence of infections, as well as underlying risk and social conditions, are limited [7], [12]. Previous studies focused on co-infection with HCV, HBV, and HIV among sub-populations, including those engaged in HIV care and people who use injection drugs; however these did not compare to non-infected individuals in the general population [6], [7], [12], [13], [14], [15], [16]. Comparison with a control group negative for all infections is important to understand the risk and vulnerability context of co-infections and triple infection. This may provide important insights into design of programs addressing infections and concurrent risk and social conditions, as recently reported for people with severe mental illness from Sweden [16].
This analysis aims to use data from the British Columbia Hepatitis Testers Cohort (BC-HTC) to describe the syndemic of HIV, HBV, and HCV infections at the population level in British Columbia (BC) and identify patterns of predisposing factors unique to co-infection subgroups. We also evaluated interactions across underlying factors that contribute to the risks of acquiring multiple infections, as identified as a major gap in recent series on syndemics [11].
2. Methods
2.1. The Study Cohort
This analysis is based on the BC-HTC, which has been described in detail in a previous publication [17]. The BC-HTC includes all individuals tested for HCV or HIV at the BC Centre for Disease Control Public Health Laboratory (BCCDC-PHL) between 1992 and 2013, as well as cases of HIV (1980–2013), HCV (1990–2013), HBV (1990–2013), and active tuberculosis (1990–2013) included in public health registries of reportable diseases in BC. These data are integrated through a unique personal health number assigned to each resident of BC with data on medical visits, hospitalizations, prescription drugs, cancers, and deaths (Supplemental Table 1). More than 95% of HCV and HIV serology as well as all confirmatory testing in BC are performed at the BCCDC-PHL. The BC-HTC also includes detailed risk-factor data on reported disease cases followed for surveillance purposes, as well as all prescriptions dispensed in BC, including HCV treatments, through a central system called PharmaNet.
2.2. Eligibility Criteria
This analysis included all individuals who were tested for HCV or HIV between 1992 and 2013, or reported as a case of HIV (1980–2013), HCV (1990–2013), or HBV (1990–2013). Testing data were excluded if it preceded a participant's date of birth or occurred more than 7 days after death.
2.3. Co-infection
Individuals were categorized based on their constellation of co-infections (HIV, HCV, and HBV), including single, double, and triple infection combinations (Fig. 1). The negative group included individuals with record of a negative HCV or HIV test, and no records of HIV, HCV, or HBV infection (Supplemental Table 2). Given that testing data was unavailable for HBV, individuals who were not reported as a case of HBV were classified as negative; however, Binka et al. reported over 1 million individuals within the BC-HTC received either a test for HBsAg or anti HBV core total and were not diagnosed with HBV [18].
Fig. 1.

Flowchart illustrating participant selection and stratification for analysis.
2.4. Gender/Sexual Orientation
The gender/sexual orientation variable stratified males into subgroups as men who have sex with men (MSM) and non-MSM. Data on sexual orientation was not available for all testers. We created and validated an indicator predicting MSM status using a subset of HIV data (N = 5382) on which male sexual orientation was known [19]. A penalized generalized linear model was developed to predict whether men may engage in sexual activity with other men (sensitivity: 42%; specificity: 91%) using the following variables: visits to clinics providing services to gay and bisexual men, residence in an area with a higher percentage of men identifying as MSM, HIV and STI testing patterns, previous STI diagnoses, and substance use. Given male-specific stratification, this variable combines gender and predicted sexual orientation as a composite, with three levels: MSM, non-MSM males, and females/unknown.
2.5. Socio-demographics
Age group and diagnostic cohort variables were defined either by the date of diagnosis for the most recent infection, or, if negative, the date of last HIV, HBV, or HCV diagnostic test. The Québec Index of Material and Social Deprivation was used to ascertain neighborhood-level socioeconomic status using Canadian Census data for the dissemination area of residence [20]. The material component of the index was derived from population measures of education, employment, and income, while the social component was derived from measures of marital status and family structure. Urban/rural classification was based on Statistics Canada's definition, where an ‘urban area’ is defined as having a population of at least 1000 and a density of 400 or more people per square kilometer [21]. All territory outside an urban area was defined as rural area.
2.6. Substance Use and Mental Illness
Assessment of injection drug use (IDU), major mental illness, and problematic alcohol use was based on respective diagnostic and fee item codes for medical visits and hospitalizations in respective databases (Supplemental Table 2). The IDU algorithm was validated in the subset of the BC-HTC against interview-based risk factor data [22].
2.7. Statistical Analysis
We described the distribution of demographics and potential risk-factors by co-infection groups. We evaluated the associations between potential exposures, covariates, and co-infection groups using multivariable multinomial logistic regression. Explanatory variables were selected based on hypothesized causal pathways informed by the existing literature, including a recent analysis of the BC-HTC characterizing HIV and HCV syndemics [8]. These included age at diagnosis, gender and sexual orientation, urbanicity, major mental illness, problematic alcohol use, and IDU, as well as social and material deprivation. Year of diagnosis (most recent infection or last test) was also included to adjust for differences in testing patterns throughout the study period.
Given the well-described heterogeneity of risk behaviors among MSM populations, particularly related to drug use, and to understand nature of the syndemic, we investigated their synergistic and modifying effects on the occurrence of various infections using stratified analysis, where the cohort was stratified by IDU, with each subgroup analyzed using multivariate multinomial logistic regression to characterize effect differences. A separate multivariable multinomial logistic regression analysis also included an interaction term between IDU and gender/sexual orientation to further explore potential heterogeneity of effect.
Data cleaning, descriptive analysis, and visualization were performed using R statistical software (version 3.3.2), while SAS (version 9.4) was used for multivariate multinomial logistic regression.
Ethics approval was obtained through the Behavioral Research Ethics Board at the University of British Columbia (H15-01776).
3. Results
A total of 1,376,989 individuals were included in the cohort, 1,276,290 of which were classified as negative for HIV, HBV, and/or HCV. The majority of infected individuals had a single infection, the most common of which was HCV mono-infection (N = 59,096; Fig. 2). Considerably fewer individuals had dual infections, the most prevalent of which included HBV/HCV (n = 3991) and HIV/HCV (n = 3459). Only 1180 individuals had triple infection. Those with HIV more frequently (51.2%) had dual or triple infections than those with HBV (18.0%) or HCV (12.7%) infections (Supplemental Table 3).
Fig. 2.
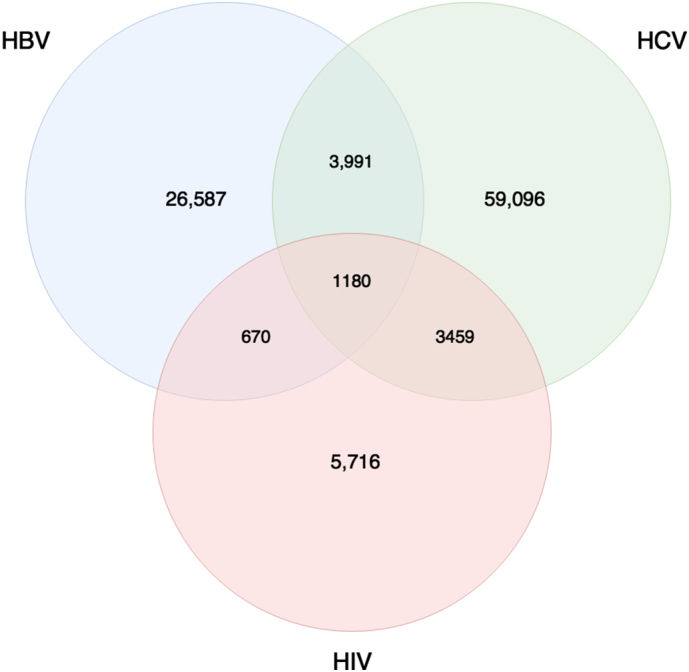
Venn diagram illustrating the number of individuals within each co-infection group.
3.1. Characteristics of Co-infection Groups
The demographic and risk factor distribution varied between co-infection and mono-infection categories (Table 1). Age at most recent diagnosis or test was similar across co-infection groups, with the majority of individuals in the 25–44 year groups; however, the distribution was broader among uninfected individuals (Supplemental Fig. 1). The proportion of MSM was the highest among those with HIV mono- (28.7%) and HBV/HIV co-infection (25.8%) while lowest in people with HCV mono- (1%) and HBV/HCV co-infection (0.8%).
Table 1.
Descriptive analysis of demographics, risk factors, and co-morbidities stratified by HBV, HCV, and HIV co-infection groups, the BC-HTC, 1990–2013.
| Variable | Negative (n (%)) |
HBV (n (%)) |
HBV HCV (n (%)) |
HBV HIV (n (%)) |
HBV HIV HCV (n (%)) |
HCV (n (%)) |
HIV (n (%)) |
HIV HCV (n (%)) |
|---|---|---|---|---|---|---|---|---|
| Gender/sexual orientation | ||||||||
| MSM | 65,523 (5.13) | 1241 (4.67) | 31 (0.78) | 173 (25.82) | 58 (4.92) | 645 (1.09) | 1643 (28.74) | 254 (7.34) |
| Non-MSM males | 457,987 (35.88) | 12,612 (47.44) | 2638 (66.1) | 435 (64.93) | 743 (62.97) | 37,562 (63.56) | 3179 (55.62) | 2231 (64.5) |
| Females | 752,614 (58.97) | 12,732 (47.89) | 1322 (33.12) | 62 (9.25) | 379 (32.12) | 20,884 (35.34) | 894 (15.64) | 973 (28.13) |
| Unknown | 166 (0.01) | 2 (0.01) | 0 (0) | 0 (0) | 0 (0) | 5 (0.01) | 0 (0) | 1 (0.03) |
| Age at most recent diagnosis or test | ||||||||
| < 25 | 356,722 (27.95) | 6755 (25.41) | 429 (10.75) | 77 (11.49) | 136 (11.53) | 8368 (14.16) | 1200 (20.99) | 602 (17.4) |
| 25–34 | 342,780 (26.86) | 7352 (27.65) | 1061 (26.58) | 173 (25.82) | 416 (35.25) | 15,423 (26.1) | 2000 (34.99) | 1216 (35.15) |
| 35–44 | 216,450 (16.96) | 6193 (23.29) | 1228 (30.77) | 238 (35.52) | 442 (37.46) | 19,005 (32.16) | 1497 (26.19) | 1165 (33.68) |
| 45–54 | 159,281 (12.48) | 3352 (12.61) | 891 (22.33) | 133 (19.85) | 164 (13.9) | 10,724 (18.15) | 677 (11.84) | 399 (11.54) |
| > 54 | 201,057 (15.75) | 2935 (11.04) | 382 (9.57) | 49 (7.31) | 22 (1.86) | 5576 (9.44) | 342 (5.98) | 77 (2.23) |
| Median (IQR) | 37.6 (28.76–51.89) | 38.68 (29.66–49.1) | 44 (35.63–52.53) | 43.27 (35.27–50.48) | 41.01 (34.48–47.28) | 42.87 (34.65–50.91) | 38.1 (31.08–46.79) | 39.36 (32.62–45.74) |
| Urbanicity | ||||||||
| Unknown | 28,672 (2.25) | 518 (1.95) | 93 (2.33) | 25 (3.73) | 19 (1.61) | 2601 (4.4) | 147 (2.57) | 68 (1.97) |
| Yes | 1,116,216 (87.46) | 25,581 (96.22) | 3504 (87.8) | 618 (92.24) | 1103 (93.47) | 49,399 (83.59) | 5262 (92.06) | 3173 (91.73) |
| No | 131,402 (10.3) | 488 (1.84) | 394 (9.87) | 27 (4.03) | 58 (4.92) | 7096 (12.01) | 307 (5.37) | 218 (6.3) |
| Injection drug use | ||||||||
| Yes | 41,940 (3.29) | 371 (1.4) | 1413 (35.4) | 81 (12.09) | 845 (71.61) | 10,566 (17.88) | 255 (4.46) | 1604 (46.37) |
| No | 1,234,350 (96.71) | 26,216 (98.6) | 2578 (64.6) | 589 (87.91) | 335 (28.39) | 48,530 (82.12) | 5461 (95.54) | 1855 (53.63) |
| Problematic alcohol use | ||||||||
| Yes | 53,310 (4.18) | 428 (1.61) | 1064 (26.66) | 74 (11.04) | 511 (43.31) | 9225 (15.61) | 319 (5.58) | 1042 (30.12) |
| No | 1,222,980 (95.82) | 26,159 (98.39) | 2927 (73.34) | 596 (88.96) | 669 (56.69) | 49,871 (84.39) | 5397 (94.42) | 2417 (69.88) |
| Major mental illness | ||||||||
| Yes | 158,725 (12.44) | 1258 (4.73) | 957 (23.98) | 177 (26.42) | 509 (43.14) | 9364 (15.85) | 765 (13.38) | 913 (26.39) |
| No | 1,117,565 (87.56) | 25,329 (95.27) | 3034 (76.02) | 493 (73.58) | 671 (56.86) | 49,732 (84.15) | 4951 (86.62) | 2546 (73.61) |
| Social deprivation | ||||||||
| Unknown | 20,444 (1.6) | 586 (2.2) | 113 (2.83) | 28 (4.18) | 36 (3.05) | 2461 (4.16) | 174 (3.04) | 114 (3.3) |
| Q1 | 228,681 (17.92) | 6565 (24.69) | 397 (9.95) | 52 (7.76) | 60 (5.08) | 6306 (10.67) | 486 (8.5) | 199 (5.75) |
| Q2 | 224,238 (17.57) | 5691 (21.41) | 484 (12.13) | 63 (9.4) | 103 (8.73) | 7485 (12.67) | 593 (10.37) | 302 (8.73) |
| Q3 | 230,322 (18.05) | 4422 (16.63) | 640 (16.04) | 63 (9.4) | 166 (14.07) | 9775 (16.54) | 654 (11.44) | 418 (12.08) |
| Q4 | 264,545 (20.73) | 4582 (17.23) | 819 (20.52) | 108 (16.12) | 236 (20) | 12,216 (20.67) | 1097 (19.19) | 694 (20.06) |
| Q5 | 308,060 (24.14) | 4741 (17.83) | 1538 (38.54) | 356 (53.13) | 579 (49.07) | 20,853 (35.29) | 2712 (47.45) | 1732 (50.07) |
| Material deprivation | ||||||||
| Unknown | 20,444 (1.6) | 586 (2.2) | 113 (2.83) | 28 (4.18) | 36 (3.05) | 2461 (4.16) | 174 (3.04) | 114 (3.3) |
| Q1 | 278,306 (21.81) | 4342 (16.33) | 464 (11.63) | 228 (34.03) | 156 (13.22) | 7536 (12.75) | 1873 (32.77) | 503 (14.54) |
| Q2 | 244,044 (19.12) | 4302 (16.18) | 618 (15.48) | 101 (15.07) | 166 (14.07) | 9121 (15.43) | 974 (17.04) | 458 (13.24) |
| Q3 | 249,522 (19.55) | 5032 (18.93) | 648 (16.24) | 91 (13.58) | 143 (12.12) | 10,486 (17.74) | 758 (13.26) | 463 (13.39) |
| Q4 | 254,427 (19.93) | 5935 (22.32) | 917 (22.98) | 85 (12.69) | 218 (18.47) | 13,051 (22.08) | 853 (14.92) | 673 (19.46) |
| Q5 | 229,547 (17.99) | 6390 (24.03) | 1231 (30.84) | 137 (20.45) | 461 (39.07) | 16,441 (27.82) | 1084 (18.96) | 1248 (36.08) |
| Active Tb | ||||||||
| Yes | 3637 (0.28) | 177 (0.67) | 39 (0.98) | 12 (1.79) | 73 (6.19) | 247 (0.42) | 126 (2.20) | 137 (3.96) |
| No | 1,272,653 (99.72) | 26,410 (99.33) | 3952 (99.02) | 658 (98.21) | 1107 (93.81) | 58,849 (99.58) | 5590 (97.80) | 3322 (96.04) |
| Hepatitis B | ||||||||
| None | 1,276,290 (100) | 0 (0) | 0 (0) | 0 (0) | 0 (0) | 59,096 (100) | 5716 (100) | 3459 (100) |
| Acute | 0 (0) | 1052 (3.96) | 597 (14.96) | 69 (10.3) | 112 (9.49) | 0 (0) | 0 (0) | 0 (0) |
| Chronic | 0 (0) | 25,535 (96.04) | 3394 (85.04) | 601 (89.7) | 1068 (90.51) | 0 (0) | 0 (0) | 0 (0) |
| Hepatitis C | ||||||||
| None | 1,276,290 (100) | 26,587 (100) | 0 (0) | 670 (100) | 0 (0) | 0 (0) | 5716 (100) | 0 (0) |
| Seroconverter | 0 (0) | 0 (0) | 429 (10.75) | 0 (0) | 171 (14.49) | 6584 (11.14) | 0 (0) | 694 (20.1) |
| Prevalent | 0 (0) | 0 (0) | 3562 (89.25) | 0 (0) | 1009 (85.51) | 52,512 (88.86) | 0 (0) | 2765 (79.9) |
A majority of individuals among all groups lived in urban areas, with the lowest proportion of urban dwellers among those with HCV mono-infection (83.6%). Individuals with HCV co-infections resided in the most materially deprived areas, including those with triple infection (39.1%), as well as HCV/HIV (36.1%) and HBV/HCV (30.8%) infections. In contrast, individuals with HIV mono- and co-infections resided in the most socially deprived areas, including those with triple infections (49.1%), dual HCV/HIV (50.1%) and HBV/HIV (53.1%) infections, and HIV mono-infection (47.5%).
Individuals with triple infections had the highest proportion of IDU (71.6%), problematic alcohol use (43.3%), and major mental illness (43.1%), followed by those with HIV/HCV (46.4%, 30.1%, 26.4%) and HBV/HCV (35.4%, 26.7%, 26.4%), respectively. Individuals with HBV mono-infection had the lowest proportion of IDU (1.4%), problematic alcohol use (1.6%), and major mental illness (4.7%), followed by the negative group (3.3%, 4.2%, 12.4%) (Table 1).
3.2. Factors Associated With Co-infection Groups
Classification as MSM was associated with higher odds of all HIV infection groups (Table 2), although the effect was greatest for HBV/HIV (OR 6.8; 95% CI: 5.6, 8.27), followed by triple infection (OR 5.21; 95% CI: 3.89, 6.97), and HIV mono-infection (OR 5.08; 95% CI: 4.75, 5.43). MSM were less likely to have HBV/HCV co-infection (OR 0.4; 95% CI: 0.28, 0.58) and HCV mono-infection (OR 0.28; 95% CI: 0.26, 0.31). Being female or unknown was associated with reduced odds of positivity for all mono- or co-infections.
Table 2.
Odds ratios derived from a multivariable multinomial logistic regression model characterizing the association of demographic, risk factor, and co-morbidity variables with HBV, HCV and HIV infection groups, the BC-HTC, 1990–2013.
| Variable | HBV (OR (95% CI)) |
HBV HCV (OR (95% CI)) |
HBV HIV (OR (95% CI)) |
HBV HIV HCV (OR (95% CI)) |
HCV (OR (95% CI)) |
HIV (OR (95% CI)) |
HIV HCV (OR (95% CI)) |
|---|---|---|---|---|---|---|---|
| Age group | |||||||
| < 25 | 1.94 (1.86, 2.03) | 1.02 (0.89, 1.18) | 1.26 (0.88, 1.82) | 3.27 (2.07, 5.17) | 1.34 (1.29, 1.39) | 2.52 (2.22, 2.84) | 5.78 (4.54, 7.35) |
| 24–34 | 2 (1.91, 2.09) | 1.99 (1.76, 2.25) | 2.53 (1.83, 3.49) | 7.25 (4.69, 11.22) | 2.24 (2.17, 2.32) | 4.11 (3.66, 4.62) | 9.33 (7.39, 11.78) |
| 35–44 | 2.24 (2.14, 2.34) | 2.95 (2.62, 3.32) | 4.53 (3.32, 6.19) | 10.79 (6.98, 16.66) | 3.49 (3.38, 3.6) | 4.11 (3.65, 4.62) | 11.82 (9.36, 14.92) |
| 45–54 | 1.83 (1.74, 1.93) | 3.96 (3.5, 4.48) | 4.4 (3.16, 6.12) | 9.15 (5.83, 14.36) | 3.1 (2.99, 3.21) | 2.98 (2.62, 3.4) | 7.85 (6.14, 10.05) |
| > 54 | 1 | 1 | 1 | 1 | 1 | 1 | 1 |
| Gender and sexual orientation | |||||||
| Non-MSM male | 1 | 1 | 1 | 1 | 1 | 1 | 1 |
| MSM | 1.11 (1.04, 1.18) | 0.4 (0.28, 0.58) | 6.8 (5.6, 8.27) | 5.21 (3.89, 6.97) | 0.28 (0.26, 0.31) | 5.08 (4.75, 5.43) | 3.55 (3.09, 4.09) |
| Female/unknown | 0.71 (0.69, 0.72) | 0.41 (0.38, 0.44) | 0.11 (0.08, 0.14) | 0.4 (0.35, 0.45) | 0.43 (0.42, 0.44) | 0.2 (0.18, 0.21) | 0.35 (0.32, 0.38) |
| Major mental illness | |||||||
| Yes | 0.45 (0.42, 0.48) | 0.88 (0.81, 0.96) | 2.15 (1.78, 2.6) | 1.2 (1.05, 1.37) | 0.75 (0.73, 0.78) | 1.12 (1.03, 1.21) | 0.78 (0.71, 0.85) |
| No | 1 | 1 | 1 | 1 | 1 | 1 | 1 |
| Urbanicity | |||||||
| Yes | 7.02 (6.42, 7.69) | 1.23 (1.11, 1.38) | 2.08 (1.4, 3.07) | 2.11 (1.6, 2.77) | 0.96 (0.93, 0.98) | 1.65 (1.47, 1.86) | 1.65 (1.43, 1.91) |
| No | 1 | 1 | 1 | 1 | 1 | 1 | 1 |
| Problematic alcohol use | |||||||
| Yes | 0.5 (0.45, 0.55) | 2.55 (2.34, 2.78) | 1.29 (0.98, 1.68) | 2.73 (2.38, 3.13) | 1.94 (1.88, 2) | 1.12 (0.99, 1.27) | 2.62 (2.39, 2.86) |
| No | 1 | 1 | 1 | 1 | 1 | 1 | 1 |
| Intravenous drug use | |||||||
| Yes | 0.75 (0.68, 0.84) | 16.11 (14.82, 17.52) | 4.13 (3.16, 5.39) | 64.19 (55.11, 74.77) | 6.05 (5.87, 6.24) | 1.6 (1.39, 1.83) | 23.23 (21.32, 25.31) |
| No | 1 | 1 | 1 | 1 | 1 | 1 | 1 |
| Social deprivation | |||||||
| 1 | 1 | 1 | 1 | 1 | 1 | 1 | 1 |
| 2 | 0.91 (0.88, 0.94) | 1.13 (0.99, 1.29) | 1.18 (0.81, 1.7) | 1.55 (1.12, 2.14) | 1.17 (1.13, 1.21) | 1.21 (1.07, 1.36) | 1.46 (1.22, 1.75) |
| 3 | 0.73 (0.7, 0.76) | 1.32 (1.17, 1.51) | 1.15 (0.8, 1.67) | 2.09 (1.54, 2.83) | 1.41 (1.36, 1.45) | 1.31 (1.16, 1.48) | 1.81 (1.52, 2.15) |
| 4 | 0.69 (0.67, 0.72) | 1.53 (1.35, 1.73) | 1.7 (1.22, 2.37) | 2.54 (1.9, 3.39) | 1.59 (1.54, 1.64) | 1.9 (1.7, 2.11) | 2.61 (2.22, 3.07) |
| 5 | 0.54 (0.52, 0.56) | 2.05 (1.83, 2.3) | 3.51 (2.62, 4.72) | 3.68 (2.8, 4.83) | 2.16 (2.1, 2.23) | 3.14 (2.85, 3.47) | 4.18 (3.6, 4.85) |
| Missing | 1.81 (1.63, 2.01) | 5.55 (4.32, 7.13) | 3.5 (1.99, 6.13) | 10.19 (6.31, 16.45) | 5.62 (5.26, 6.01) | 3.09 (2.5, 3.83) | 10.14 (7.7, 13.36) |
| Material deprivation | |||||||
| 1 | 1 | 1 | 1 | 1 | 1 | 1 | 1 |
| 2 | 1.06 (1.01, 1.1) | 1.36 (1.2, 1.53) | 0.6 (0.47, 0.76) | 1.1 (0.87, 1.37) | 1.29 (1.25, 1.33) | 0.73 (0.67, 0.79) | 1.01 (0.89, 1.15) |
| 3 | 1.26 (1.2, 1.31) | 1.36 (1.2, 1.53) | 0.56 (0.44, 0.72) | 0.88 (0.7, 1.12) | 1.41 (1.37, 1.46) | 0.58 (0.53, 0.63) | 0.98 (0.86, 1.11) |
| 4 | 1.49 (1.43, 1.55) | 1.78 (1.58, 1.99) | 0.49 (0.38, 0.63) | 1.23 (0.99, 1.52) | 1.64 (1.59, 1.69) | 0.61 (0.56, 0.67) | 1.28 (1.14, 1.45) |
| 5 | 1.64 (1.58, 1.71) | 2.24 (2.01, 2.5) | 0.73 (0.59, 0.91) | 2.22 (1.84, 2.69) | 2.05 (1.99, 2.12) | 0.78 (0.72, 0.85) | 2.12 (1.91, 2.37) |
IDU was associated with increased odds of all infections, except HBV mono-infection (OR: 0.75; 95% CI: 0.68, 0.84). The association was the greatest for triple infection (OR 64.19; 95% CI: 55.11, 74.77), followed by HIV/HCV (OR 23.23; 95% CI: 21.32, 25.31) and HBV/HCV (OR 16.11; 95% CI: 14.82, 17.52). Problematic alcohol use demonstrated a similar pattern of association, with positive, albeit smaller, associations for all co-infection groups, except HBV mono-infection (OR 0.5; 95% CI: 0.45, 0.55). Smaller associations were observed for major mental illness with greater directional variability. The greatest association with major mental illness was observed for HBV/HIV co-infection (OR 2.15; 95% CI: 1.78, 2.6), while people with major mental illness were less likely to be positive for HBV mono-infection (OR 0.45; 95% CI: 0.42, 0.48).
Urbanicity was associated with higher odds of most mono- and co-infections, particularly HBV mono-infection (OR 7.02; 95% CI: 6.42, 7.69). Residing in areas with high social deprivation (5th quintile) was also associated with higher odds of most co-infections; however, lower odds of HBV mono-infection (OR 0.54; 95% CI: 0.52, 0.56). Those with missing social deprivation data due to lack of address or census suppression had considerably higher odds of all infections, particularly triple infection (OR 10.19; 95% CI: 6.31, 16.45) and HCV/HIV (10.14; 95% CI: 7.7, 13.36). A paradoxical pattern of association was observed for material deprivation. High material deprivation (5th quintile) was associated with higher odds of HBV mono-infection (OR 1.64; 95% CI: 1.58, 1.71), HCV mono-infection (OR: 2.05; 95% CI: 1.99, 2.12), HBV/HCV co-infection (OR: 2.24; 95% CI: 2.01, 2.5), HCV/HIV co-infection (OR: 2.12; 95% CI: 1.91, 2.37), and triple infection (OR: 2.22; 95% CI: 1.84, 2.69), while odds of HIV mono-infection (OR 0.78; 95% CI: 0.72, 0.85) and HBV/HIV co-infection (OR 0.73; 95% CI: 0.59, 0.91) were lower among those with higher material deprivation (Fig. 3).
Fig. 3.

Comparison of OR for HBV, HCV, and HIV co-infection groups derived from multivariable multinomial logistic regression model stratified by selected characteristics, the BC-HTC, 1990–2013. Dotted line represent OR of 1, null effect.
3.3. Effect Modification Through Injection Drug Use
We stratified the regression models by IDU status to understand if the effect of various factors differs by IDU (Table 3). Overall, the association of various factors with infection groups differed between individuals with and without a history of IDU. Notable among these included the association between being MSM and IDU with higher odds of various infections, and among non-IDU having major mental illnesses, problematic alcohol consumption, and residence in areas with high material deprivation being associated with higher odds of various coinfection and triple infection groups. MSM who used intravenous drugs had 2–4 times higher odds of HBV, HIV, HBV/HIV, HCV/HIV and HBV/HCV/HIV compared to non-MSM (Table 3).
Table 3.
Odds ratios derived from a multivariable multinomial logistic regression model characterizing the association of demographic, risk factor, and co-morbidity variables with HBV, HCV and HIV infection groups stratified by IDU and non-IDU subgroups, the BC-HTC, 1990–2013.
| Variable | HBV (OR (95% CI)) |
HBV HCV (OR (95% CI)) |
HBV HIV (OR (95% CI)) |
HBV HIV HCV (OR (95% CI)) |
HCV (OR (95% CI)) |
HIV (OR (95% CI)) |
HIV HCV (OR (95% CI)) |
|||||||
|---|---|---|---|---|---|---|---|---|---|---|---|---|---|---|
| IDU | Non-IDU | IDU | Non-IDU | IDU | Non-IDU | IDU | Non-IDU | IDU | Non-IDU | IDU | Non-IDU | IDU | Non-IDU | |
| Age < 24 | 1.19 (0.72, 1.98) | 1.94 (1.85, 2.02) | 0.84 (0.6, 1.19) | 1.07 (0.91, 1.26) | 1.42 (0.4, 4.99) | 1.19 (0.81, 1.76) | 2.73 (1.39, 5.35) | 4.24 (2.22, 8.12) | 2.51 (2.12, 2.96) | 1.19 (1.15, 1.24) | 3.98 (1.45, 10.95) | 2.49 (2.19, 2.81) | 3.97 (2.5, 6.31) | 6.14 (4.6, 8.2) |
| Age 24–34 | 1.22 (0.74, 2.01) | 2 (1.91, 2.09) | 1.49 (1.08, 2.05) | 2.15 (1.88, 2.46) | 1.8 (0.54, 5.99) | 2.55 (1.82, 3.58) | 5.58 (2.91, 10.7) | 9.14 (5.02, 16.66) | 3.21 (2.72, 3.78) | 2.17 (2.09, 2.24) | 4.15 (1.52, 11.34) | 4.16 (3.7, 4.68) | 5.01 (3.18, 7.91) | 11.87 (9.02, 15.61) |
| Age 35–44 | 1.17 (0.7, 1.96) | 2.25 (2.15, 2.35) | 2.1 (1.53, 2.89) | 3.04 (2.67, 3.46) | 1.83 (0.55, 6.16) | 4.89 (3.54, 6.75) | 7.13 (3.72, 13.67) | 13.85 (7.65, 25.07) | 3.55 (3.01, 4.19) | 3.58 (3.47, 3.7) | 3.15 (1.14, 8.71) | 4.21 (3.73, 4.74) | 5.94 (3.77, 9.38) | 14.09 (10.7, 18.54) |
| Age 45–54 | 1.27 (0.74, 2.2) | 1.83 (1.74, 1.93) | 3.16 (2.27, 4.41) | 3.85 (3.36, 4.41) | 1.75 (0.47, 6.46) | 4.67 (3.32, 6.57) | 6.64 (3.39, 13) | 9.54 (5.09, 17.9) | 2.7 (2.27, 3.22) | 3.19 (3.08, 3.31) | 3.15 (1.1, 9.01) | 3 (2.63, 3.43) | 4.37 (2.71, 7.04) | 8.67 (6.47, 11.61) |
| MSM v non-MSM male | 5.23 (2.91, 9.4) | 1.09 (1.03, 1.16) | 0.6 (0.14, 2.51) | 0.35 (0.24, 0.51) | 24.27 (11.17, 52.74) | 6.33 (5.17, 7.75) | 9.41 (4.95, 17.91) | 3.66 (2.59, 5.17) | 0.29 (0.17, 0.52) | 0.28 (0.25, 0.3) | 18.21 (11.97, 27.69) | 4.97 (4.65, 5.32) | 6.81 (4.23, 10.97) | 2.97 (2.55, 3.46) |
| Female/unknown v non-MSM male | 0.8 (0.65, 0.99) | 0.7 (0.68, 0.72) | 0.95 (0.84, 1.07) | 0.32 (0.29, 0.35) | 0.25 (0.14, 0.47) | 0.09 (0.07, 0.13) | 0.86 (0.74, 1) | 0.15 (0.11, 0.21) | 0.83 (0.79, 0.88) | 0.39 (0.39, 0.4) | 0.46 (0.34, 0.61) | 0.19 (0.17, 0.2) | 0.79 (0.71, 0.89) | 0.22 (0.2, 0.25) |
| Major mental illness | 0.92 (0.74, 1.14) | 0.42 (0.39, 0.45) | 0.66 (0.59, 0.75) | 1.01 (0.89, 1.15) | 1.43 (0.89, 2.29) | 2.27 (1.85, 2.79) | 0.87 (0.74, 1.01) | 1.82 (1.36, 2.42) | 0.56 (0.53, 0.59) | 0.85 (0.82, 0.88) | 0.79 (0.61, 1.02) | 1.15 (1.06, 1.26) | 0.57 (0.51, 0.64) | 1.01 (0.87, 1.17) |
| Urban vs rural | 2.95 (1.74, 4.98) | 7.14 (6.51, 7.83) | 1.48 (1.19, 1.83) | 1.2 (1.05, 1.36) | 0.82 (0.37, 1.85) | 2.54 (1.61, 3.99) | 2.39 (1.71, 3.34) | 2.08 (1.29, 3.37) | 1.2 (1.1, 1.3) | 0.93 (0.9, 0.96) | 1.28 (0.8, 2.06) | 1.68 (1.49, 1.9) | 1.78 (1.43, 2.23) | 1.7 (1.41, 2.05) |
| Problematic alcohol use | 3.37 (1.31, 8.65) | 4.41 (3.85, 5.06) | 1.26 (0.72, 2.18) | 1.29 (0.96, 1.72) | 1.82 (0.34, 9.84) | 4.45 (2.24, 8.85) | 0.96 (0.39, 2.4) | 2.31 (1.01, 5.31) | 1.05 (0.83, 1.33) | 1.68 (1.57, 1.78) | 0.35 (0.05, 2.73) | 1.97 (1.55, 2.49) | 0.9 (0.5, 1.62) | 1.56 (1.06, 2.29) |
| Social deprivation (Q5v1) | 1.24 (0.88, 1.75) | 0.53 (0.51, 0.55) | 2.65 (2.07, 3.39) | 1.84 (1.62, 2.1) | 3.33 (1.31, 8.42) | 3.55 (2.6, 4.84) | 3.56 (2.51, 5.04) | 4.03 (2.57, 6.32) | 2.06 (1.87, 2.26) | 2.18 (2.11, 2.25) | 2.67 (1.6, 4.45) | 3.16 (2.86, 3.49) | 3.39 (2.66, 4.31) | 4.8 (3.95, 5.83) |
| Material deprivation (Q5v1) | 0.77 (0.58, 1.03) | 1.66 (1.6, 1.73) | 1.55 (1.27, 1.89) | 2.48 (2.17, 2.83) | 0.6 (0.33, 1.1) | 0.75 (0.59, 0.94) | 1.85 (1.45, 2.36) | 2.28 (1.65, 3.15) | 1.59 (1.46, 1.73) | 2.11 (2.05, 2.18) | 0.94 (0.66, 1.35) | 0.78 (0.72, 0.84) | 1.62 (1.35, 1.93) | 2.37 (2.06, 2.72) |
Odds ratios of HBV/HIV and HBV/HIV/HCV co-infections were slightly higher among those with major mental illness who used intravenous drugs compared to non-IDU (Table 3). Residing in areas with high material deprivation (5th quintile) was significantly associated with higher odds ratios of HBV, HCV, HBV/HCV, and HIV/HCV among non-IDU compared to IDU. The odds were also higher for triple infection, but not significant. Similarly, odds of infections among those with problematic alcohol use were also higher among non-IDU compared to IDU.
Similar heterogeneity was observed with the inclusion of an interaction term between gender and sexual orientation and IDU (Supplemental Table 4). Although results could not be estimated for the MSM/IDU group, non-IDU individuals generally had lower odds of most infections compared to IDU, most noticeably for double and triple infections.
4. Discussion
This is one of the largest population-based cohort studies in North America and the first to incorporate all diagnosed cases of HIV, HCV, and HBV, in addition to individuals testing negative for HCV or/and HIV, within an entire province to characterize co-occurrence of bloodborne infections, mental illness, IDU, and socioeconomic deprivation. We identified that IDU was associated with higher odds of all infection groups, except HBV, with the largest associations with HIV/HCV, HBV/HCV coinfection, and triple infection. MSM also had higher odds of HIV, HBV/HIV, HIV/HCV, and triple infection. HBV mono-infection was primarily associated with urban residence and higher material deprivation. Stratification by IDU identified additional patterns of 2–4 times higher odds of HBV, HIV, HBV/HIV, HCV/HIV and HBV/HCV/HIV among MSM who also injected drugs, compared to those who do not inject drugs. Conversely, among non-IDU, mental illness, problematic alcohol use, and material deprivation were associated with higher odds of various mono- and co-infections. These patterns highlight the presence of syndemics of IDU, sexual practices, mental illness, socioeconomic deprivation, and infections. By better understanding the composition and context of these syndemics, health services and interventions may be tailored to the needs of population groups affected by these syndemics.
Most infections occurred within populations with multiple risk factors. This vulnerability was particularly evident among individuals with triple infection, who were more likely to engage in IDU, have prior mental illness, and be socially and materially deprived. In particular, the magnitude of the IDU association with triple infection was higher than other risk factors. MSM also had higher odds of triple infection, though the magnitude of association was lower than IDU. Similar to triple infection, IDU was also associated with higher odds of other infection groups. The management of IDU with pharmacological (opiate substitution therapy) and non-pharmacological (needle syringe distribution and psychotherapy) interventions is associated with reduction in HCV or HIV infection [23], [24], [25]. Although similar effects are expected for co- and triple-infections, data are lacking. Further evaluation of these and other interventions alone or in combination is necessary to optimize prevention and treatment of these coinfections.
Higher odds of HIV mono- or co-infection were observed among MSM. HIV mono-infection and HBV/HIV co-infection groups had the highest proportion of MSM, with similar demographics and pattern of risk behaviors. While positive associations of IDU were observed for HIV mono-infection and HBV/HIV co-infection groups, the magnitude of the ORs was considerably lower than that for most other co-infections. These findings are also consistent with other studies on HIV/HBV co-infection, where HBV/HIV co-infection was more strongly associated with MSM compared to PWID [7], [26]. Both HIV mono- and HBV/HIV co-infection groups appeared to reside in areas of relatively greater social deprivation, but lesser material deprivation. This supports previous findings for HIV mono-infection and suggests that these individuals may acquire infections through risk behaviors not necessarily correlated with poverty [8].
There has been limited evaluation of the interacting nature of syndemics. In this study, we evaluated the interaction between IDU and being MSM to identify whether co-occurrences of various factors differ by IDU and/or being MSM. Stratification by IDU demonstrated MSM who also use intravenous drugs had 3 times higher odds of triple infection, ~ 4 times the odds of HBV/HIV co-infection and HIV mono-infection, 5 times the odds of HBV, and 2 times the odds of HIV/HCV co-infection compared to non-IDU. This suggests heterogeneity among the MSM population, with infection odds being the highest among those also engaged in IDU. These data are consistent with previous findings among MSM, where IDU has been associated with higher odds of HIV and HCV infection [27], [28], [29], [30]. This highlights the need for management of IDU among MSM population through inclusion and integration of addiction management services with health services provided to MSM population. Currently, addiction services tailored to the MSM population's contextual needs are limited [31]. Since HBV is more likely to co-occur among MSM living with HIV, integration of HBV and liver care with HIV care could further improve their health without much effort, as HBV drugs are also included in anti-retroviral regimens.
IDU stratified analysis also showed that, among those who inject drugs, problematic alcohol use and mental illness were not associated with further increased odds of HCV, HIV, HCV/HIV HBV/HIV co- and triple-infections. However, among non-IDU, mental illness, problematic alcohol use, and material deprivation were associated with higher odds of various mono, co- and triple-infections. Various studies have reported an association between alcohol use and high risk sexual behaviors in various population groups [31]. This highlights the complex interactions between various co-occurring risk factors leading to increased risk of various infections. This also emphasizes that, while management of drug use is essential, mental illness and problematic alcohol use must also be addressed to achieve reduction in risk of infections and other adverse outcomes. Although additional data is needed to characterize the optimal mix of services, this constellation of co-infections, vulnerabilities, and risk behaviors supports integration and co-location of services for management of mental illness and addiction, along with infection management and social support in areas with high rates of co-infections.
In contrast to other co-infection groups, individuals with HBV mono-infection were less likely to live in areas of relative social deprivation; however, the association with material deprivation persisted. The patterns of deprivation may reflect ethnic diversity of the population, where HBV mono-infected individuals are more likely to represent materially deprived immigrants from socially cohesive cultures. Immigration and cultural influences may also underlie the lower odds associated with IDU and alcohol use, as these commonly cited risk behaviors tend to be less prevalent among foreign-born Canadians [32], [33]. This reflects current knowledge of the distribution of HBV in Canada, as sero-prevalence for HBV is high among migrants from HBV endemic countries, particularly in Eastern Asia [18], [34], [35]; however, this hypothesis requires further investigation using linked immigration datasets.
Although strengthened by cohort size and the availability of a large sample of negative individuals, this analysis should be interpreted in the light of several methodological considerations. Given the controls in the cohort were limited to those tested for HCV or HIV, they may not be fully representative of the at risk general population; however, since testing may be precipitated by risk factors, bias may result in underestimation of positive associations. Individuals were considered negative for an infection if there was no record of positive test or case report, which may risk misclassification of those not tested for HIV, HBV, or HCV. Several variables, such as MSM and IDU, were derived using medical visits and hospitalizations, likely leading to greater capture of high risk individuals engaged in care and potential misclassification inherent with these datasets. Despite these limitations, the findings are consistent with those of other studies investigating risk factors and demographics associated with HCV, HBV, and HIV co-infections [6], [7], [8], [12], [13], [14], [15], [16].
While the prevalence of HIV, HCV, and HBV is known to be higher among immigrants and indigenous people, data on these populations were unavailable for analysis. Individuals with no fixed address may be at higher risk; however, despite the elevated risk of infection among those missing addresses, clearer identification of this population is necessary to elucidate the magnitude of risk attributable to inadequate housing.
The co-occurrence of infections and risk factors described in this study suggests the presence of unique syndemics among individuals with HCV, HIV, and HBV in British Columbia. Further analysis is required to better understand the underlying interactions and their effects on acquisition of infections and subsequent outcomes, as well as generalization to other geographies and populations. Identification of these syndemics allows for greater insight into transmission patterns, as well as co-existing conditions that could be utilized for effective management through optimal integration and intensity of various services needed for management of infections and co-occurring socioeconomic deprivation, IDU, and mental illness among various population groups.
Outstanding Questions
-
•
How do the risk factors for co-infection differ within other subpopulations known to have higher burdens of HIV, HBV, and HCV, such as immigrants and indigenous groups?
-
•
How do syndemics of substance use, sexual practices, mental illness, socioeconomic marginalization, and co-infections interact to affect health outcomes?
-
•
How can a syndemic approach be used to inform targeted delivery of healthcare services?
Acknowledgements/Funding
We acknowledge the assistance of BCCDC, PHSA Performance measurement and reporting, Information Analysts, Ministry of Health Data Access, Research and Stewardship, & MSP, DAD and Medical Beneficiary and Pharmaceutical Services program areas, BC Ministry of Health, and BC Cancer Agency and their staff involved in data access and procurement, and data management. Funding was provided by BC Centre for Disease Control and Canadian Institutes of Health Research [Grant # NHC – 142832 and PHE-141773]. The funders of the study had no role in study design, data collection, data analysis, data interpretation, or writing of the manuscript.
Author Contributions
All authors contributed to the design of the study and interpretation of the findings. N.J. and G.M. conceptualized the study. G.M., N.J., Z.B., and S.W. participated in data collection and analysis. G.M. drafted the manuscript, which was critically reviewed by all authors. Authors had full access to all the data in the study and collectively made the decision to submit the paper for publication.
Disclaimer
All inferences, opinions, and conclusions drawn in this modeling projections are those of the authors, and do not reflect the opinions or policies of the Data Steward(s).
Footnotes
Supplementary data to this article can be found online at https://doi.org/10.1016/j.eclinm.2018.10.006.
Appendix A. Supplementary Data
Supplementary material
References
- 1.Blach S., Zeuzem S., Manns M. Global prevalence and genotype distribution of hepatitis C virus infection in 2015: a modelling study. Lancet Gastroenterol Hepatol. 2017;2:161–176. doi: 10.1016/S2468-1253(16)30181-9. [DOI] [PubMed] [Google Scholar]
- 2.Schweitzer A., Horn J., Mikolajczyk R.T., Krause G., Ott J.J. Estimations of worldwide prevalence of chronic hepatitis B virus infection: a systematic review of data published between 1965 and 2013. Lancet. 2015;386:1546–1555. doi: 10.1016/S0140-6736(15)61412-X. [DOI] [PubMed] [Google Scholar]
- 3.Public Health Agency of Canada Summary: estimates of HIV incidence, prevalence and proportion undiagnosed in Canada, 2014. 2015. https://www.canada.ca/en/public-health/services/publications/diseases-conditions/summary-estimates-hiv-incidence-prevalence-proportion-undiagnosed-canada-2014.html Available from:
- 4.GBD 2016 Causes of Death Collaborators AA. Abbafati C., Abbas K.M. Global, regional, and national age-sex specific mortality for 264 causes of death, 1980–2016: a systematic analysis for the Global Burden of Disease Study 2016. Lancet (London, England) 2017;390:1151–1210. doi: 10.1016/S0140-6736(17)32152-9. [DOI] [PMC free article] [PubMed] [Google Scholar]
- 5.Ly K.N., Hughes E.M., Jiles R.B., Holmberg S.D. Rising mortality associated with hepatitis C virus in the United States, 2003–2013. Clin Infect Dis. 2016;62:1287–1288. doi: 10.1093/cid/ciw111. [DOI] [PMC free article] [PubMed] [Google Scholar]
- 6.Zhang F., Zhu H., Wu Y. HIV, hepatitis B virus, and hepatitis C virus co-infection in patients in the China National Free Antiretroviral Treatment Program, 2010–12: a retrospective observational cohort study. Lancet Infect Dis. 2014;14:1065–1072. doi: 10.1016/S1473-3099(14)70946-6. [DOI] [PMC free article] [PubMed] [Google Scholar]
- 7.Prussing C., Chan C., Pinchoff J. HIV and viral hepatitis co-infection in New York City, 2000–2010: prevalence and case characteristics. Epidemiol Infect. 2015;143:1408–1416. doi: 10.1017/S0950268814002209. [DOI] [PMC free article] [PubMed] [Google Scholar]
- 8.Butt Z.A., Shrestha N., Wong S. A syndemic approach to assess the effect of substance use and social disparities on the evolution of HIV/HCV infections in British Columbia. PLoS One. 2017;12 doi: 10.1371/journal.pone.0183609. [DOI] [PMC free article] [PubMed] [Google Scholar]
- 9.Singer M., Bulled N., Ostrach B., Mendenhall E. Syndemics and the biosocial conception of health. Lancet. 2017;389:941–950. doi: 10.1016/S0140-6736(17)30003-X. [DOI] [PubMed] [Google Scholar]
- 10.Singer M., Clair S. Syndemics and public health: reconceptualizing disease in bio-social context. Med Anthropol Q. 2003;17:423–441. doi: 10.1525/maq.2003.17.4.423. [DOI] [PubMed] [Google Scholar]
- 11.Tsai A.C., Mendenhall E., Trostle J.A., Kawachi I. Co-occurring epidemics, syndemics, and population health. Lancet. 2017;389:978–982. doi: 10.1016/S0140-6736(17)30403-8. [DOI] [PMC free article] [PubMed] [Google Scholar]
- 12.Sanchez M.A., Scheer S., Shallow S., Pipkin S., Huang S. Epidemiology of the viral hepatitis-HIV syndemic in San Francisco: a collaborative surveillance approach. Public Health Rep. 2014:95–101. doi: 10.1177/00333549141291S114. [DOI] [PMC free article] [PubMed] [Google Scholar]
- 13.Zhou Y.-H., Yao Z.-H., Liu F.-L. High prevalence of HIV, HCV, HBV and co-infection and associated risk factors among injecting drug users in Yunnan Province, China. PLoS One. 2012;7 doi: 10.1371/journal.pone.0042937. [DOI] [PMC free article] [PubMed] [Google Scholar]
- 14.Ionita G., Malviya A., Rajbhandari R. Seroprevalence of hepatitis B virus and hepatitis C virus co-infection among people living with HIV/AIDS visiting antiretroviral therapy centres in Nepal: a first nationally representative study. Int J Infect Dis. 2017;60:64–69. doi: 10.1016/j.ijid.2017.04.011. [DOI] [PubMed] [Google Scholar]
- 15.Mohammadi M., Talei G., Sheikhian A. Survey of both hepatitis B virus (HBsAg) and hepatitis C virus (HCV-Ab) coinfection among HIV positive patients. Virol J. 2009;6:202. doi: 10.1186/1743-422X-6-202. [DOI] [PMC free article] [PubMed] [Google Scholar]
- 16.Bauer-Staeb C., Jörgensen L., Lewis G., Dalman C., Osborn D.P.J., Hayes J.F. Prevalence and risk factors for HIV, hepatitis B, and hepatitis C in people with severe mental illness: a total population study of Sweden. Lancet Psychiatry. 2017 doi: 10.1016/S2215-0366(17)30253-5. [DOI] [PMC free article] [PubMed] [Google Scholar]
- 17.Janjua N.Z., Kuo M., Chong M. Assessing hepatitis C burden and treatment effectiveness through the British Columbia Hepatitis Testers Cohort (BC-HTC): design and characteristics of linked and unlinked participants. PLoS One. 2016;11 doi: 10.1371/journal.pone.0150176. [DOI] [PMC free article] [PubMed] [Google Scholar]
- 18.Binka M., Butt Z.A., Wong S. Differing profiles of people diagnosed with acute and chronic hepatitis B virus infection in British Columbia, Canada. World J Gastroenterol. 2018;24:1216–1227. doi: 10.3748/wjg.v24.i11.1216. [DOI] [PMC free article] [PubMed] [Google Scholar]
- 19.Butt Z., Shrestha N., Gesink D. Effect of opioid-substitution therapy and mental health counseling on HIV risk among hepatitis C-infected individuals. Clin Epidemiol. 2018;10:1127–1145. doi: 10.2147/CLEP.S173449. [DOI] [PMC free article] [PubMed] [Google Scholar]
- 20.Pampalon R., Hamel D., Gamache P., Philibert M.D., Raymond G., Simpson A. An area-based material and social deprivation index for public health in Québec and Canada. Can J Public Health. 2012;103:S17–S22. doi: 10.1007/BF03403824. [DOI] [PMC free article] [PubMed] [Google Scholar]
- 21.Statistics Canada Population centre and rural area classification 2016. 2017. http://www.statcan.gc.ca/eng/subjects/standard/pcrac/2016/introduction Available from:
- 22.Janjua N.Z., Islam N., Kuo M. Identifying injection drug use and estimating population size of people who inject drugs using healthcare administrative datasets. Int J Drug Policy. 2018;55:31–39. doi: 10.1016/j.drugpo.2018.02.001. [DOI] [PubMed] [Google Scholar]
- 23.Islam N., Krajden M., Shoveller J. Incidence, risk factors, and prevention of hepatitis C reinfection: a population-based cohort study. Lancet Gastroenterol Hepatol. 2017;2:200–210. doi: 10.1016/S2468-1253(16)30182-0. [DOI] [PubMed] [Google Scholar]
- 24.MacArthur G.J., Minozzi S., Martin N. Opiate substitution treatment and HIV transmission in people who inject drugs: systematic review and meta-analysis. BMJ. 2012;345 doi: 10.1136/bmj.e5945. [DOI] [PMC free article] [PubMed] [Google Scholar]
- 25.Platt L., Minozzi S., Reed J. Needle and syringe programmes and opioid substitution therapy for preventing HCV transmission among people who inject drugs: findings from a Cochrane Review and meta-analysis. Addiction. 2017 doi: 10.1111/add.14012. [published online Oct 23] [DOI] [PMC free article] [PubMed] [Google Scholar]
- 26.Kim J.H., Psevdos G., Suh J., Sharp V.L. Co-infection of hepatitis B and hepatitis C virus in human immunodeficiency virus-infected patients in New York City, United States. World J Gastroenterol. 2008;14:6689–6693. doi: 10.3748/wjg.14.6689. [DOI] [PMC free article] [PubMed] [Google Scholar]
- 27.Hegazi A., Lee M.J., Whittaker W. Chemsex and the city: sexualised substance use in gay bisexual and other men who have sex with men attending sexual health clinics. Int J STD AIDS. 2017;28:362–366. doi: 10.1177/0956462416651229. [DOI] [PubMed] [Google Scholar]
- 28.Balaji A.B., Bowles K.E., Le B.C., Paz-Bailey G., Oster A.M., NHBS Study Group High HIV incidence and prevalence and associated factors among young MSM, 2008. AIDS. 2013;27:269–278. doi: 10.1097/QAD.0b013e32835ad489. [DOI] [PMC free article] [PubMed] [Google Scholar]
- 29.Remis R.S., Liu J., Loutfy M.R. Prevalence of sexually transmitted viral and bacterial infections in HIV-positive and HIV-negative men who have sex with men in Toronto. PLoS One. 2016;11 doi: 10.1371/journal.pone.0158090. [DOI] [PMC free article] [PubMed] [Google Scholar]
- 30.Marcellin F., Lorente N., Demoulin B. Comparison of risk factors in HIV-infected men who have sex with men, coinfected or not with hepatitis C virus (ANRS VESPA2 French cross-sectional national survey) Sex Transm Infect. 2015;91:21–23. doi: 10.1136/sextrans-2014-051542. [DOI] [PubMed] [Google Scholar]
- 31.Bourne A., Weatherburn P. Substance use among men who have sex with men: patterns, motivations, impacts and intervention development need. Sex Transm Infect. 2017;93:342–346. doi: 10.1136/sextrans-2016-052674. [DOI] [PubMed] [Google Scholar]
- 32.Agic B., Mann R.E., Tuck A. Alcohol use among immigrants in Ontario, Canada. Drug Alcohol Rev. 2016;35:196–205. doi: 10.1111/dar.12250. [DOI] [PubMed] [Google Scholar]
- 33.Ali J.S., McDermott S., Gravel R.G. Recent research on immigrant health from statistics Canada's population surveys. Can J Public Health. 2004;95:I9–13. doi: 10.1007/BF03403659. [DOI] [PMC free article] [PubMed] [Google Scholar]
- 34.Rossi C., Shrier I., Marshall L. Seroprevalence of chronic hepatitis B virus infection and prior immunity in immigrants and refugees: a systematic review and meta-analysis. PLoS One. 2012;7 doi: 10.1371/journal.pone.0044611. [DOI] [PMC free article] [PubMed] [Google Scholar]
- 35.Sharma S., Carballo M., Feld J.J., Janssen H.L.A. Immigration and viral hepatitis. J Hepatol. 2015;63:515–522. doi: 10.1016/j.jhep.2015.04.026. [DOI] [PubMed] [Google Scholar]
Associated Data
This section collects any data citations, data availability statements, or supplementary materials included in this article.
Supplementary Materials
Supplementary material