Abstract
Background
Serum ferritin is a useful tumor marker for renal cell carcinoma (RCC). However, the expression of ferritin heavy chain (FTH1), the main subunit of ferritin, is unclear in primary RCC tissues. In this study, we investigated FTH1 mRNA expression and its diagnostic and prognostic value in RCC.
Material/Methods
The mRNA expression of FTH1 was analyzed using including Oncomine, Gene Expression Omnibus, and Cancer Genome Atlas datasets, while the protein level of FTH1 was analyzed using the Human Protein Atlas database. The associations between FTH1 and clinicopathologic characteristics and survival time and Cox multivariate survival analysis were analyzed using SPSS 22.0 software. A meta-analysis was performed to assess consistency of FTH1 expression. GO, KEGG, and PPI analyses were used to predict biological functions.
Results
According to TCGA data, overexpression of FTH1 was detected in 890 RCC tissues (15.2904±0.63157) compared to 129 normal kidney tissues (14.4502±0.51523, p<0.001). Among the clinicopathological characteristics evaluated, patients with increased pathologic T staging, lymph node metastasis, and distant metastasis were significantly associated with higher expression of FTH1. Elevated FTH1 mRNA levels were correlated with worse prognosis of RCC patients. Cox multivariate survival analysis indicated that age, stage, and M stage were predictors of poor prognosis in patients with RCC.
Conclusions
Our data suggest that FTH1 expression is an effective prognostic and diagnosis biomarker for RCC.
MeSH Keywords: Apoferritins; Carcinoma, Renal Cell; Computational Biology; Diagnosis; Prognosis
Background
In 2018, the new incidence of renal cell carcinoma (RCC) ranked sixth among all kinds of tumors, and the death rate ranked eighth [1]. It is estimated that 14 000 people died of RCC in 2012. The incidence of RCC varies geographically [2]. For example, the Czech Republic had the highest incidence in the world. The incidence in Nordic and Eastern Europe, North America, and Australia increased, but was relatively lower in Africa and Southeast Asia [3]. The reasons for the higher incidence in developed countries are not yet clear. Genomics, occupation, environmental exposures, and smoking are implicated [2].
RCC is divided into many different histological types. The clear cell type accounts for 70.90% of all RCC, followed by papilla (10–15%) and chromophobe RCCs (3–5%). Clear cell RCC is worse than papillary or chromophobe RCC, and is more likely to occur in late stage or metastasis [4,5]. In 90% of clear cell RCCs, tumors exhibit alteration the von Hippel-Lindau tumor suppressor (VHL) gene through genetic or epigenetic mechanisms [6,7]. The inactivation of VHL leads to a lower ubiquitination of hypoxia induced factor (HIF-α) and subsequently induces the expression of vascular endothelial growth factor (VEGF), both strictly linked to tumor angiogenesis [8]. VHL and VEGF has been validated as predictive and prognostic markers in RCC [9]. Further insights into the molecular biology of RCC could help find novel molecular biomarkers and potential targets for early diagnosis and precise treatment.
Elevated serum ferritin has been proved to play an important role in iron transport, angiogenesis, inflammation, immunity, signal transduction, and cancer in many human diseases [10]. Ferritin consists of 24 polypeptide subunits of heavy chain (FTH1) and light chain (FTL) [11,12]. In patients with RCC, serum ferritin concentration is significantly higher than in normal controls [13], and even associates with the presence of distant metastasis [14]. It is suggested that serum ferritin may be a useful tumor marker for renal cell carcinoma.
Ferritin consists of the heavy and light chains, encoded by FTH1 and FTL1 genes, respectively. FTH1 is differentially and abnormally expressed in tissues from multiple malignancies, including astrocytic brain tumors [15], prostate cancer [16], and breast cancer [17]. FTH1 has recently been considered a good prognostic protein for triple-negative breast cancer (TNBC) patients [17]. However, the expression of FTH1 is unclear in RCC.
The purpose of this study was to analyze the difference between FTH1 gene expression in RCC and normal renal tissues, and to explore the relationship between FTH1 gene expression and clinical characteristics and prognosis of RCC.
Material and Methods
The Cancer Genome Atlas (TCGA) database analysis
TCGA is a huge repository of high-throughput data of DNA, RNA, and protein in a variety of human cancers, which is helpful in comprehensive analysis of the expression of these components in various cancer types [18]. The data of FTH1 mRNA expression in primary RCC and normal control samples, as well as clinicopathological characteristics of patients, were obtained from TCGA database (https://xena.ucsc.edu/). SPSS 22.0 software was used to analyze the differential expression of FTH1 in RCC and the relationship between FTH1 level and clinicopathological parameters and Cox multivariate survival. The survival curve was analyzed using GraphPad software.
Oncomine database analysis
Oncomine databases are online collections of microarrays from various sources, often associated with cancer, and contain many “multiple arrays” (collections of microarrays analyzed in a single study) [19]. The relative expression level of “FTH1” gene was searched in the “kidney cancer” dataset in the analysis type of “cancer vs. normal analysis”.
Selection of studies and microarrays in GEO datasets
The mRNA expression of FTH1 in RCC was investigated in GEO database, with search terms as follow: 1) “renal cancer”, 2) “kidney OR renal AND cancer OR carcinoma OR tumor OR neoplasm* OR malignant*”. Microarray was used to examine the expression of FTH1 in RCC tissues and normal tissues, including meta-analysis. The criteria of inclusion were: 1) have more than 6 samples, and 2) sampled FTH1 from human tissues.
Real-time reverse transcription polymerase chain reaction
The transcriptional level of FTH1 was confirmed in normal renal epithelial cell 293 and renal cancer cell 786-0, which were stored in our lab. cDNA of primary renal cell carcinoma tissues and matched adjacent tissues were obtained from Shanghai Outdo Biotech Co. (Shanghai, China; Cat no: MecDNA-HKidE030CS01). The relative expression levels of FTH1 were detected using the Power SYBR Green PCR Master Mix (Foster City, CA, USA, Applied Biosystem) in a QuantStudio 5 Real-Time PCR System (Foster City, CA, USA, Applied Biosystem). After the reactions were completed, the comparative threshold cycle (Ct) method was used to calculate the relative gene expression. The sequences of primers used were as follows:
FTH11-Forward, 5′-AAGCTGCAGAACCAACGAGG-3′,
FTH1-Reverse, 5′-AGTCACACAAATGGGGGTCATT-3′;
GAPDH1-Forward, 5′-AAGCTCACTGGCATGGCCTT-3′,
GAPDH-Reverse, 5′-CTCTCTTCCTCTTGTGCTCTTG-3′.
The Human Protein Atlas (HPA)
HPA is a pathology tool that provides a large number of protein expression profiles of human proteins. Clinical tumor tissue samples come from a clinical biobank, including a large number of retrospectively collected patient cohorts and long-term follow-up for research. Here, we used this tool to compare the expression of RCC tissues and normal tissues at the protein level.
cBioPortal for ClueGo
The co-expression genes of FTH1 in KIRC (|Pearson’s r|≥0.4 and |Spearman’s r|≥0.4) were identified by cBioPortal network tools. Then, genes were loaded into ClueGo in CytoCop3.3.1 to analyze GO and KEGG pathways. Only a path with a p value of 0.05 was included. In addition, co-expressed genes (|Pearson’s r|≥0.5 and |Spearman’s r|≥0.5) were selected and STING was used for PPI network analysis.
Statistical analysis
All statistical analyses were performed using SPSS 22.0 software. The correlation between FTH1 gene expression and clinical pathological parameters of RCC patients was evaluated by independent-samples t test. The differences in TNM stages were tested using analysis of variance (ANOVA). Cox multivariate survival analysis was performed to predict unfavorable prognosis. The diagnostic value of FTH1 in RCC was evaluated by receiver operating characteristic (ROC) curve. Kaplan-Meier curves and logarithmic rank test were used to analyze the survival of RCC patients. STATA 12 software was used for meta-analysis. p≤0.05 was considered statistically significant.
Results
Association between FTH1 expression and clinicopathological parameters, diagnosis and prognosis of RCC patients
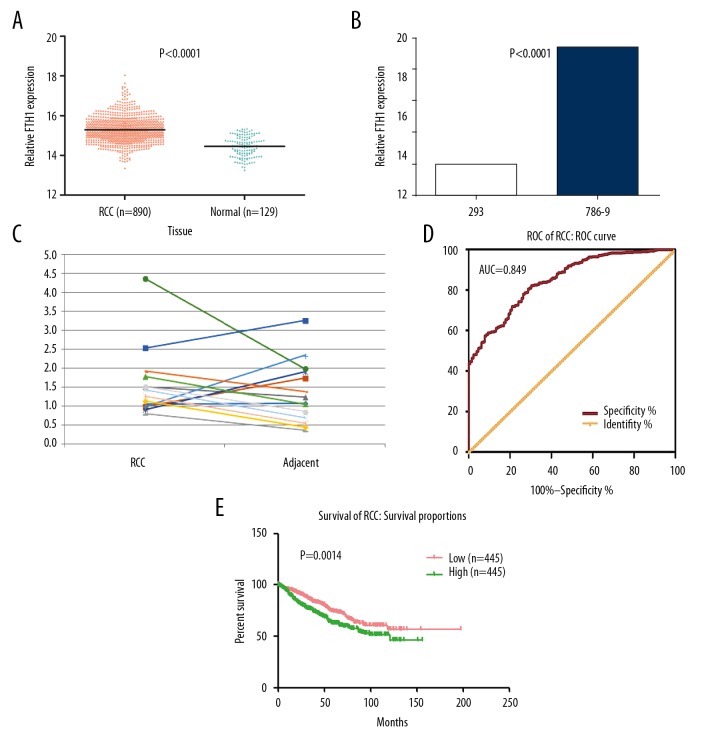
According to TCGA data, over-expression of FTH1 was detected in 890 RCC tissues (15.2904±0.63157) compared to 129 normal kidney tissues (14.4502±0.51523, p<0.001; Figure 1A). This was further confirmed in cell lines and tissues by real-time RT-PCR. In contrast with normal renal epithelial cell line 293, the mRNA level of FTH1 was elevated in renal cell carcinoma cell line 786-0 (Figure 1B). We also observed a relatively higher expression of FTH1 in 10 out of 14 primary RCCs than in matched adjacent samples (Figure 1C). There was a significant difference between the expression of FTH1 and age, T stage, M stage, and lymph node metastasis (Table 1). Patients age <60 years showed a lower FTH1 expression compared with those age ≥60 years. The expression of FTH1 was also remarkably different in different T and M stages. Patients with lymph node metastasis also had higher FTH1 expression and metastasis.
Figure 1.
The transcriptional level of FTH1 gene is higher in renal cell carcinoma (RCC) than in normal kidney tissues. (A) The mRNA expression of FTH1 in 890 cases of RCC and 129 cases of normal kidney tissues based on TCGA database. (B) FTH1 mRNA expression was detected by RT-qPCR in renal cancer cell 786-0 and renal epithelial cell 293, normalized to GAPDH. (C) The mRNA expression of FTH1 in 14 primary renal cell carcinoma tissues and matched adjacent tissues. (D) The ROC curve for evaluating the diagnostic performance of FTH1 in 890 cases of RCC and 129 cases of normal kidney tissues. The AUC was 0.849. (E) The overall survival (OS) of RCC patients with high and low mRNA level of FTH1, which was divided by the median of FTH1 mRNA expression in 890 cases of RCC.
Table 1.
Relationship between the expression of FTH1 and clinicopathological parameters in RCC.
| Clinicopathological parameters | n | Relevant expression of FTH1 (log2X) | |||
|---|---|---|---|---|---|
| Mean ±SD | t | p Value | |||
| Age (years) | <60 | 416 | 15.2286±0.61648 | −2.708a | 0.007* |
| ≥60 | 473 | 15.3431±0.64018 | |||
| Gender | Male | 598 | 15.2610±0.62896 | −1.933a | 0.054 |
| Female | 291 | 15.3481±0.63356 | |||
| Lymph node metastasis | Yes | 224 | 15.4004±0.63564 | 3.083a | 0.002* |
| No | 654 | 15.2505±0.62575 | |||
| Stage | I–II | 563 | 15.2102±0.61155 | −5.534a | 0.000* |
| III–IV | 294 | 15.4558±0.62696 | |||
| T | T1–T2 | 614 | 15.2076±0.61946 | −5.883a | 0.000* |
| T3–T4 | 275 | 15.4724±0.62058 | |||
| Pathologic stage | I | 460 | 15.2132±0.61193 | F=11.492b | 0.000* |
| II | 103 | 15.1969±0.61267 | |||
| III | 189 | 15.4041±0.62942 | |||
| IV | 105 | 15.5490±0.61454 | |||
| Pathologic T | T1 | 487 | 15.2095±0.61613 | F=12.300b | 0.000* |
| T2 | 127 | 15.2004±0.63447 | |||
| T3 | 258 | 15.4581±0.60455 | |||
| T4 | 17 | 15.6888±0.81950 | |||
| M | No | 224 | 15.4004±0.63564 | 3.083a | 0.002* |
| Yes | 654 | 15.2505±0.62575 | |||
SD – standard deviation; RCC – renal cell carcinoma.
A Student’s paired or unpaired t test was used for comparison between two group;
One-way analysis of variance (ANOVA) was performed.
p<0.05 was considered statistically significant.
Kaplan-Meier survival analysis showed that FTH1 expression level, age, lymphatic metastasis, stage, T stage, and M stage were important parameters affecting survival time of RCC patients (Table 2). In addition, Cox multivariate survival analysis was performed, including 6 significant statistical parameters, and demonstrated that age, stage, and M stage were predictors of adverse prognosis in patients with RCC (Table 3).
Table 2.
Kaplan-Meier univariate survival analysis of FTH1 and other clinicopathological parameters in RCC patients.
| Clinicopathological parameters | Mean survival time (months) | 95% CI | P value |
|---|---|---|---|
| FTH1 expression | |||
| Low | 135.153 | 123.535–146.772 | 0.001* |
| High | 97.873 | 89.98–105.767 | |
| Age (years) | |||
| <60 | 147.369 | 137.543–157.195 | 0.000* |
| ≥60 | 93.557 | 85.903–101.211 | |
| Gender | |||
| Female | 103.728 | 94.55–112.906 | 0.469 |
| Male | 125.38 | 114.575–136.185 | |
| Lymph | |||
| No | 107.774 | 101.082–114.465 | 0.000* |
| Yes | 114.567 | 101.158–127.976 | |
| Stage | |||
| I–II | 123.444 | 116.697–130.191 | 0.000* |
| III–IV | 85.857 | 73.647–98.066 | |
| T | |||
| T1–T2 | 120.245 | 113.691–126.799 | 0.000* |
| T3–T4 | 87.209 | 74.525–99.893 | |
| M | |||
| No | 112.629 | 106.22–119.039 | 0.000* |
| Yes | 103.131 | 87.961–118.302 | |
p<0.05 was considered statistically significant.
Table 3.
Cox multivariate analysis of FTH1 and other clinicopathological parameters in RCC patients.
| Covariates | HR | 95% CI for HR | P value |
|---|---|---|---|
| FTH1 expression level (low vs. high) | 1.129 | 0.858–1.486 | 0.386 |
| Age (<60 vs. ≥60 years) | 1.655 | 1.249–2.192 | 0.000* |
| Lymph (no vs. yes) | 1.044 | 0.78–1.396 | 0.772 |
| Stage (I–II vs. III–IV) | 6.032 | 3.445–10.564 | 0.000* |
| T (T1–2 vs. T3–4) | 0.661 | 0.394–1.109 | 0.117 |
| M (no vs. yes) | 1.615 | 1.219–2.138 | 0.001* |
p<0.05 was considered statistically significant.
The P value of ROC curve was <0.001, revealing that the expression of FTH1 is associated with diagnosis of RCC (AUC=0.849, 95% CI: 0.818–0.880, p<0.001; Figure 1D). The Kaplan-Meier curve showed that of RCC patients with high FTH1 expression had worse outcomes (p=0.0014; Figure 1E).
Association between FTH1 expression and clinicopathological parameters, diagnosis, and prognosis of KIRC, KICH, and KIRP patients
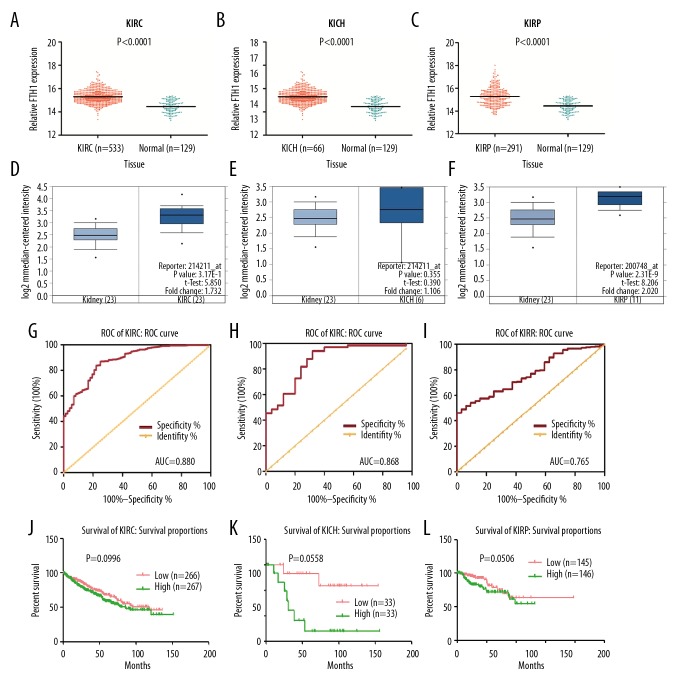
We extracted 533 cases of KIRC, 66 cases of KICH, and 291 cases of KIRP to analyze the FTH1 expression in subtypes of RCC. In these 3 types of RCC, FTH1 expression was significantly higher than in the 129 normal controls (Figure 2A–2C). To further confirm this finding, we used Oncomine database to analyze the FTH1 expression in 3 types of RCC. Figure 2D–2F shows that FTH1 is overexpressed in KIRC, KICH, and KIRP, but the difference is significant only in KIRC and KIRP.
Figure 2.
The transcriptional level of FTH1 gene is higher in KIRC, KICH, and KIRP in contrast with normal kidney tissues. Higher expression of FTH1 was associated with poorer prognosis of KIRC patients. (A–C) Scatter plot of FTH1 gene expression in normal tissues in contrast with 3 subtypes of RCC. (D–F) Validation of FTH1 expression in Jone’s study using ONOCMINE database. (G–I) ROC curve of FTH1 for patients with KIRC, KICH, and KIRP. The AUC was 0.88 (95% CI: 0.841–0.919, p<0.001), 0.868 (95% CI: 0.786–0.950, p<0.001), and 0.765 (95% CI: 0.697–0.834, p<0.001). (J–L) The overall survival (OS) of patients with KIRC, KICH, and KIRP.
The expression of FTH1 was also remarkably different in different T stages in KIRC patients. These patients with lymph node or distant metastasis had higher FTH1 expression (Table 4), but no significant difference was found between the expression of FTH1 and any clinical characteristics in KICH patients (Table 5). KIRP patients age <60 years showed lower FTH1 expression compared with those age ≥60 years. The expression of FTH1 was also remarkably different in different T stages. Patients with lymph node or distant metastasis also had higher FTH1 expression (Table 6).
Table 4.
Relationship between the expression of FTH1 and clinicopathological parameters in KIRC.
| Clinicopathological parameters | n | Relevant expression of FTH1 (log2X) | |||
|---|---|---|---|---|---|
| Mean ±SD | t | p Value | |||
| Age (years) | <60 | 245 | 15.2660±0.51809 | −1.534a | 0.126 |
| ≥60 | 288 | 15.3392±0.57304 | |||
| Gender | Male | 345 | 15.2739±0.56296 | −1.804a | 0.072 |
| Female | 188 | 15.3635±0.51938 | |||
| Lymph node metastasis | Yes | 134 | 15.4146±0.61153 | 2.443a | 0.015* |
| No | 392 | 15.2159±0.78573 | |||
| Stage | I–II | 324 | 15.2195±0.53435 | −4.580a | 0.000* |
| III–IV | 207 | 15.4396±0.54855 | |||
| T | T1–T2 | 342 | 15.2319±0.53832 | −4.209a | 0.000* |
| T3–T4 | 191 | 15.4375±0.54507 | |||
| Pathologic stage | I | 267 | 15.2250±0.52511 | F=8.503b | 0.000* |
| II | 57 | 15.1938±0.57990 | |||
| III | 123 | 15.3756±0.53859 | |||
| IV | 84 | 15.5332±0.55273 | |||
| Pathologic T | T1 | 273 | 15.2271±0.52558 | F=6.478b | 0.000* |
| T2 | 69 | 15.2506±0.58975 | |||
| T3 | 180 | 15.4251±0.53334 | |||
| T4 | 11 | 15.6394±1.71110 | |||
| M | No | 422 | 15.2636±0.53297 | −3.429a | 0.001* |
| Yes | 109 | 15.4641±0.58600 | |||
SD – standard deviation; RCC – renal cell carcinoma.
A Student’s paired or unpaired t test was used for comparison between two group;
One-way analysis of variance (ANOVA) was performed.
p<0.05 was considered statistically significant.
Table 5.
Relationship between the expression of FTH1 and clinicopathological parameters in KICH.
| Clinicopathological parameters | n | Mean ±SD | t | p value | |
|---|---|---|---|---|---|
| Age (years) | <60 | 47 | 15.2060±0.50464 | −0.049a | 0.961 |
| ≥60 | 19 | 15.2130±0.50670 | |||
| Gender | Male | 39 | 15.2154±0.52903 | 0.014a | 0.888 |
| Female | 27 | 15.1973±0.48618 | |||
| Lymph node metastasis | Yes | 35 | 15.1640±0.54639 | 0.744a | 0.459 |
| No | 31 | 15.2577±0.54639 | |||
| Stage | I–II | 46 | 15.1614±0.49987 | −1.292a | 0.205 |
| III–IV | 19 | 15.3432±0.52252 | |||
| T | T1–T2 | 46 | 15.1428±0.49759 | −1.581a | 0.123 |
| T3–T4 | 20 | 15.3581±0.51290 | |||
| Pathologic stage | I | 21 | 15.2598±0.11110 | F=2.312b | 0.085 |
| II | 25 | 15.0787±0.97330 | |||
| III | 13 | 15.1914±0.51749 | |||
| IV | 6 | 15.6593±0.40624 | |||
| Pathologic T | T1 | 21 | 15.2598±0.50917 | F=1.577b | 0.209 |
| T2 | 25 | 15.0444±0.47552 | |||
| T3 | 18 | 15.3562±0.54161 | |||
| T4 | 2 | 15.3752±0.10394 | |||
| M | No | 34 | 15.1269±0.53388 | −0.555a | 0.582 |
| Yes | 11 | 15.2290±0.51903 | |||
SD – standard deviation.
A Student’s paired or unpaired t test was used for comparison between two group;
One-way analysis of variance (ANOVA) was performed.
Table 6.
Relationship between the expression of FTH1 and clinicopathological parameters in KIRP.
| Clinicopathological parameters | n | Relevant expression of FTH1 (log2X) | |||
|---|---|---|---|---|---|
| Mean ±SD | t | p Value | |||
| Age (years) | <60 | 121 | 15.1689±0.80649 | −2.036a | 0.043* |
| ≥60 | 169 | 15.3572±0.75462 | |||
| Gender | Male | 214 | 15.2485±0.73904 | −1.104a | 0.270 |
| Female | 76 | 15.3636±0.88799 | |||
| Lymph node metastasis | Yes | 55 | 15.5165±0.71347 | −2.595a | 0.010* |
| No | 231 | 15.2159±0.78573 | |||
| Stage | I–II | 193 | 15.2106±0.74507 | −2.963a | 0.003* |
| III–IV | 67 | 15.5353±0.84850 | |||
| T | T1–T2 | 226 | 15.1841±0.74460 | −3.763a | 0.000* |
| T3–T4 | 64 | 15.6124±0.81967 | |||
| Pathologic stage | I | 172 | 15.1891±0.73811 | F=3.326b | 0.019* |
| II | 21 | 15.3870±0.79651 | |||
| III | 52 | 15.5188±0.82226 | |||
| IV | 15 | 15.5928±0.96255 | |||
| Pathologic T | T1 | 193 | 15.1791±0.73574 | F=5.591b | 0.010* |
| T2 | 33 | 15.2134±0.80731 | |||
| T3 | 60 | 15.5878±0.78798 | |||
| T4 | 4 | 15.9815±1.30530 | |||
| M | No | 95 | 15.1953±0.73192 | −1.429a | 0.154 |
| Yes | 180 | 15.3378±0.82060 | |||
SD – standard deviation.
A Student’s paired or unpaired t test was used for comparison between two group;
One-way analysis of variance (ANOVA) was performed.
p<0.05 was considered statistically significant.
The ROC curve was used to assess the diagnostic performance of FTH1 expression in KIRC, KICH, and KIRP (Figure 2G–2I); the AUC was 0.880 (95% CI: 0.841–0.919, p<0.001), 0.868 (95% CI: 0.786–0.950, p<0.001), and 0.868 (95% CI: 0.786–0.950, p<0.001), respectively. This indicates that the transcription of FTH1 could be used as a diagnostic biomarker for all 3 subtypes of RCC.
The Kaplan-Meier curves shown in Figure 2J–2L revealed no predictive value in KIRC, KIRP, or KICH patients.
Meta-analysis of FTH1 expression in RCC
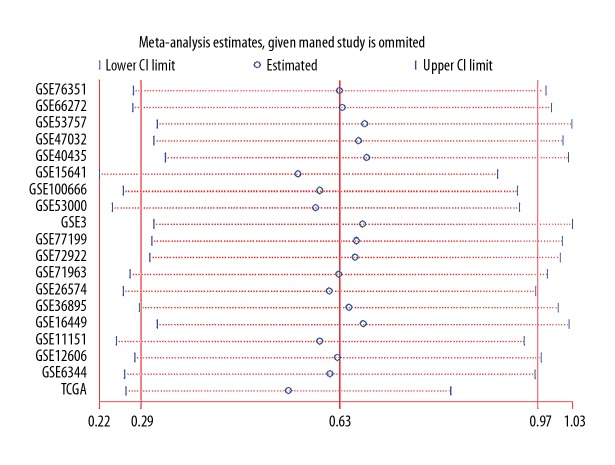
To evaluate the consistency of FTH1 abnormal expression in RCC, 18 microarray studies involving 738 RCC tissues and 469 normal tissues in GEO database were included for meta-analysis, in which we combined the effective data (GEO and TCGA) and used the random-effects model to obtain the pooled Standard Mean Difference (SMD) as 0.64 (95% CI: 0.53–0.75, p<0.001; Figure 3), and the p value of the heterogeneity test was less than 0.001 (I2=87.0%). Sensitivity analysis showed that no single study led to significant bias in overall merger results (Figure 4). In addition, no significant publication bias was found in the study (Begg’s test: p=0.054; Figure 5). Relevant information was extracted from each study, such as ID number, first author, public year, country, sample type, platform, number of cancer cases, mean (M) and standard deviation (SD) of FTH1 expression in the cancer group, and normal tissue N, M, and SD of FTH1 expression in the normal group (Table 7).
Figure 3.
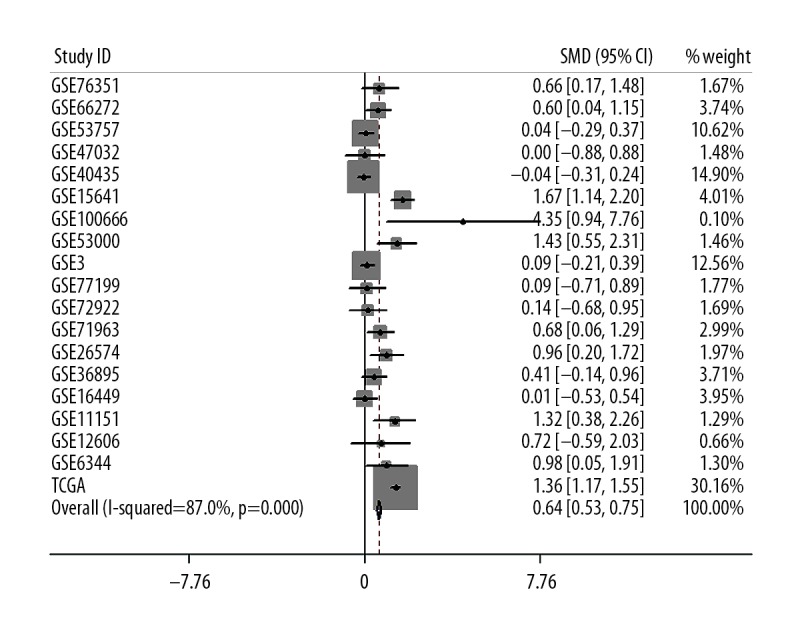
Meta-analysis of FTH1 expression in renal cell carcinoma based on tumor types. A total of SMDs with 95% CI accounted for 0.64 (0.53, 0.75). RCC tissue subgroup was highly heterogeneous (I2=87.0%, p<0.001).
Figure 4.
Meta-analysis of FTH1 expression in renal cell carcinoma showed no significant difference in sensitivity analysis.
Figure 5.
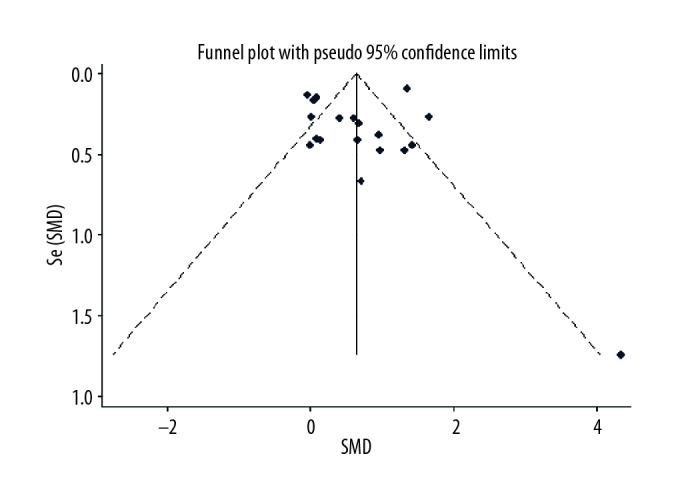
Meta-analysis of FTH1 expression in renal cell carcinoma using Begg funnel map. Symmetric Begg funnel map indicated publication bias (p=0.054).
Table 7.
Basic information of all included GEO datasets, array express microarray.
| ID | Author | Publish year | Country | Sample type | Cancer N | Cancer M | Cancer SD | Normal N | Normal M | Normal SD |
|---|---|---|---|---|---|---|---|---|---|---|
| GSE76351 | Solodskikh | 2015 | Russia | Human tissues | 12 | 9.1138 | 0.2013 | 12 | 8.9940 | 0.1621 |
| GSE66272 | Wotschofsky Z | 2016 | Germany | Human tissues | 26 | 0.0846 | 0.2991 | 27 | −0.1014 | 0.3243 |
| GSE53757 | von Roemeling CA | 2014 | USA | Human tissues | 72 | 15.5405 | 0.5152 | 72 | 15.5225 | 0.3383 |
| GSE47032 | Valletti A | 2013 | Italy | Human tissues | 10 | 4.7872 | 0.1749 | 10 | 4.7872 | 0.1749 |
| GSE40435 | Wozniak MB | 2013 | France | Human tissues | 101 | 10.3477 | 0.4258 | 101 | 10.3630 | 0.3850 |
| GSE15641 | Jones J | 2009 | USA | Human tissues | 69 | 11.3989 | 0.5139 | 23 | 10.6087 | 0.3120 |
| GSE100666 | Peng Z | 2017 | China | Human tissues | 3 | 11.2542 | 0.0787 | 3 | 10.7352 | 0.1493 |
| GSE53000 | Gerlinger M | 2014 | France | Human tissues | 56 | 10.4677 | 0.2034 | 6 | 10.1719 | 0.2360 |
| GSE3 | Boer JM | 2001 | Germany | Human tissues | 90 | 5.9354 | 5.9755 | 81 | 5.3819 | 6.1432 |
| GSE77199 | Wragg JW | 2016 | United Kingdom | Human tissues | 12 | 15.9394 | 0.5158 | 12 | 15.8935 | 0.4924 |
| GSE72922 | De Palma G | 2016 | Italy | Human tissues | 12 | 10.0338 | 1.3682 | 11 | 9.8243 | 1.7273 |
| GSE71963 | Takahashi M | 2016 | Japan | Human tissues | 32 | 1.5948 | 0.7584 | 16 | 1.1496 | 0.3651 |
| GSE26574 | Ooi A | 2011 | USA | Human tissues | 57 | 11.4650 | 0.6121 | 8 | 10.8944 | 0.4178 |
| GSE36895 | Peña-Llopis S | 2012 | USA | Human tissues | 29 | 13.9418 | 0.3180 | 23 | 13.8316 | 0.1914 |
| GSE16449 | Brannon AR | 2010 | USA | Human tissues | 52 | 0.0551 | 0.3741 | 18 | 0.0528 | 0.2364 |
| GSE11151 | Yusenko MV | 2008 | Netherlands | Human tissues | 62 | 15.4108 | 0.4036 | 5 | 14.8845 | 0.3245 |
| GSE12606 | Stickel JS | 2008 | Germany | Human tissues | 6 | 10.7604 | 0.0924 | 4 | 10.4827 | 0.6190 |
| GSE6344 | Gumz ML | 2006 | USA | Human tissues | 10 | 13.6205 | 0.3276 | 10 | 13.3191 | 0.2851 |
| TCGA | Human tissues | 890 | 15.2904 | 0.6316 | 129 | 14.4502 | 0.5152 |
N – number; M – mean; SD – standard deviation
FTH1 protein expression in RCC tissues from HPA
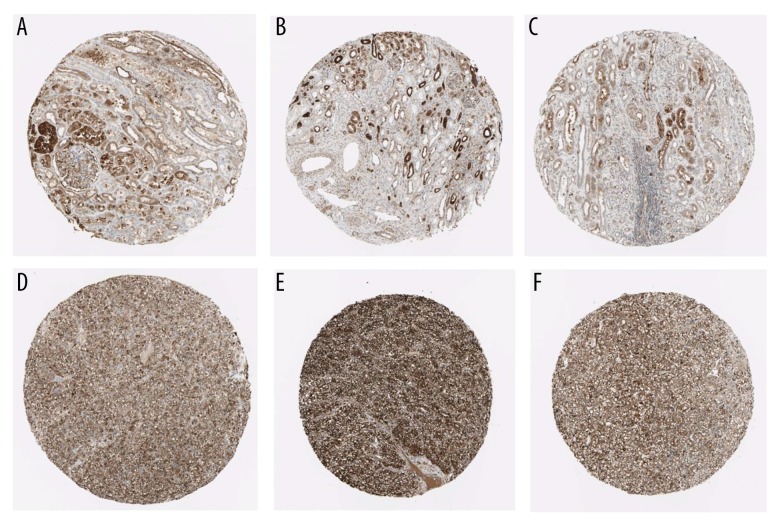
Using the HPA database, we compared 3 normal samples and 3 RCC samples, which showed an elevation of FTH1 protein in RCC (Figure 6).
Figure 6.
Validation of the protein expression of FTH1 in normal kidney control samples (A–C) and RCC samples using the HPA database (D–F).
The GO, KEGG network, and PPI network with co-expressed genes of FTH1
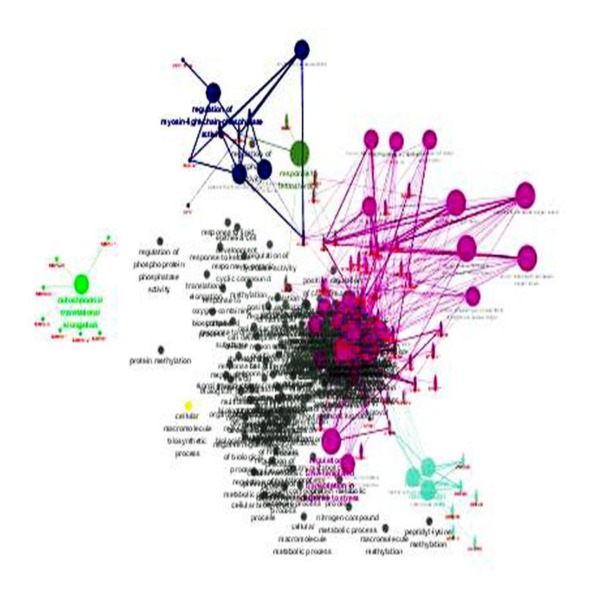
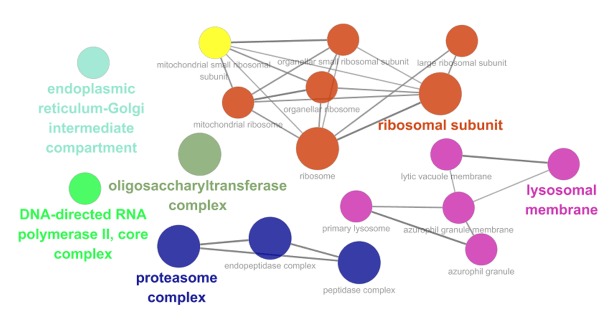
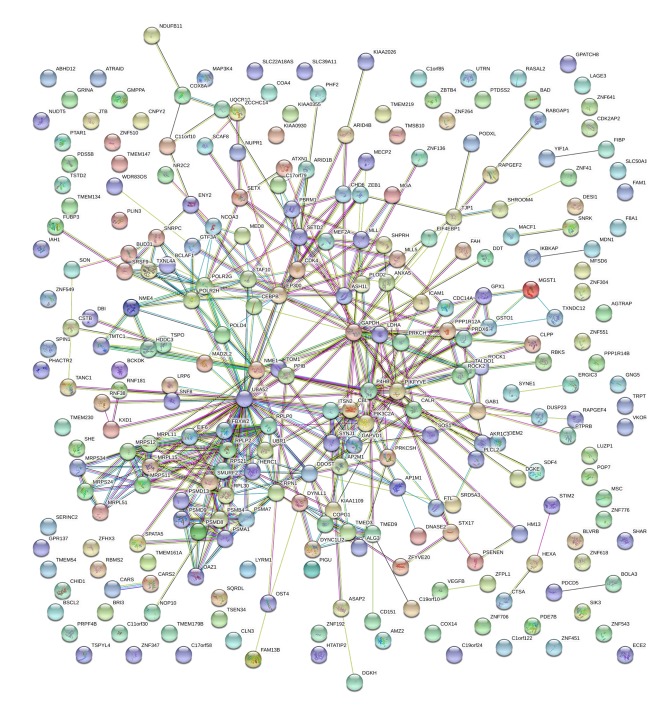
Among these co-expressed genes, 278 genes were selected for GO and pathway analyses (Figures 7–9). These genes are abundantly expressed in positive regulation of the Wnt signal transduction pathway, response to oxygen level, binding of ribosome subunits, and RNA polymerase. In addition, KEGG pathway analysis showed that the expression of FTH1 co-expression gene in hepatocellular carcinoma, proteasome, and ribosome was significantly higher than in the control group (Figure 10). The most important GO items (BP, CC, and MF) are listed in Table 8 and the PPI network is shown in Figure 11.
Figure 7.
The GO map of BP corresponding to the target gene of FTH1.
Figure 8.
The GO map corresponds to the target gene CC of FTH1.
Figure 9.
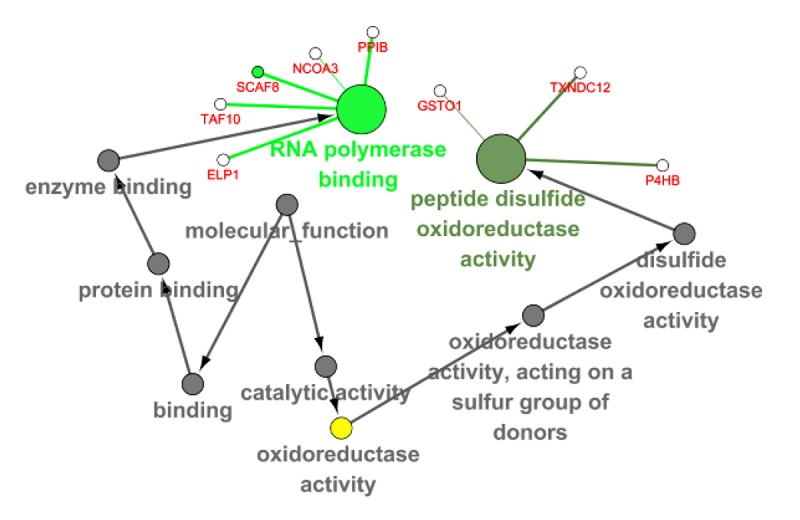
The GO map of MF corresponding to the target gene of FTH1.
Figure 10.
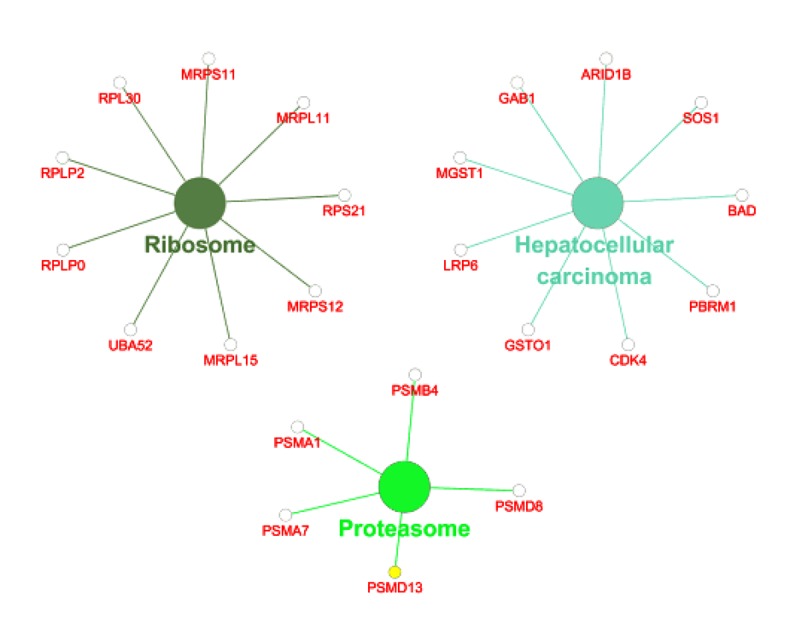
KEGG pathway analysis of co-expression genes of FTH1 target genes.
Table 8.
Top 5 enrichment GO terms (BP, CC and MF) of the co-expression genes of FTH1.
| GO ID | GO Term | Ontology | Count | P Value |
|---|---|---|---|---|
| GO: 0030177 | Positive regulation of Wnt signaling pathway | BP | 11 | 3.49E-05 |
| GO: 0070482 | Response to oxygen levels | BP | 19 | 6.90E-06 |
| GO: 0071456 | Cellular response to hypoxia | BP | 12 | 5.29E-05 |
| GO: 0071453 | Cellular response to oxygen levels | BP | 13 | 3.58E-05 |
| GO: 0090175 | Regulation of establishment of planar polarity | BP | 9 | 6.83E-05 |
| GO: 0044391 | Ribosomal subunit | CC | 12 | 2.06E-05 |
| GO: 0008250 | Oligosaccharyltransferase complex | CC | 4 | 2.49E-05 |
| GO: 0000502 | Proteasome complex | CC | 7 | 5.20E-05 |
| GO: 1905368 | Peptidase complex | CC | 8 | 5.45E-05 |
| GO: 1905369 | Endopeptidase complex | CC | 7 | 5.71E-05 |
| GO: 0070063 | RNA polymerase binding | MF | 5 | 0.001002 |
| GO: 0015037 | Peptide disulfide oxidoreductase activity | MF | 3 | 9.22E-04 |
GO – gene ontology; BP – biological process; CC – cellular component; MF – molecular function.
Figure 11.
The PPI network of FTH1 target genes.
Discussion
To date, no diagnostic modality for early detection of RCC has been established, other than incidental radiologic discovery. Some promising studies have identified several potential biomarkers in sera and urine. For example, tumor necrosis factor receptor-related factor-1, heat shock protein 27, carbonic anhydrase IX, and ferritin in RCC patients were significantly higher than those in control serum [20–24], while nuclear matrix protein-22, kidney injury molecule-1, matrix metalloproteinases, aquaporin-1, and perilipin 2 are elevated in urine [25–28]. However, none of these have been used in clinic practice for RCC diagnosis. In this study, we used bioinformatic approaches to reveal the relationship between FTH1 and the clinical characteristics of RCC patients. The RNA-seq data from TCGA showed that FTH1 is overexpressed in RCC tissues. FTH1 transcription level was significantly correlated with pathological T stage, lymph node, and distant metastasis of KIRC, and was significantly correlated with pathological T stage and lymph node metastasis of KIRP, suggesting that FTH1 may be a potential biomarker for clinical stages of these 2 RCC subtypes. Meta-analysis results showed that FTH1 was overexpressed in RCC according to 18 microarray datasets from GEO. However, heterogeneity was moderately high and publication bias was obvious, probably due to small sample size and datasets of varying quality.
Currently available biomarkers seem to be most useful as diagnostic tools, prognostic indicators, and follow-up in patients with renal cancer [29]. Steven et al. reported that the positive expression of receptor activator of NF-κB had both worse cancer-specific survival and recurrence-free survival in RCC patients [30]. Increased expression of long noncoding RNA GIHCG is positively correlated with advanced TNM stages, Fuhrman grades, and poor prognosis [31]. In a meta-analysis of 2013 patients, including 22 studies, positive expression of P53 was associated with poor prognosis and advanced clinicopathological features in RCC patients [32]. The nuclear translocation of CXCR4 plays an important role in RCC metastasis and is associated with poor prognosis [33]. Here, we found that RCC patients with higher FTH1 expression in primary RCC were associated with a shorter survival time. Besides, RCC patients with lymph node and distant metastasis had higher FTH1 expression metastasis, which indirectly suggests a poorer prognosis. These finding suggest that the high expression of FTH1 could be used as a predictor to indicate the poor prognosis of RCC patients.
Dysregulation of iron homeostasis has been linked to numerous diseases, such as cancer and neurodegenerative diseases [34,35]. Cellular iron regulation includes iron uptake, storage, and export. Iron-regulated proteins, such as transferrin receptors in glioblastoma and ferritin in serum, were upregulated, thereby increasing iron uptake [36,37]. Ferritin plays an important role in the storage and release of iron in cells. Ferritin complexes capture intracellular ferrous ions (Fe2) and convert them into iron ions (Fe3) by the activity of ferrous oxidase [38]. It consists of 24 subunits of heavy and light ferritin chains (FTH1 and FTL1). In this study, we found that there was no significant correlation between the expression of FTL1 and RCC (data not shown), suggesting that FTH1 might play an important role in the tumorigenesis of RCC. In addition, approaches targeting cellular iron and iron signaling to inhibit tumor growth have been developed and applied in cancer therapy. The application of iron chelators can suppress tumor growth and induce apoptosis, which suggests iron chelators as potential anti-cancer drugs [39,40]. FTH1 controls HIF-induced hypoxia by activating asparagine hydroxylase and affects the expression of HIF-1 target gene [38]. Based on our results of GO analyses, the top enriched functional term of FTH1 genes were regulation of Wnt signaling pathway and response to cellular hypoxia. Overexpressing FTH1 in acute myeloid leukemia (AML) stem cells significantly induced the expression of genes involved in immune and inflammatory response, including NF-κB pathway, oxidative stress, and iron pathways [41]. These findings suggest that FTH1 could be a novel therapeutic target.
The limitations of this study should be considered. The expression of FTH1 in RCC and its correlation with clinical features were analyzed and validated only in TCGA and GEO datasets. Further research is needed to improve our understanding of the functional role of FTH1 in RCC.
Conclusions
In this study, we found that expression of FTH1 is elevated in RCC, which could serve as a potential diagnosis and prognosis biomarker. Our data suggest that higher mRNA levels of FTH1 might contribute to the progression of RCC, and thus could be used as a target for RCC therapy.
Abbreviations
- RCC
renal cell carcinoma
- KIRC
kidney clear cell carcinoma
- KICH
kidney papillary cell carcinoma
- KIRP
kidney chromophobe
- FTH1
ferritin heavy chain
- VHL
von Hippel-Lindau disease
- HIF-α
hypoxia-inducible factor-alpha
- SMD
standardized mean difference
Footnotes
Source of support: This study was supported by grants from the Future Academic Star Project of Guangxi Medical University (WLXSZX18126)
Conflict of interest
None.
References
- 1.Siegel RL, Miller KD, Jemal A. Cancer statistics, 2018. Cancer J Clin. 2018;68:7–30. doi: 10.3322/caac.21442. [DOI] [PubMed] [Google Scholar]
- 2.Jonasch E, Gao J, Rathmell WK. Renal cell carcinoma. BMJ. 2014;349:g4797. doi: 10.1136/bmj.g4797. [DOI] [PMC free article] [PubMed] [Google Scholar]
- 3.Znaor A, Lortet-Tieulent J, Laversanne M, et al. International variations and trends in renal cell carcinoma incidence and mortality. Eur Urol. 2015;67:519–30. doi: 10.1016/j.eururo.2014.10.002. [DOI] [PubMed] [Google Scholar]
- 4.Frees S, Kamal MM, Knoechlein L, et al. Differences in overall and cancer-specific survival of patients presenting with chromophobe versus clear cell renal cell carcinoma: A propensity score matched analysis. Urology. 2016;98:81–87. doi: 10.1016/j.urology.2016.05.048. [DOI] [PubMed] [Google Scholar]
- 5.Leibovich BC, Lohse CM, Crispen PL, et al. Histological subtype is an independent predictor of outcome for patients with renal cell carcinoma. J Urol. 2010;183:1309–15. doi: 10.1016/j.juro.2009.12.035. [DOI] [PubMed] [Google Scholar]
- 6.Nickerson ML, Jaeger E, Shi Y, et al. Improved identification of von Hippel-Lindau gene alterations in clear cell renal tumors. Clin Cancer Res. 2008;14:4726–34. doi: 10.1158/1078-0432.CCR-07-4921. [DOI] [PMC free article] [PubMed] [Google Scholar]
- 7.Moore LE, Nickerson ML, Brennan P, et al. Von Hippel-Lindau (VHL) inactivation in sporadic clear cell renal cancer: Associations with germline VHL polymorphisms and etiologic risk factors. PLoS Genet. 2011;7:e1002312. doi: 10.1371/journal.pgen.1002312. [DOI] [PMC free article] [PubMed] [Google Scholar]
- 8.Shen C, Kaelin WG., Jr The VHL/HIF axis in clear cell renal carcinoma. Semin Cancer Biol. 2013;23:18–25. doi: 10.1016/j.semcancer.2012.06.001. [DOI] [PMC free article] [PubMed] [Google Scholar]
- 9.Rabjerg M. Identification and validation of novel prognostic markers in renal cell carcinoma. Dan Med J. 2017;64 pii: B5339. [PubMed] [Google Scholar]
- 10.Wang W, Knovich MA, Coffman LG, et al. Serum ferritin: Past, present and future. Biochim Biophys Acta. 2010;1800:760–69. doi: 10.1016/j.bbagen.2010.03.011. [DOI] [PMC free article] [PubMed] [Google Scholar]
- 11.Goralska M, Nagar S, Fleisher LN, McGahan MC. Differential degradation of ferritin H- and L-chains: Accumulation of L-chain-rich ferritin in lens epithelial cells. Invest Ophthalmol Vis Sci. 2005;46:3521–29. doi: 10.1167/iovs.05-0358. [DOI] [PubMed] [Google Scholar]
- 12.Theil EC. The ferritin family of iron storage proteins. Adv Enzymol Relat Areas Mol Biol. 1990;63:421–49. doi: 10.1002/9780470123096.ch7. [DOI] [PubMed] [Google Scholar]
- 13.Essen A, Ozen H, Ayhan A, et al. Serum ferritin: A tumor marker for renal cell carcinoma. J Urol. 1991;145:1134–37. doi: 10.1016/s0022-5347(17)38555-5. [DOI] [PubMed] [Google Scholar]
- 14.Miyata Y, Koga S, Nishikido M, et al. Relationship between serum ferritin levels and tumour status in patients with renal cell carcinoma. BJU Int. 2001;88:974–77. doi: 10.1046/j.1464-4096.2001.01323.x. [DOI] [PubMed] [Google Scholar]
- 15.Rosager AM, Sorensen MD, Dahlrot RH, et al. Transferrin receptor-1 and ferritin heavy and light chains in astrocytic brain tumors: Expression and prognostic value. PLoS One. 2017;12:e0182954. doi: 10.1371/journal.pone.0182954. [DOI] [PMC free article] [PubMed] [Google Scholar]
- 16.Su Q, Lei T, Zhang M. Association of ferritin with prostate cancer. J BUON. 2017;22:766–70. [PubMed] [Google Scholar]
- 17.Chekhun SV, Lukyanova NY, Shvets YV, et al. Significance of ferritin expression in formation of malignant phenotype of human breast cancer cells. Exp Oncol. 2014;36:179–83. [PubMed] [Google Scholar]
- 18.Wang Z, Jensen MA, Zenklusen JC. A practical guide to The Cancer Genome Atlas (TCGA) Methods Mol Biol. 2016;1418:111–41. doi: 10.1007/978-1-4939-3578-9_6. [DOI] [PubMed] [Google Scholar]
- 19.Wilson BJ, Giguere V. Identification of novel pathway partners of p68 and p72 RNA helicases through Oncomine meta-analysis. BMC Genomics. 2007;8:419. doi: 10.1186/1471-2164-8-419. [DOI] [PMC free article] [PubMed] [Google Scholar]
- 20.Ponten F, Schwenk JM, Asplund A, Edqvist PH. The Human Protein Atlas as a proteomic resource for biomarker discovery. J Intern Med. 2011;270:428–46. doi: 10.1111/j.1365-2796.2011.02427.x. [DOI] [PubMed] [Google Scholar]
- 21.Rajandram R, Yap NY, Pailoor J, et al. Tumour necrosis factor receptor-associated factor-1 (TRAF-1) expression is increased in renal cell carcinoma patient serum but decreased in cancer tissue compared with normal: Potential biomarker significance. Pathology. 2014;46:518–22. doi: 10.1097/PAT.0000000000000145. [DOI] [PubMed] [Google Scholar]
- 22.White NM, Masui O, Desouza LV, et al. Quantitative proteomic analysis reveals potential diagnostic markers and pathways involved in pathogenesis of renal cell carcinoma. Oncotarget. 2014;5:506–18. doi: 10.18632/oncotarget.1529. [DOI] [PMC free article] [PubMed] [Google Scholar]
- 23.Takacova M, Bartosova M, Skvarkova L, et al. Carbonic anhydrase IX is a clinically significant tissue and serum biomarker associated with renal cell carcinoma. Oncol Lett. 2013;5:191–97. doi: 10.3892/ol.2012.1001. [DOI] [PMC free article] [PubMed] [Google Scholar]
- 24.Kirkali Z, Guzelsoy M, Mungan MU, et al. Serum ferritin as a clinical marker for renal cell carcinoma: Influence of tumor size and volume. Urol Int. 1999;62:21–25. doi: 10.1159/000030349. [DOI] [PubMed] [Google Scholar]
- 25.Kaya K, Ayan S, Gokce G, et al. Urinary nuclear matrix protein 22 for diagnosis of renal cell carcinoma. Scand J Urol Nephrol. 2005;39:25–29. doi: 10.1080/00365590410002500. [DOI] [PubMed] [Google Scholar]
- 26.Di Carlo A. Evaluation of neutrophil gelatinase-associated lipocalin (NGAL), matrix metalloproteinase-9 (MMP-9), and their complex MMP-9/NGAL in sera and urine of patients with kidney tumors. Oncol Lett. 2013;5:1677–81. doi: 10.3892/ol.2013.1252. [DOI] [PMC free article] [PubMed] [Google Scholar]
- 27.Morrissey JJ, London AN, Lambert MC, Kharasch ED. Sensitivity and specificity of urinary neutrophil gelatinase-associated lipocalin and kidney injury molecule-1 for the diagnosis of renal cell carcinoma. Am J Nephrol. 2011;34:391–98. doi: 10.1159/000330851. [DOI] [PubMed] [Google Scholar]
- 28.Morrissey JJ, Mobley J, Figenshau RS, et al. Urine aquaporin 1 and perilipin 2 differentiate renal carcinomas from other imaged renal masses and bladder and prostate cancer. Mayo Clin Proc. 2015;90:35–42. doi: 10.1016/j.mayocp.2014.10.005. [DOI] [PMC free article] [PubMed] [Google Scholar]
- 29.Pastore AL, Palleschi G, Silvestri L, et al. Serum and urine biomarkers for human renal cell carcinoma. Dis Markers. 2015;2015 doi: 10.1155/2015/251403. 251403. [DOI] [PMC free article] [PubMed] [Google Scholar]
- 30.Steven A, Leisz S, Fussek S, et al. Receptor activator of NF-kappaB (RANK)-mediated induction of metastatic spread and association with poor prognosis in renal cell carcinoma. Urol Oncol. 2018;36:502e15–24. doi: 10.1016/j.urolonc.2018.07.013. [DOI] [PubMed] [Google Scholar]
- 31.He ZH, Qin XH, Zhang XL, et al. Long noncoding RNA GIHCG is a potential diagnostic and prognostic biomarker and therapeutic target for renal cell carcinoma. Eur Rev Med Pharmacol Sci. 2018;22:46–54. doi: 10.26355/eurrev_201801_14099. [DOI] [PubMed] [Google Scholar]
- 32.Wang Z, Peng S, Jiang N, et al. Prognostic and clinicopathological value of p53 expression in renal cell carcinoma: A meta-analysis. Oncotarget. 2017;8:102361–70. doi: 10.18632/oncotarget.21971. [DOI] [PMC free article] [PubMed] [Google Scholar]
- 33.Bao Y, Wang Z, Liu B, et al. A feed-forward loop between nuclear translocation of CXCR4 and HIF-1alpha promotes renal cell carcinoma metastasis. Oncogene. 2018 doi: 10.1038/s41388-018-0452-4. [Epub ahead of print] [DOI] [PMC free article] [PubMed] [Google Scholar]
- 34.Deugnier Y. Iron and liver cancer. Alcohol. 2003;30:145–50. doi: 10.1016/s0741-8329(03)00129-0. [DOI] [PubMed] [Google Scholar]
- 35.Rouault TA. Iron metabolism in the CNS: Implications for neurodegenerative diseases. Nat Rev Neurosci. 2013;14:551–64. doi: 10.1038/nrn3453. [DOI] [PubMed] [Google Scholar]
- 36.Calzolari A, Larocca LM, Deaglio S, et al. Transferrin receptor 2 is frequently and highly expressed in glioblastomas. Transl Oncol. 2010;3:123–34. doi: 10.1593/tlo.09274. [DOI] [PMC free article] [PubMed] [Google Scholar]
- 37.Chirasani SR, Markovic DS, Synowitz M, et al. Transferrin-receptor-mediated iron accumulation controls proliferation and glutamate release in glioma cells. J Mol Med (Berl) 2009;87:153–67. doi: 10.1007/s00109-008-0414-3. [DOI] [PubMed] [Google Scholar]
- 38.Jin P, Kang J, Lee MK, Park JW. Ferritin heavy chain controls the HIF-driven hypoxic response by activating the asparaginyl hydroxylase FIH. Biochem Biophys Res Commun. 2018;499:475–81. doi: 10.1016/j.bbrc.2018.03.173. [DOI] [PubMed] [Google Scholar]
- 39.Saeki I, Yamamoto N, Yamasaki T, et al. Effects of an oral iron chelator, deferasirox, on advanced hepatocellular carcinoma. World J Gastroenterol. 2016;22:8967–77. doi: 10.3748/wjg.v22.i40.8967. [DOI] [PMC free article] [PubMed] [Google Scholar]
- 40.Yang C, Ma X, Wang Z, et al. Curcumin induces apoptosis and protective autophagy in castration-resistant prostate cancer cells through iron chelation. Drug Des Devel Ther. 2017;11:431–39. doi: 10.2147/DDDT.S126964. [DOI] [PMC free article] [PubMed] [Google Scholar]
- 41.Bertoli S, Paubelle E, Berard E, et al. Ferritin heavy/light chain (FTH1/FTL) expression, serum ferritin levels and their functional as well as prognostic roles in acute myeloid leukemia. Eur J Haematol. 2019;102(2):131–42. doi: 10.1111/ejh.13183. [DOI] [PubMed] [Google Scholar]


