Abstract
Objective
Dengue is a mosquito-transmitted virus infection that remains rampant across the tropical and subtropical areas worldwide. However, the spatial and temporal dynamics of dengue transmission are poorly understood in Chao-Shan area, one of the most densely populated regions on China’s southeastern coast, limiting disease control efforts. We aimed to characterise the epidemiology of dengue and assessed the effect of seasonal climate variation on its dynamics in the area.
Design
A spatio-temporal descriptive analysis was performed in three cities including Shantou, Chaozhou and Jieyang in Chao-Shan area during the period of 2014–2017.
Setting
Data of dengue cases of three cities including Shantou, Chaozhou and Jieyang in Chao-Shan area during 2014–2017 were extracted. Data for climatic variables including mean temperature, relative humidity and rainfall were also compiled.
Methodology
The epidemiology and dynamics of dengue were initially depicted, and then the temporal dynamics related to climatic drivers was assessed by a wavelet analysis method. Furthermore, a generalised additive model for location, scale and shape model was performed to study the relationship between seasonal dynamics of dengue and climatic drivers.
Results
Among the cities, the number of notified dengue cases in Chaozhou was greatest, accounting for 78.3%. The median age for the notified cases was 43 years (IQR: 27.0–58.0 years). Two main regions located in Xixin and Chengxi streets of Chaozhou with a high risk of infection were observed, indicating that there was substantial spatial heterogeneity in intensity. We found an annual peak incidence occurred in autumn across the region, most markedly in 2015. This study reveals that periods of elevated temperatures can drive the occurrence of dengue epidemics across the region, and the risk of transmission is highest when the temperature is between 25°C and 28°C.
Conclusion
Our study contributes to a better understanding of dengue dynamics in Chao-Shan area.
Keywords: China, climate, dengue, seasonal variation, spatial, wavelet analysis
Strengths and limitations of this study.
This study represented an initial step to use a statistically rigorous approach for assessing the effects of climatic factors on dengue epidemics in Chao-Shan area.
Our dengue surveillance may be not complete, as the patient may not seek regular treatment or have not been diagnosed and reported.
Some potentially relevant factors such as human activities, mosquito density, vegetation cover, distance to water bodies and so on were not included and may partly influence the relationship identified in this work.
The epidemical features of dengue cases caused by different viruses in the areas are in need of further study.
Introduction
Dengue is characterised as a serious infectious disease with a variety of clinical symptoms, from mild fever to potentially fatal dengue shock syndrome, and remains rampant across the tropical and subtropical areas in the world.1 Dengue viruses are arthropod-borne flaviviruses, which cause dengue shock syndrome in humans, and previous studies suggest that dengue virus production is immunologically regulated.2 At present, endemic dengue virus transmission is reported in the Eastern Mediterranean, American, Southeast Asian, Western Pacific and African regions.3 Accordingly, Aedes mosquitoes, including Aedes aegypti and Aedes albopictus, serve as the main transmission vector of dengue viruses.4 Studies have documented that the variability in ambient temperature and precipitation have an impact on development rates and habitat availability for Aedes aegypti and Aedes albopictus larvae and pupae.5 There has been sharp increase in the number of dengue infections over the past few decades, and the disease has a great influence on population health and brings a heavy economic burden to patients, society and government.6 In China, the areas affected by dengue have expanded, and there has been a gradual increase in the incidence over the recent years.7 8 In particular, an extensive outbreak of dengue hit China in 2014, and high risk areas for dengue outbreaks were concentrated in neighbouring provinces including Guangdong, Guangxi and Yunnan of southern China.9 In fact, during this 2014 outbreak, the number of dengue infections in China reached the highest level over the past 25 years.10
In China, dengue cases are notified to the China Center for Disease Control and Prevention (CDC) for the surveillance of spread pattern of dengue epidemic. We previously observed a remarkable spatial-temporal heterogeneity of dengue incidence in Guangdong, the most developed province of southern China, and showed that the dengue epidemic had noticeable seasonal and annual variability.9 10 In fact, recent studies suggest that dengue may now be endemic to China,11 and the dengue outbreaks are strongly related to climatic factors including temperature, rainfall and humidity, which have direct impacts on mosquito abundance.12 Enjoying a subtropical humid monsoon climate and frequent economic and cultural communication with the Southeast Asian countries,13 14 Guangdong has a potential high-risk opportunity for transmission of dengue. In particular, dengue poses a great burden of disease in the Pearl River Delta Region of Guangdong province, and the epidemic characteristics have been well documented.9–12
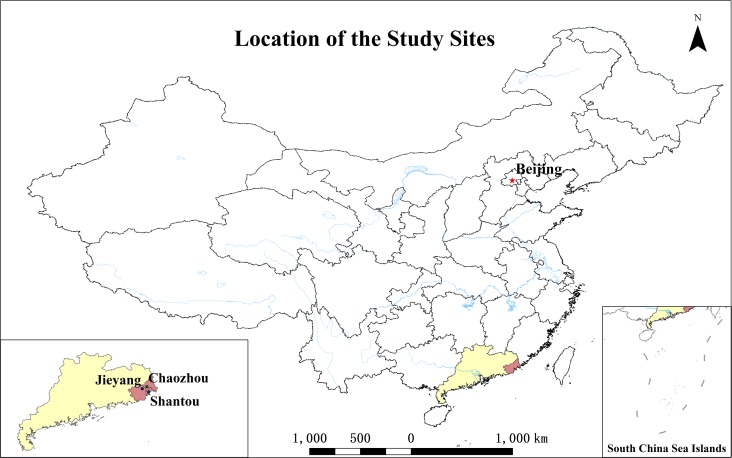
The impact of seasonal climatic variation on dengue dynamics in the Chao-Shan area (figure 1), the eastern part of Guangdong province, is poorly quantified. The Chao-Shan area is one of the special regions on China’s southeastern coast. The region has a jurisdiction area of around 10 918 square kilometres, with a very high population density. In addition, it is situated in the intersection part of the Tropic of Cancer and the coastline of the mainland China and has a subtropical oceanic monsoon climate with a mean annual temperature of around 22°C and an abundant precipitation per year.15 The subtropical oceanic monsoon climate conditions and the increasingly frequent cultural contact with Southeast Asian countries in the Chao-Shan area make it a high-risk area for mosquito-borne infectious diseases. In particular, mosquito vectors such as Aedes albopictus are reported as the major vector of dengue virus in the area.16
Figure 1.
Geographical location of Chao-Shan area including Shantou, Chaozhou and Jieyang cities on China’s southeastern coast.
Unfortunately, there are few comprehensive reports on the spatial-temporal epidemic pattern for dengue in the Chao-Shan area. The effects of seasonal climate variation on the dynamics of dengue and the associated disease burden in the region are still unclear. There is an urgent need to understand the association between dengue epidemics and seasonal climatic conditions in order to take corresponding protective measures. Therefore, this study aimed to assess the epidemic characteristics of dengue in the Chao-Shan area and the effect of seasonal climate variation on the dynamics of dengue for the period 1 January 2014–31 December 2017.
Materials and methods
Patient and public involvement
This time series study is reported as per the Strengthening the Reporting of Observational Studies in Epidemiology guidelines (see online supplementary table S1). We obtained the surveillance data of dengue in the study sites and only used the count data for statistical modelling. Patients and or public were not involved because this present study only used the data of the number of dengue cases to construct time series for assessing their associations with meteorological factors. Therefore, no ethics committee approval is required to obtain the data since the count data is presented.
bmjopen-2018-024197supp001.pdf (376.2KB, pdf)
Dengue case data
The Chao-Shan area including Shantou, Chaozhou and Jieyang cities is one of the most densely populated regions on China’s southeastern coast. In addition, this area has a subtropical oceanic monsoon climate, geographical position and the frequent culture, economic and trade exchanges with Southeast Asian countries. However, the epidemiological characteristics of dengue and disease burden associated with dengue infections are historically unclear. Therefore, the area was selected as the study site.
From 1 September 2008, all probable, clinic-confirmed and laboratory-confirmed cases of dengue were reported to the Chinese Center for Disease Control and Prevention (China CDC) and diagnosed according to the Diagnostic Criteria for Dengue17 released by the National Health Commission of China. Probable and confirmed cases were reported online to the China CDC within 24 hours of diagnosis by use of a standardised form including basic demographic information (sex, date of birth and residential address), case classification (probable, clinic-confirmed or laboratory-confirmed), date of symptoms onset and date of diagnosis. Data for dengue cases of Shantou, Chaozhou and Jieyang cities in the Chao-Shan area from 1 January 2014 to 31 December 2017 were available from the Guangdong Provincial CDC. Only indigenous dengue cases were included, and weekly number of dengue cases was calculated for statistical analysis.
Climate surveillance data
Daily average values for climatic variables including relative humidity, rainfall (millimetres) and temperature (°C) in the three cities during the study period from 1 January 2014 to 31 December 2017 were obtained from the Guangdong Provincial Climate Bureau. Weekly values of climatic variables were calculated as simple arithmetic means to show the seasonal peaks of dengue in surveillance data and used to assess the potential effect of seasonal variation on the dengue dynamics.
Statistical analysis
First, basic characteristics (number, median age, sex ratio and season and year of diagnosis) of dengue cases reported during the study period were described by city. By calculating the interval between the date of onset and the diagnosed date for each dengue case, we estimated the probability density function of the continuous variable of the ‘interval’ and then plot corresponding probability density distributions of the onset to diagnosis of dengue cases for the three cities. The median duration from onset to diagnosis by city was estimated. Each case of dengue has registered current address information. To identify high-risk areas of dengue in the Chao-Shan area, we applied a kernel smoothing method18 to plot the geographical distribution of cases by street or town. A total of 231 streets or towns in the Chao-Shan area covering the three cities were included in our dataset. ArcGIS 10.2 (ESRI, Redlands, California, USA) was used to plot the geographical distribution.
Third, to quantify seasonal patterns of dengue epidemic, time series of weekly case counts were plotted by city, and type of cases (probable or confirmed cases), respectively. The periodicity of the time series of dengue case counts, mean temperature, mean rainfall and mean relative humidity was assessed using time-dependent wavelet analysis.19 The time series data of dengue case counts and climatic factors were analysed by wavelet analysis, and then the wavelet decomposition results were used to calculate power spectrum. By decomposing the time series into the time–frequency domain, wavelet analysis can obtain the significant fluctuation pattern of the time series, that is, the periodic dynamic time pattern. A continuous Morlet wavelet transform on the time series was performed to extract specific frequency components. Then, the temporal periodicity in a time series was inspected with a wavelet plot. A statistical significance test was performed to test the null hypothesis that the signal in a wavelet plot is generated by a stable process of a given background power spectrum (usually white noise) at a certain time with significance level of 95%. The dplR package within R software was used for the Morlet wavelet analysis in this study.
Fourth, in view of the presence of overdispersion in the dengue case data set, a generalised additive model for location, scale and shape (GAMLSS) model20 with the distribution of the response variable obeying negative binomial distribution was performed to study the association between seasonal characteristics of dengue and climatic variables, including mean temperature, mean rainfall and mean relative humidity. We implemented the Rigby and Stasinopoulos algorithm20 to estimate the parameters of the models, and the number of cycles of the algorithm was set to 2000 to insure the convergence of the analysis results.
In order to assess the effects of climatic variables on seasonal dynamics of dengue, we established a set of GAMLSS models where climatic variables were modelled as smooth terms with different df. This was performed by changing the df for the smooth terms of 3 to 1 during model selection. We used the smoothing splines for the smooth terms in the GAMLSS models. We considered temperature, relative humidity and rainfall separately, then with both in model, then with all in model. In addition, some sensitivity analyses by setting df=0 in the smooth terms, where the df=0 means the distribution of the response variable is directly modelled as a linear parametric function of explanatory variables, for the three climatic factors considered separately, then both in model, then all in model. As a result, a total of 70 models were generated for comparison and evaluation. As model selection criterion, the Schwatz Bayesian Criterion (SBC)21 was used here. Models with lower value of SBC are preferred. In addition, we also added the autoregressive term, ln(1+Countlocallocal cases) in the previous month to account for the autoregressive effect in this study.10 The gamlss package within R software was used to establish the GAMLSS model. The values of partial effect function from a smoothing effect term in a GAMLSS model were extracted and plot against their predictors. We can identify the non-linear relationship between the dependent variable and the independent variables from this plot. R software (V.3.4.3) was used for the statistical analyses. R codes were provided to show how to employ the time-dependent wavelet analysis to assess the periodicity of the time series and GAMLSS model to study the association between seasonal characteristics of dengue and climatic variables (see online supplementary material, ‘R codes’).
Results
Basic characteristics of dengue cases notified during 2014–17 were shown in table 1. In total, 2193 probable and confirmed cases of dengue in the Chao-Shan area were reported to the China CDC system, of which 2148 (98.0%) were confirmed (clinic or laboratory confirmed) and 45 (2.1%) were probable, respectively. Among all the reported cases, the proportion (78.3%) of dengue cases reported in Chaozhou was higher than those among Shantou (13.0%) and Jieyang (8.8%). The median age for all notified cases was 43 years (IQR: 27.0–58.0 years), for Shantou cases 35 years (IQR: 23.0–49.0 years), Chaozhou cases 46 years (IQR: 29.0–59.0 years) and Jieyang cases 34 years (IQR: 25.0–50.0 years), respectively. The age distributions among probable and confirmed cases for Shantou and Jieyang cities were similar. The male-to-female ratio was 1:1.1 for all notified dengue cases. The sex distributions among cases for Jieyang were different from those for the other two cities.
Table 1.
Basic characteristics of dengue cases reported in the study areas during the period from 2014 to 2017
| Characteristics | City | Total | ||
| Shantou | Chaozhou | Jieyang | ||
| Number of cases, number (%) | 284 (13.0) | 1716 (78.3) | 193 (8.8) | 2193 (100) |
| Type of cases, number (%) | ||||
| Probable cases | 0 (0.0) | 45 (2.6) | 0 (0.0) | 45 (2.1) |
| Confirmed cases | 284 (100.0) | 1671 (97.4) | 193 (100.0) | 2148 (97.9) |
| Median age, years (IQR) | 35.0 (23.0–49.0) | 46.0 (29.0–59.0) | 34.0 (25.0–50.0) | 43.0 (27.0–58.0) |
| Sex, number (%) | ||||
| Male | 137 (48.2) | 819 (47.7) | 110 (57.0) | 1066 (48.6) |
| Female | 147 (51.8) | 897 (52.3) | 83 (43.0) | 1127 (51.4) |
| Season of diagnosis, number (%) | ||||
| Spring | 0 (0.0) | 0 (0.0) | 0 (0.0) | 0 (0.0) |
| Summer | 0 (0.0) | 33 (1.9) | 0 (0.0) | 33 (1.5) |
| Autumn | 281 (98.9) | 1680 (97.9) | 192 (99.5) | 2153 (98.2) |
| Winter | 3 (1.1) | 3 (0.2) | 1 (0.5) | 7 (0.3) |
| Year of diagnosis, number (%) | ||||
| 2014 | 247 (87.0) | 135 (7.9) | 86 (44.6) | 468 (21.3) |
| 2015 | 14 (4.9) | 1380 (80.4) | 6 (3.1) | 1400 (63.8) |
| 2016 | 5 (1.8) | 194 (11.3) | 0 (0.0) | 199 (9.1) |
| 2017 | 18 (6.3) | 7 (0.4) | 101 (52.3) | 126 (5.8) |
For the most recent year 2017 observed, most of the patients were male, irrespective of subgroup analysis results (figure 2A–C). The median time from illness onset to diagnosis was 6 days (IQR 2.8–8), 3 days (IQR 3–5) and 3 days (IQR 1–5) for Shantou, Chaozhou and Jieyang, respectively. The plot of probability density distributions also demonstrated that there was a longer onset-to-diagnosis interval for dengue cases in Shantou (figure 2D).
Figure 2.
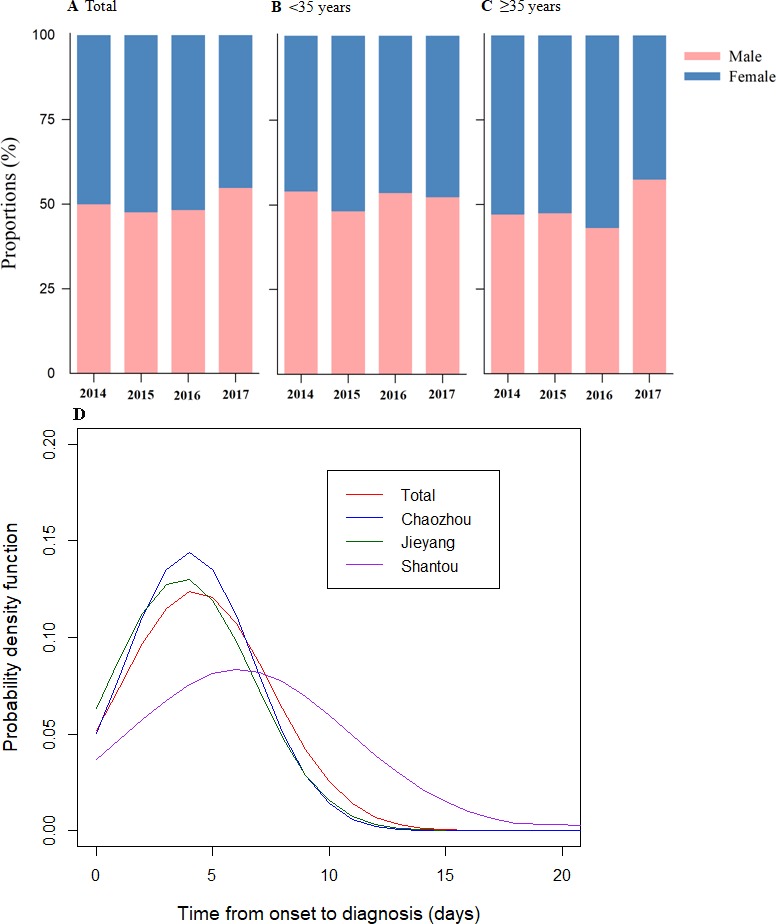
Proportions of gender-specific cases of dengue fever by age groups and estimates of onset-to-diagnosis distributions of dengue fever cases in Chao-Shan area, 2014–2017. (A) Based on total cases. (B) Based on cases aged less than 35 years. (C) Based on cases aged greater than or equal to 35 years. (D) Onset-to-diagnosis distribution by city.
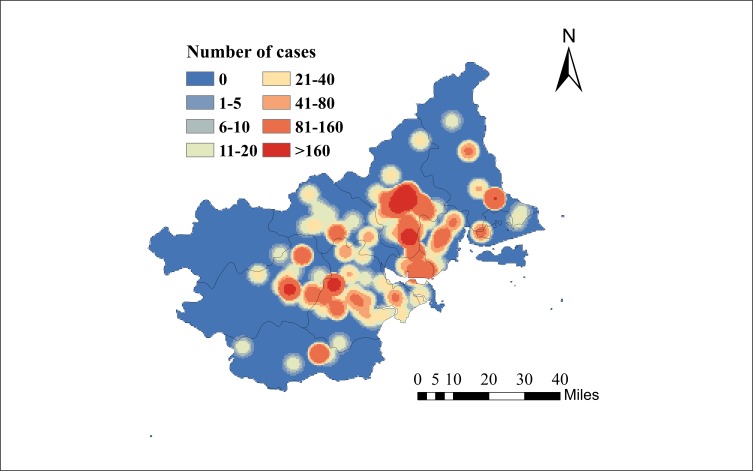
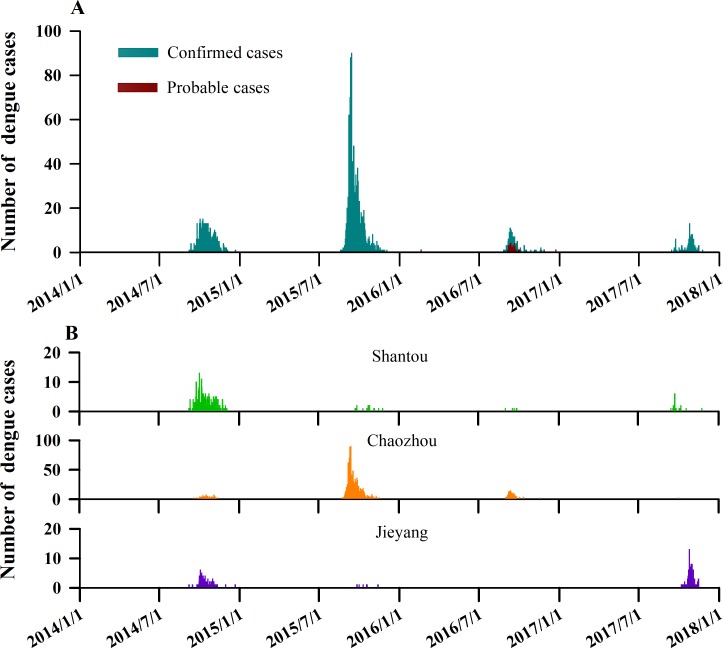
In figure 3, a kernel density estimate map from dengue case data with latitude/longitude coordinates shows geographical distributions of dengue cases in the Chao-Shan area. Spatial smoothing with the kernel density estimation produced dengue risk hotspots suggesting that the geographical regions with the greatest number of dengue cases were around Xixin and Chengxi streets in Chaozhou city. Overall, dengue showed annual peaks of activity, a major peak in autumn, consistent among time series of dengue cases in Shantou, Chaozhou and Jieyang (figure 4). Although Chao-Shan area had a seasonal attack of dengue peaking between September and October of each year, we observed that the number of dengue cases increased sharply in 2015 in Chaozhou.
Figure 3.
Geographical distributions of dengue cases in Chao-Shan area from the beginning of 2014 to the end of 2017. Spatial smoothing with the kernel density estimation produced dengue risk hotspots suggested that the geographical regions with the greatest number of dengue cases were around Xixin and Chengxi streets in Chaozhou city.
Figure 4.
Temporal dynamics of dengue in Chao-Shan area from the beginning of 2014 to the end of 2017. (A) Weekly time series of number of probable and confirmed dengue cases in Chao-Shan area. (B) Weekly time series of number of probable and confirmed dengue cases by city in Chao-Shan area.
Results of wavelet analysis for time series of notifications of dengue and climatic variables including mean temperature, mean rainfall and mean relative humidity in Chao-Shan area during the study period were shown in figure 5. It showed that the estimations of local powers for weekly time step examined were the largest at the period of 1 year, suggesting dengue cases showed a significant annual periodicity (figure 5A). In particular, based on the strongest power of the annual periodicity estimated for the time series of climatic variables (mean temperature, rainfall and relative humidity) throughout the study period (figure 5B–D), these factors broadly followed similar periodicity with that of dengue cases.
Figure 5.
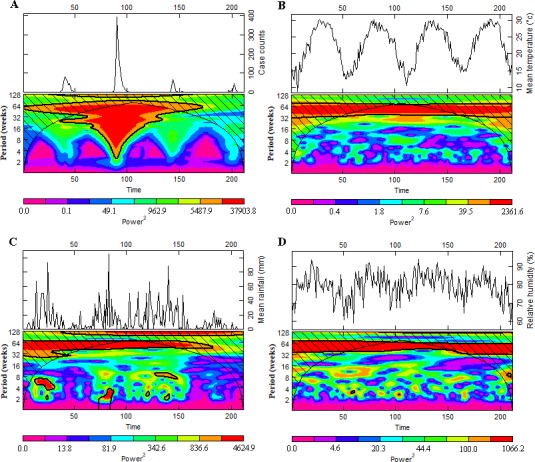
Wavelet analyses for time series of notifications of dengue and climatic variables including mean temperature, rainfall and relative humidity in Chao-Shan area, 2014–2017. Local wavelet power spectrum for dengue cases (A), mean temperature (B), rainfall (C) and relative humidity (D). Solid and bold lines indicate boundary of statistical significance.
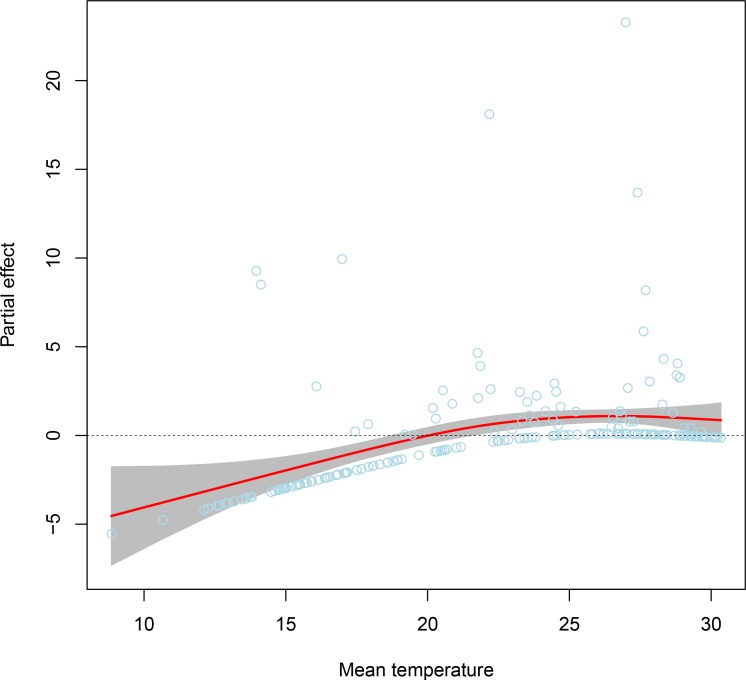
Based on the results of wavelet analysis, we further analysed the effects of climatic variables on seasonal dynamics of dengue using a framework of GAMLSS by testing different df for the smooth terms during model selection to determine an optimal model (see online supplementary table S2). We found that the model with the variable of mean temperature modelled as a smoothing spline term with df=1 had the smallest value of SBC and the best model fit among the 70 kinds of candidate models, suggesting that the effect of mean temperature on dengue dynamics in Chao-Shan area was most obvious. In addition, according to the GAMLSS framework, a significant non-linear partial effect of mean temperature on dengue dynamics have been observed, and the risk of dengue transmission was most when the temperature was between 25°C and 28°C (figure 6).
Figure 6.
Analysis of potentially non-linear effects of mean temperature on seasonal dynamics of dengue in Chao-Shan area using a generalised additive model for location, scale and shape (GAMLSS) model based on data from years 2014–2017. Initially, climatic variables including mean temperature, rainfall and relative humidity were assessed using the GAMLSS model with different df for the smooth terms during model selection. Then, the optimal model with the statistically significant variable (mean temperature) was determined. The values of partial effect function from a smoothing effect term in a GAMLSS model were extracted and plot against their predictors. This plot shows the significant non-linear partial effect of mean temperature on dengue dynamics, and the risk of dengue transmission is highest when the temperature is between 25°C and 28°C. The light blue dots denote partial residuals of the model, which were added in the plot to see how the model fits. From the dots of partial residuals, we can there are no outliers in the data.
Discussion
Our study of probable and confirmed cases of dengue reported to the national CDC surveillance system during 2014–2017 gives the first comprehensive estimation of the local burden and epidemiology of the disease in the study sites. Among the three cities covering a jurisdiction area of around 10 918 km2, Chaozhou is responsible for the largest proportion of all the notified dengue cases. We recorded a median age of infection at 43 years (IQR 27.0–58.0 years) for all notified dengue cases, and the male-to-female ratio was 1:1.1. Our study suggests that cases of dengue tend to arise in autumn season of the year, presenting a significant annual periodicity of epidemics. In particular, we found that the effect of temperature on dengue epidemics was most obvious among the climatic factors assessed.
This present analysis of spatial distribution patterns of dengue identified two main epidemiological regions corresponding to Xixin and Chengxi streets in Chaozhou city, where dengue peaks in autumn. We found that Chaozhou accounted for around 78% of the total number of dengue cases reported during the study period. We speculated that this may owe to the combined effect of multiple factors including its subtropical monsoonal climate, its industries producing abandoned ceramics that could provide abundant of breeding places for mosquitoes after raining and local residents’ habit of planting flowers at home providing breeding environment for mosquito vectors.22 Our results indicate that dengue cases showed a significant annual periodicity in Chao-Shan area. Findings from Asia-Pacific countries including Thailand, Laos and the Philippines have shown localised travelling waves of multiannual dengue epidemic cycles.23 By contrast, data of dengue virus isolate counts from Puerto Rico, a major population centre in the Caribbean, indicate interannual variation in transmission across multiple dengue serotypes.24 An epidemiological study from Machala, Ecuador, provided evidence of significant 1-year and 2-year cycles in dengue.25 In fact, our data were in agreement with another study indicating that significant coherences were observed between dengue incidence and temperature for the annual periodicity from 2005 to 2009 from Hanoi, Vietnam.26 Our wavelet analysis revealed that dengue transmission covaried with temperature at annual cycle, and we inferred that this acted as an important driver for the periodicity of dengue dynamics in Chao-Shan area.
This study built on potential links between dengue dynamics and climatic variables and quantified their relationships based on a kind of state-of-the-art flexible regression and smoothing technique, GAMLSS model, which enables us to handle adequately the problem of the presence of overdispersion in the data. The GAMLSS is a general framework for fitting semiparametric regression type models where the distribution of the response variable includes highly skew and kurtotic continuous and discrete distribution and allows all the parameters of the distribution of the response variable to be modelled as smooth functions of the explanatory variables.20 There is more flexibility in identifying those non-linearities using a generalised additive model (GAM)-based approach than traditional linear regression models.27 By inspecting a scatterplot (data were not shown) between dengue incidence and temperature, we found the relationship was non-linear, so it required the special estimation methods of the non-linear regression procedure. Additionally, the choice of df values is very important when constructing the GAMLSS model. Therefore, we performed a sensitivity analysis by trying different df in the smooth term of the model and determined an optimal model according to the assessment of model fit. Overall, our results revealed a powerful capability with GAMLSS model for catching the appropriate relationship between dengue incidence and temperature.
The associations between dengue seasonality and climatic variables such as temperature, rainfall, relative humidity, sunshine and El Niño-Southern Oscillation (ENSO) indices have been documented in previous studies.28 In this study, our results reveal that temperature has significantly non-linear effects on epidemics risk and intensity of dengue, with the greatest attributable risk due to temperature estimated at around 25°C. To identify the significantly associated climatic factors with dengue epidemics, we repeated model selections and adopted different climatic factors with different df in the smooth terms of the GAMLSS framework. We found that the variation in daily mean temperature partly drives dengue dynamics, and this climatic factor is closely related to the seasonal fluctuation of dengue incidence in Chao-Shan area. The association between temperature and seasonal dynamics of dengue observed in our study was also reported in previous studies in Guangzhou12 and Taiwan,29 which has a similar subtropical humid monsoon climate. The estimated effects of temperature driving the seasonal dynamics of dengue can be partly explained by some mechanisms, for example, temperature effects on the biting rate of mosquitoes,30 incubation period of pathogens31 and human exposure to mosquitoes.
Several limitations of this study should be mentioned. First, we did not consider potentially relevant factors, such as mosquito density and other environment elements including vegetation cover, distance to water bodies and so on. The variables may partly influence the relationship between temperature and dengue epidemics estimated in this work. In addition, although the quantitative results derived from this study pointed out that temperature was associated with increased risk of dengue transmission, other factors such as human activities during urbanisation and globalisation were also suggested to be very important in driving the long-term trends.8 32 At present, we cannot obtain the data on laboratory test results for various kinds of dengue viruses. Therefore, we cannot study the epidemical features of dengue cases caused by different viruses as well as the age-specific dengue antibody prevalence in the population. Furthermore, our results faced a common challenge for studies using data from surveillance with possible under-reporting or variations in diagnosis practices of cases. This was also suggested from a previous study.33
Conclusions
In summary, this study represented an initial step to analyse the epidemiological characteristics of dengue in Chao-Shan area, one of the most densely populated regions on China’s southeastern coast and used a statistically rigorous approach for assessing the effects of climatic factors on dengue epidemics. Overall, our results are helpful towards advancing our understanding of the pattern of how climate influences dengue, and useful for the control and prevention of the disease for local government in the study sites.
Supplementary Material
Footnotes
Contributors: QinZ, PG and WM conceived the study, undertook statistical analysis and drafted the manuscript. YC, YF, TL and QingZ collected the data and assisted in the statistical analysis. QinZ, PG, TL, QingZ and WM interpreted the results. QinZ, PG and TL wrote and revised the manuscript. All authors read and approved the final manuscript.
Funding: This work was supported by the National Key R&D Project of China (2018YFB0505500,2018YFB0505503), the National Natural Science Foundation of China (No. 81703323and 81773497), and the Top-tier University Construction Project under Departmentof Education of Guangdong Government (No. 2015022 and 2015023).
Disclaimer: The depiction of boundaries on the map(s) in this article do not imply the expression of any opinion whatsoever on the part of BMJ (or any member of its group) concerning the legal status of any country, territory, jurisdiction or area or of its authorities. The map(s) are provided without any warranty of any kind, either express or implied.
Competing interests: None declared.
Provenance and peer review: Not commissioned; externally peer reviewed.
Data sharing statement: Data are not publicly available because of personal privacy preservation. The dengue surveillance data are available from the corresponding authors on request. Requests for materials should be addressed to PG (email: pguo@stu.edu.cn) or TL (email: gztt_2002@163.com).
Patient consent for publication: Not required.
References
- 1. World Health Organization. Dengue: guidelines for diagnosis, treatment, prevention and control. Geneva: World Health Organization, 2009. [PubMed] [Google Scholar]
- 2. Halstead SB, O’Rourke EJ. Antibody-enhanced dengue virus infection in primate leukocytes. Nature 1977;265:739–41. 10.1038/265739a0 [DOI] [PubMed] [Google Scholar]
- 3. Guzman MG, Gubler DJ, Izquierdo A, et al. Dengue infection. Nat Rev Dis Primers 2016;2:16055 10.1038/nrdp.2016.55 [DOI] [PubMed] [Google Scholar]
- 4. Guzman MG, Harris E. Dengue. Lancet 2015;385:453–65. 10.1016/S0140-6736(14)60572-9 [DOI] [PubMed] [Google Scholar]
- 5. Morin CW, Comrie AC, Ernst K. Climate and dengue transmission: evidence and implications. Environ Health Perspect 2013;121(11-12):1264–72. 10.1289/ehp.1306556 [DOI] [PMC free article] [PubMed] [Google Scholar]
- 6. Bhatt S, Gething PW, Brady OJ, et al. The global distribution and burden of dengue. Nature 2013;496:504–7. 10.1038/nature12060 [DOI] [PMC free article] [PubMed] [Google Scholar]
- 7. Lai S, Huang Z, Zhou H, et al. The changing epidemiology of dengue in China, 1990-2014: a descriptive analysis of 25 years of nationwide surveillance data. BMC Med 2015;13:100 10.1186/s12916-015-0336-1 [DOI] [PMC free article] [PubMed] [Google Scholar]
- 8. Chen B, Liu Q. Dengue fever in China. Lancet 2015;385:1621–2. 10.1016/S0140-6736(15)60793-0 [DOI] [PubMed] [Google Scholar]
- 9. Guo P, Liu T, Zhang Q, et al. Developing a dengue forecast model using machine learning: A case study in China. PLoS Negl Trop Dis 2017;11:e0005973 10.1371/journal.pntd.0005973 [DOI] [PMC free article] [PubMed] [Google Scholar]
- 10. Xiao JP, He JF, Deng AP, et al. Characterizing a large outbreak of dengue fever in Guangdong Province, China. Infect Dis Poverty 2016;5:44 10.1186/s40249-016-0131-z [DOI] [PMC free article] [PubMed] [Google Scholar]
- 11. Lin YP, Luo Y, Chen Y, et al. Clinical and epidemiological features of the 2014 large-scale dengue outbreak in Guangzhou city, China. BMC Infect Dis 2016;16:102 10.1186/s12879-016-1379-4 [DOI] [PMC free article] [PubMed] [Google Scholar]
- 12. Xu L, Stige LC, Chan KS, et al. Climate variation drives dengue dynamics. Proc Natl Acad Sci U S A 2017;114:113–8. 10.1073/pnas.1618558114 [DOI] [PMC free article] [PubMed] [Google Scholar]
- 13. Shepard DS, Undurraga EA, Halasa YA. Economic and disease burden of dengue in Southeast Asia. PLoS Negl Trop Dis 2013;7:e2055 10.1371/journal.pntd.0002055 [DOI] [PMC free article] [PubMed] [Google Scholar]
- 14. Halstead SB. Dengue in the Americas and Southeast Asia: do they differ? Rev Panam Salud Publica 2006;20:407–15. 10.1590/S1020-49892006001100007 [DOI] [PubMed] [Google Scholar]
- 15. https://en.wikipedia.org/wiki/Chaoshan [Accessed 15 Feb 2019].
- 16. Yang S, Liu Q. Trend in global distribution and spread of Aedes Albopictus. Chin J Vector Biol Contr 2013;24:1–4. [Google Scholar]
- 17. National Health Commission of the People’s Republic of China. Diagnostic criteria for dengue fever. 2008. http://www.nhfpc.gov.cn/zhuz/s9491/200802/38819.shtml [Accessed 11 Apr 2018].
- 18. Silverman BW. Density Estimation for Statistics and Data Analysis. New York: Chapman and Hall, 1986. [Google Scholar]
- 19. Cazelles B, Chavez M, Magny GC, et al. Time-dependent spectral analysis of epidemiological time-series with wavelets. J R Soc Interface 2007;4:625–36. 10.1098/rsif.2007.0212 [DOI] [PMC free article] [PubMed] [Google Scholar]
- 20. Rigby RA, Stasinopoulos DM. Generalized additive models for location, scale and shape. Applied Statistics 2005;54:507–54. [Google Scholar]
- 21. Stasinopoulos DM, Rigby RA. Generalized Additive Models for Location Scale and Shape (GAMLSS) in R . J Stat Softw 2007;23:1–46. 10.18637/jss.v023.i07 [DOI] [Google Scholar]
- 22. Liu T, Zhu G, He J, et al. Early rigorous control interventions can largely reduce dengue outbreak magnitude: experience from Chaozhou, China. BMC Public Health 2017;18:90 10.1186/s12889-017-4616-x [DOI] [PMC free article] [PubMed] [Google Scholar]
- 23. van Panhuis WG, Choisy M, Xiong X, et al. Region-wide synchrony and traveling waves of dengue across eight countries in Southeast Asia. Proc Natl Acad Sci U S A 2015;112:13069–74. 10.1073/pnas.1501375112 [DOI] [PMC free article] [PubMed] [Google Scholar]
- 24. Bennett SN, Drummond AJ, Kapan DD, et al. Epidemic dynamics revealed in dengue evolution. Mol Biol Evol 2010;27:811–8. 10.1093/molbev/msp285 [DOI] [PMC free article] [PubMed] [Google Scholar]
- 25. Stewart-Ibarra AM, Muñoz ÁG, Ryan SJ, et al. Spatiotemporal clustering, climate periodicity, and social-ecological risk factors for dengue during an outbreak in Machala, Ecuador, in 2010. BMC Infect Dis 2014;14:37 10.1186/s12879-014-0610-4 [DOI] [PMC free article] [PubMed] [Google Scholar]
- 26. Do TT, Martens P, Luu NH, et al. Climatic-driven seasonality of emerging dengue fever in Hanoi, Vietnam. BMC Public Health 2014;14:1078 10.1186/1471-2458-14-1078 [DOI] [PMC free article] [PubMed] [Google Scholar]
- 27. Stasinopoulos D, Rigby R, Heller G, et al. Flexible Regression and Smoothing: Using GAMLSS in R. 2017.
- 28. Naish S, Dale P, Mackenzie JS, et al. Climate change and dengue: a critical and systematic review of quantitative modelling approaches. BMC Infect Dis 2014;14:167 10.1186/1471-2334-14-167 [DOI] [PMC free article] [PubMed] [Google Scholar]
- 29. Wu PC, Su HJ, Guo HR, et al. Temperature can be an effective predictor for dengue fever outbreak. Epidemiology 2005;16:S72. [Google Scholar]
- 30. Patz JA, Epstein PR, Burke TA, et al. Global climate change and emerging infectious diseases. JAMA 1996;275:217–23. 10.1001/jama.1996.03530270057032 [DOI] [PubMed] [Google Scholar]
- 31. Xiao FZ, Zhang Y, Deng YQ, et al. The effect of temperature on the extrinsic incubation period and infection rate of dengue virus serotype 2 infection in Aedes albopictus. Arch Virol 2014;159:3053–7. 10.1007/s00705-014-2051-1 [DOI] [PubMed] [Google Scholar]
- 32. Gubler DJ. Dengue, Urbanization and Globalization: The Unholy Trinity of the 21st Century. Trop Med Health 2011;39:S3–S11. 10.2149/tmh.2011-S05 [DOI] [PMC free article] [PubMed] [Google Scholar]
- 33. Yang B, Liu F, Liao Q, et al. Epidemiology of hand, foot and mouth disease in China, 2008 to 2015 prior to the introduction of EV-A71 vaccine. Euro Surveill 2017;22 10.2807/1560-7917.ES.2017.22.50.16-00824 [DOI] [PMC free article] [PubMed] [Google Scholar]
Associated Data
This section collects any data citations, data availability statements, or supplementary materials included in this article.
Supplementary Materials
bmjopen-2018-024197supp001.pdf (376.2KB, pdf)


