Abstract
Detection of malignant cells in tissue is a difficult hurdle in medical diagnostics and screening. Carbon nanotubes are extremely sensitive to their local environments, and nanotube-based field-effect transistors (NTFETs) provide a plethora of information regarding the mechanism of interaction with target analytes. Herein, we use a series of functionalized metal nanoparticle-decorated NTFET devices forming an array with multiple non-selective sensor units as the electronic “tongue”, sensing all five basic tastes. By extraction of selected NTFET characteristics using linear discriminant analysis, we have successfully detected and discriminated between malignant and non-malignant tissues and cells. We also studied the sensing mechanism and what NTFET characteristics are responsible for the variation of response between cell types, allowing for the design of future studies such as detection of malignant cells in a biopsy or the effects of malignant cells on healthy tissue.
Keywords: Biosensors, carbon nanotubes, electronic tongue, linear discriminant analysis, metal nanoparticle
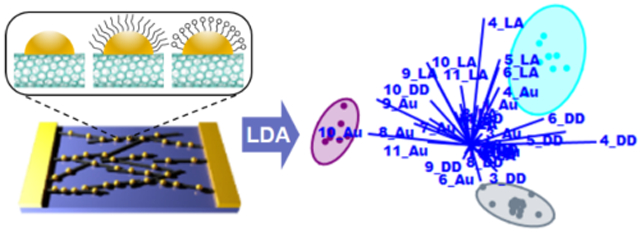
Graphical Abstract

Each cell type has its own unique distinct molecular fingerprint which varies based on the state of the cell.1 While tissue-to-tissue difference may be major, the distinction between malignant and non-malignant cells is often very subtle. Targets for detection and differentiation of malignant from healthy cells include intracellular components such as DNA, RNA, or proteins2 or extracellular components including exosomes, glycans, or microRNA.3 Detection may be accomplished with histopathology, bioimaging, or enzyme-linked immunosorbent assay (ELISA).4,5 Sensors based on the specific detection of biomarkers have been accomplished through surface plasmon resonance, fluorescence, and electrochemical interactions.6,7 Nanomaterials on the size range of many important biomolecules are ideal for applications in biosensing and cell studies.8-10 The unique properties of single-walled carbon nanotubes (SWCNTs) continue to generate interest in biosensing applications.11,12 Nanotube-based field-effect transistors (NTFETs) contain rich information on mechanism of response and are a useful method for fabricating sensitive and specific biosensors.13-15 Herein, we present a sensor array approach to distinguish and categorize species based on the changes of the transfer characteristics of an array of metal nanoparticle-decorated NTFET devices. The interface between metal nanoparticles and SWCNTs features strong electron transfer between metal and the graphitic surface of SWCNTs, which allows for sensitive probing subtle differences in chemical environment.16-19
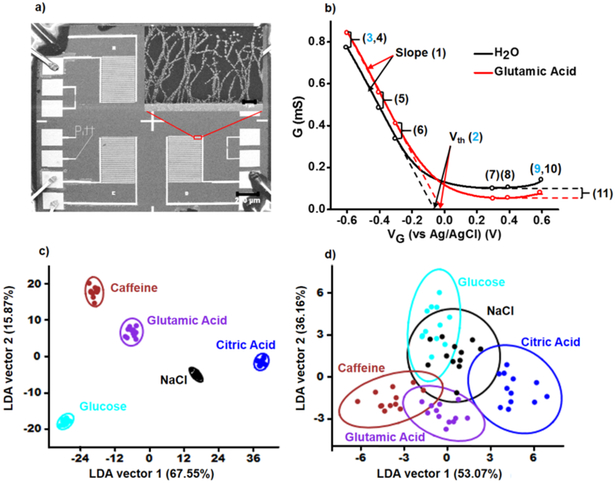
The NTFETs were fabricated by dielectrophoresis (DEP) deposition of SWCNT network aligned between interdigitated gold electrodes, followed by metal nanoparticle deposition using electrolysis (Figure 1a and Supporting Information, Figure S1). The differences in metal work functions modulate the magnitude of electron transfer into the SWCNT network for each device in the sensor array.17 The lack of specificity and high cross sensitivity of these devices generate a “fingerprint” for each species that can be distinguished through multivariate data analysis. The so-called electronic tongue (e-tongue) concept has been used with various sensor technologies to classify taste-related molecules and study cells based on a specific response pattern.20-25 Herein, we use linear discriminant analysis (LDA) to classify different analyte species by calculating a discriminant function based on linear combination of changes in the NTFET characteristics, which maximizes the variance between analytes and minimizes the variance within each analyte. The five-basic human tastants to human gustatory perception – saltiness (NaCl), sweetness (glucose), sourness (citric acid), bitterness (caffeine), and umami (glutamic acid) – were tested as a proof of concept. Eleven features were extracted from the NTFET transfer curves (Figure 1b), compounding a set of 55 characteristics (5 different devices: bare-oxidized SWCNT, Au, Pt, Rh, and Pd modified NTFETs times 11 characteristics). The selected 11 NTFET characteristics were: (1) relative change in transconductance, (2) threshold voltage (Vth) shift, (3, 10) relative change in conductance at ±0.6 Vg, (4-9) change in overall conductance normalized to conductance at Vth, and (11) the relative change in minimum conductance. These parameters were selected to accurately capture changes in NTFET transfer curves, which were previously described as “shifting” or “tilting” depending on the nanotube interactions with analytes.13 The data matrix containing the response and replicates of each tastant were input into PAST statistical software for LDA.26 All 11 characteristics were required to successfully differentiate between the five tastants in first two dimensions with canonical vectors of 67.55% and 15.87% (Figure 1c). When only three main device characteristics (min/max conductance and threshold) were considered, the five tastants could not be fully distinguished through LDA (Figure 1d). Regarding human and computational efforts, 11 points show to be a reasonable number to represent the changes in transfer characteristics covering the predominant mechanisms identified in NTFET biosensors including electrostatic gating, charge transfer effects, changes in scattering sites, charge-carrier mobility, and modulation of Schottky barriers.13 No single mechanism is expected to dominate, but rather weakly contribute to an overall signal.
Figure 1.
Metal nanoparticle-decorated NTFET. a) SEM micrograph of Si chip with interdigitated gold electrodes (scale bar = 200 μm). Inset: close-up of gold-decorated SWCNT network (scale bar = 1 μm). b) Source-drain conductance versus gate voltage (G-VG) of NTFET in nanopure water and after exposure to glutamic acid at 1 mM. Numbers represent G-VG parameters examined in this work. c, d) LDA results of the five tastants to human perception using c) eleven characteristics and d) three selected characteristics (depicted in blue in panel b). Ellipses represent 95% confidence intervals.
Cell discrimination was explored with a sensor array based on a series of three gold nanoparticle-decorated NTFET devices: bare gold (Au-SWCNT) and AuNP modified with SAMs of dodecanethiol (DD-SWCNT) and lipoic acid (LA-SWCNT). While Au-SWCNT devices interact directly with the cell samples, DD-SWCNT and LA-SWCNT have their interactions mediated by their terminal uncharged and charged moieties, respectively, which are expected to interact nonspecifically with the multitude of available biomolecules present on the cell surfaces and in the medium, modulating the changes in NTFET characteristics.
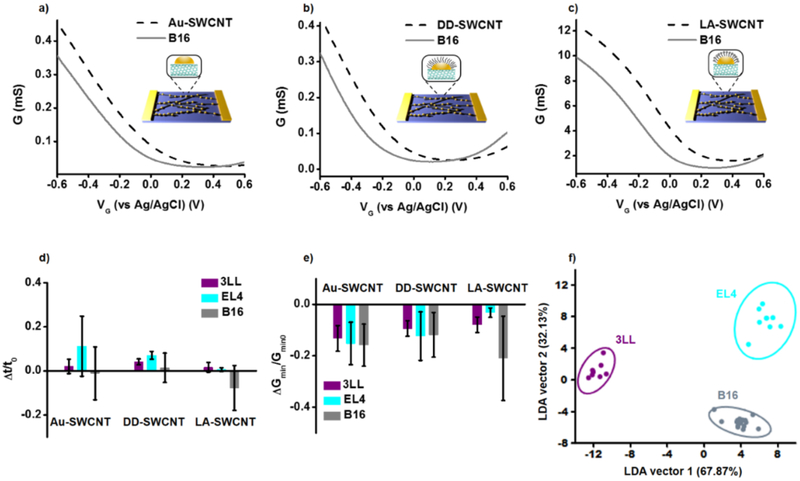
Initially, a set of three murine tumor cell lines (B16 melanoma, 3LL lung carcinoma, and EL4 lymphoma) were tested. NTFET transfer characteristics were collected from each device type in PBS as a baseline, and then a single cell solution in PBS at a 106 cells·mL−1 was introduced to the chip surface and allowed to incubate. For all samples, a minimum of eight devices were measured (two chips containing four devices each) per surface type. NTFET characteristics for B16 melanoma cells are presented in Figure 2. The shift between the curves show the subtle differences in the response of each device functionalization (Figure 2a-c). Full data set is available in Supporting Information (Figure S2) along with statistics (Figure S3) for all cells. Individual NTFET characteristics such as transconductance and minimum conductance (Figure 2d-e) cannot adequately distinguish between the cell cultures, and aforementioned 11 parameters were used with LDA to classify them.
Figure 2.
G-Vg curves, statistics, and LDA response to cancerous cell cultures. a-c) Characteristic NTFET curves for bare gold (Au-SWCNT), dodecanethiol (DD-SWCNT), and lipoic acid (LA-SWCNT) devices and their respective response to B16 melanoma. d-e) The average relative change in transconductance and minimum conductance (parameters 1 and 11 in Figure 1b, respectively) to 3LL, EL4, and B16 cell lines. Error bars represent one standard deviation. f) LDA result of all data collected for the three cancer cell lines condensed into the two canonical vectors which give the maximum variance in the data. Ellipses represent 95% confidence intervals.
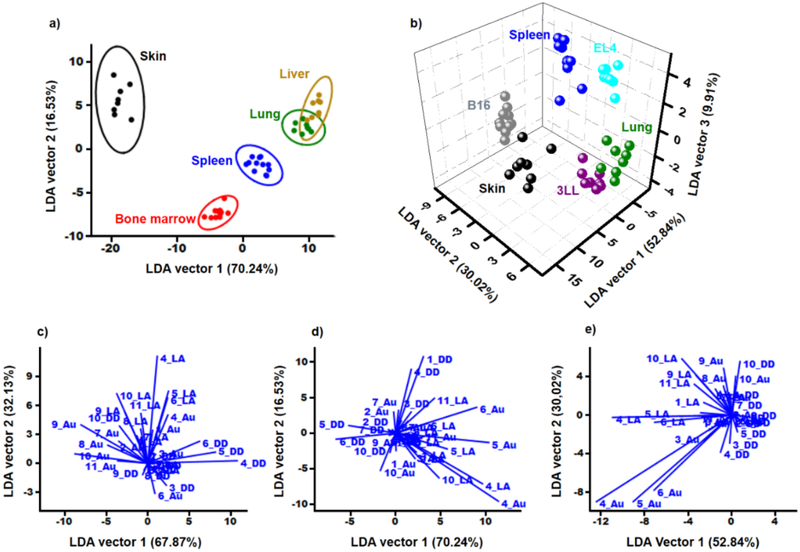
A data matrix containing the response and replicates of Au-SWCNT, DD-SWCNT, and LA-SWCNT to B16, 3LL, and EL4 tumor cell lines were input into PAST software and LDA was performed. By reducing a set of 33 variables (11 parameters times three surface types) to two canonical vectors, successful differentiation between the cell cultures was achieved with 100% of accuracy (Figure 2f). Three surface types are required for the correct cell culture classification, as any single surfaces do not result in good separation of data (Supporting Information, Figure S4) and misclassifications occur (Supporting Information, Table S1). To demonstrate the utility of the NTFET sensor platform and methodology toward more realistic samples, several types of murine tissue were harvested. Skin, spleen, liver, lung, and bone marrow samples were collected. After LDA, the first two canonical vectors account for more than 86% of data variance, allowing successful classification of all tested tissues (Figure 3a), although all three surfaces type are required (Supporting Information, Figure S7 and Table S2). To further show the ability of the platform for analyzing tissue samples, a blind sample was provided and tested with the sensor array. LDA can be used to classify objects in classes, but also to assign new objects to the appropriate classes.27 The data set generated previously was used and an unknown cell solution analyzed. After LDA, the unknown was successfully identified by the clustering pattern as bone marrow in three samples (Supporting Information, Figure S8)
Figure 3.
Linear discriminant analysis of healthy tissue versus cancer cells. a) LDA analysis of cells from healthy murine tissue samples. The first two canonical vectors explaining over 86% of variance in the data. Ellipses represent 95% confidence intervals. b) LDA results of healthy murine cells and their malignant counterparts lines: skin and B16 melanoma, spleen and EL4 lymphoma, lung and 3LL carcinoma. c-e) Biplots graphs showing the loadings vectors of each characteristic for cancer cell lines c), healthy murine tissues d), and healthy murine cells and their malignant counterparts cell lines e.
The previous results were combined in LDA to probe the method capability to distinguish between healthy tissue and their malignant counterparts. The results show that the first two canonical vectors were not sufficient to discriminate the classes, as they only account for ~82% of the variance (Supporting Information, Figure S9). However, a third variable accounting for additional 9% allows 3D visualization (Figure 3b). The platform can successfully characterize all the cell lines and murine tissue cell types tested.
Certain NTFET characteristics are associated with mechanisms contributing to response and therefore provide a deeper understanding of the sensor mechanism. Each Au-SWCNT surface tested presented negative shifts in threshold voltage between ~100-200 mV, on average. This shift results from electrostatic gating and charge screening from the plethora of positively charged molecules and lipids available in the surface membrane of the cell samples and is commonly observed in p-type NTFET biosensors. A reduction in the overall conductance of the devices observed through changes in their minimum conductance indicates the presence of charge transfer between absorbed molecules and AuNPs or directly to the SWCNT surface. The observed changes in transconductance provide evidence for modulation of charge carrier mobility (holes) through charge scattering, but this change may also be related to changes in capacitance on the surface of the device. Determining which is contributing here is difficult hurt due to the relatively low conductance in the n-type region (i.e., positive gate potentials) compared to the p-type region (i.e., negative gate potentials), typical of liquid-gated NTFET devices. Overall sensing mechanism is quite complex and likely relies on combinations of several of these interactions.
LDA can provide a deeper understanding of the difference in interaction of various cell types with the studied surfaces. The variance contribution of each characteristic considered in LDA could be calculated in terms of the intensity of its loading vector in a biplot graph (Figure 3c-e) and therefore which mechanisms predominate for the classification. The most important NTFET parameters associated with variance in the data among cell types involve LA-SWCNT and Au-SWCNT variations in conductance at ±0.6 V (characteristics 4 and 9 in Figure 1b), which were involved in the “tilting” or “bending” of the curve, ascribed to (i) modulation of Schottky barriers between gold and the SWCNT, (ii) changes in capacitance of device surface, or (iii) changes in hole carrier mobility of the device, followed by changes in conductance across the curve in DD-SWCNT and Au-SWCNT devices (characteristics 5 and 6 in Figure 1b), which could be ascribed to electrostatic gating effects.
Different interactions could be associated with the observed electrical response: membrane interactions driven by cellular adhesion to the surface and various contributions of extracellular environment, which varies between cell and tissue types. The contribution of the extracellular environment was probed by treating bone marrow cells with monensin, an inhibitor of exocytosis. This treatment resulted in a large change in LDA result (Supporting Information, Figure S10), indicating that the extracellular environment plays a significant role in the overall NTFET response. Optical images of normal bone marrow cells after NTFET measurements are presented in Figure S11.
A new method to extract features of NTFET covering the predominant sensing mechanisms previously described in the literature were incorporated into LDA analysis, which allows for differentiation between the five basic tastants for human perception, several murine tissues and their cancerous counterparts. The method allows for the direct visualization of the contribution of mechanisms associated with sensor response, important for the design of future applications which may include, but are not limited to: electronic tongues and noses, detection of malignant cells in biopsied tissues, studies probing the effects of malignant cells on healthy cells, and response of immune cells to drug treatment, all of which require tracking subtle changes in the local biochemical environment for reliable measurements.
Supplementary Material
ACKNOWLEDGMENT
This work was supported by the National Institute of Environmental Health Sciences [Award R01ES019304]. G.O.S. was supported by CAPES [process number 99999.00278/2015-02].
Footnotes
Supporting Information
Supporting Information Available: The following files are available free of charge.
Nano-e-tongue_SI (PDF)
Experimental section, SEM micrographs of SWNT networks decorated with metal nanoparticles, FET G-Vg curves, average responses, LDA results using single and two device functionalizations, confusion matrices for LDA results, LDA response to healthy murine cell samples along with an unknown sample, LDA response to murine tissue cell samples along with monensin-treated bone marrow cells, optical image of bone marrow cells on Au-SWCNT.
The authors declare no competing financial interests.
REFERENCES
- (1).Srinivas PR; Kramer BS; Srivastava S Trends in Biomarker Research for Cancer Detection. Lancet Oncol. 2001, 2 (11), 698–704. [DOI] [PubMed] [Google Scholar]
- (2).Pantel K; Brakenhoff RH; Brandt B Detection, Clinical Relevance and Specific Biological Properties of Disseminating Tumour Cells. Nat. Rev. Cancer 2008, 8 (5), 329–340. [DOI] [PubMed] [Google Scholar]
- (3).Lusi EA; Passamano M; Guarascio P; Scarpa A; Schiavo L Innovative Electrochemical Approach for an Early Detection of microRNAs. Anal. Chem. 2009, 81 (7), 2819–2822. [DOI] [PubMed] [Google Scholar]
- (4).Demeritte T; Fan Z; Sinha SS; Duan J; Pachter R; Ray PC Gold Nanocage Assemblies for Selective Second Harmonic Generation Imaging of Cancer Cell. Chem. - A Eur. J. 2014, 20 (4), 1017–1022. [DOI] [PubMed] [Google Scholar]
- (5).Hong H; Yang K; Zhang Y; Engle JW; Feng L; Yang Y; Nayak TR; Goel S; Bean J; Theuer CP; Barnhart TE; Liu Z; Cai W In Vivo Targeting and Imaging of Tumor Vasculature with Radiolabeled, Antibody-Conjugated Nanographene. ACS Nano 2012, 6 (3), 2361–2370. [DOI] [PMC free article] [PubMed] [Google Scholar]
- (6).Craig D; McAughtrie S; Simpson J; McCraw C; Faulds K; Graham D Confocal SERS Mapping of Glycan Expression for the Identification of Cancerous Cells. Anal. Chem. 2014, 86 (10), 4775–4782. [DOI] [PubMed] [Google Scholar]
- (7).Hizir MS; Balcioglu M; Rana M; Robertson NM; Yigit MV Simultaneous Detection of Circulating oncomiRs from Body Fluids for Prostate Cancer Staging Using Nanographene Oxide. ACS Appl. Mater. Interfaces 2014, 6 (17), 14772–14778. [DOI] [PubMed] [Google Scholar]
- (8).Gruner G Carbon Nanotube Transistors for Biosensing Applications. Anal. Bioanal. Chem. 2006, 384 (2), 322–335. [DOI] [PubMed] [Google Scholar]
- (9).Duan X; Gao R; Xie P; Cohen-Karni T; Qing Q; Choe HS; Tian B; Jiang X; Lieber CM Intracellular Recordings of Action Potentials by an Extracellular Nanoscale Field-Effect Transistor. Nat. Nanotechnol. 2012, 7 (3), 174–179. [DOI] [PMC free article] [PubMed] [Google Scholar]
- (10).Zhang Y; Guo Y; Xianyu Y; Chen W; Zhao Y; Jiang X Nanomaterials for Ultrasensitive Protein Detection. Adv. Mater. 2013, 25 (28), 3802–3819. [DOI] [PubMed] [Google Scholar]
- (11).Reuel NF; Grassbaugh B; Kruss S; Mundy JZ; Opel C; Ogunniyi AO; Egodage K; Wahl R; Helk B; Zhang J; Kalcioglu ZI ; Tvrdy K; Bellisario DO; Mu B; Blake SS; Van Vliet KJ; Love JC; Wittrup KD; Strano MS Emergent Properties of Nanosensor Arrays: Applications for Monitoring IgG Affinity Distributions, Weakly Affined Hypermannosylation, and Colony Selection for Biomanufacturing. ACS Nano 2013, 7 (9), 7472–7482. [DOI] [PubMed] [Google Scholar]
- (12).Antaris AL; Yaghi OK; Hong G; Diao S; Zhang B; Yang J; Chew L; Dai H Single Chirality (6,4) Single-Walled Carbon Nanotubes for Fluorescence Imaging with Silicon Detectors. Small 2015, 11 (47), 6325–6330. [DOI] [PubMed] [Google Scholar]
- (13).Heller I; Janssens AM; Männik J; Minot ED; Lemay SG; Dekker C Identifying the Mechanism of Biosensing with Carbon Nanotube Transistors. Nano Lett. 2008, 8 (2), 591–595. [DOI] [PubMed] [Google Scholar]
- (14).Allen BL; Kichambare PD; Star A Carbon Nanotube Field-Effect-Transistor-Based Biosensors. Adv. Mater. 2007, 19 (11), 1439–1451. [Google Scholar]
- (15).Choi Y; Olsen TJ; Sims PC; Moody IS; Corso BL; Dang MN; Weiss GA; Collins PG Dissecting Single-Molecule Signal Transduction in Carbon Nanotube Circuits with Protein Engineering. Nano Lett. 2013, 13 (2), 625–631. [DOI] [PMC free article] [PubMed] [Google Scholar]
- (16).Star A; Tu E; Niemann J; Gabriel J-CP; Joiner CS; Valcke C Label-Free Detection of DNA Hybridization Using Carbon Nanotube Network Field-Effect Transistors. Proc. Natl. Acad. Sci. 2006, 103 (4), 921–926. [DOI] [PMC free article] [PubMed] [Google Scholar]
- (17).Kauffman DR; Star A Chemically Induced Potential Barriers at the Carbon Nanotube- Metal Nanoparticle Interface. Nano Lett 2007, 7 (7), 1863–1868. [DOI] [PubMed] [Google Scholar]
- (18).Kauffman DR; Sorescu DC; Schofield DP; Allen BL; Jordan KD; Star A Understanding the Sensor Response of Metal-Decorated Carbon Nanotubes. Nano Lett. 2010, 10 (3), 958–963. [DOI] [PubMed] [Google Scholar]
- (19).Ding M; Tang Y; Star A Understanding Interfaces in Metal – Graphitic Hybrid Nanostructures. J. Phys. Chem. Lett. 2013, 4, 147–160. [DOI] [PubMed] [Google Scholar]
- (20).Litvinenko SV; Bielobrov D; Lysenko V; Nychyporuk T; Skryshevsky VA Might Silicon Surface Be Used for Electronic Tongue Application? ACS Appl. Mater. Interfaces 2014, 6 (21), 18440–18444. [DOI] [PubMed] [Google Scholar]
- (21).Bajaj A; Miranda OR; Kim I-B; Phillips RL; Jerry DJ; Bunz UHF; Rotello VM Detection and Differentiation of Normal, Cancerous, and Metastatic Cells Using Nanoparticle-Polymer Sensor Arrays. Proc. Natl. Acad. Sci. U. S. A. 2009, 106, 10912–10916. [DOI] [PMC free article] [PubMed] [Google Scholar]
- (22).Rana S; Le NDB; Mout R; Saha K; Tonga GY; Bain RES; Miranda OR; Rotello CM; Rotello VM A Multichannel Nanosensor for Instantaneous Readout of Cancer Drug Mechanisms. Nat. Nanotechnol. 2014, 10 (1), 65–69. [DOI] [PMC free article] [PubMed] [Google Scholar]
- (23).Zhang AQ; Lieber CM Nano-Bioelectronics. Chem. Rev. 2016, 116 (1), 215–257. [DOI] [PMC free article] [PubMed] [Google Scholar]
- (24).Wang B; Cancilla JC; Torrecilla JS; Haick H Artificial Sensing Intelligence with Silicon Nanowires for Ultraselective Detection in the Gas Phase. Nano Lett. 2014, 14 (2), 933–938. [DOI] [PubMed] [Google Scholar]
- (25).Nakhleh MK; Amal H; Jeries R; Broza YY; Aboud M; Gharra A; Ivgi H; Khatib S; Badarneh S; Har-Shai L; Glass-Marmor L; Lejbkowicz I; Miller A; Badarny S; Winer R; Finberg J; Cohen-Kaminsky S; Perros F; Montani D; Girerd B; Garcia G; Simonneau G; Nakhoul F; Baram S; Salim R; Hakim M; Gruber M; Ronen O; Marshak T; Doweck I; Nativ O; Bahouth Z; Shi DY; Zhang W; Hua QL; Pan YY; Tao L; Liu H; Karban A; Koifman E; Rainis T; Skapars R; Sivins A; Ancans G; Liepniece-Karele I; Kikuste I; Lasina I; Tolmanis I; Johnson D; Millstone SZ; Fulton J; Wells JW; Wilf LH; Humbert M; Leja M; Peled N; Haick H Diagnosis and Classification of 17 Diseases from 1404 Subjects via Pattern Analysis of Exhaled Molecules. ACS Nano 2017, 11 (1), 112–125. [DOI] [PMC free article] [PubMed] [Google Scholar]
- (26).HAMMER Ø; Harper D. A. T. a. T.; Ryan PD PAST: Paleontological Statistics Software Package for Education and Data Analysis. Palaeontol. Electron. 2001, 4(1) (1), 1–9. [Google Scholar]
- (27).Jurs PC; Bakken GA; McClelland HE Computational Methods for the Analysis of Chemical Sensor Array Data from Volatile Analytes. Chem. Rev. 2000, 100 (7), 2649–2678. [DOI] [PubMed] [Google Scholar]
Associated Data
This section collects any data citations, data availability statements, or supplementary materials included in this article.


