Abstract
High autophagic activity in podocytes, terminally differentiated cells that serve as main components of the kidney filtration barrier, is essential for podocyte survival under various challenges. How podocytes maintain such a high level of autophagy, however, remains unclear. Here we report that signal regulatory protein α (SIRPα) plays a key role in promoting podocyte autophagy. Unlike other glomerular cells, podocytes strongly expressed SIRPα, which was, however, downregulated in patients with focal segmental glomerulosclerosis and mice with experimental nephropathy. Podocyte SIRPα levels were inversely correlated with the severity of podocyte injury and proteinuria but positively with autophagy. Compared with WT littermates, Sirpa-deficient mice displayed greater age-related podocyte injury and proteinuria and developed more rapid and severe renal injury in various models of experimental nephropathy. Mechanistically, podocyte SIRPα strongly reduced Akt/GSK-3β/β-catenin signaling, leading to an increase in autophagic activity. Our findings thus demonstrate a critical protective role of SIRPα in podocyte survival via maintenance of autophagic activity.
Keywords: Nephrology
Keywords: Autophagy
Podocytes highly express signal regulatory protein α, which plays an essential role to maintain high autophagic activity and thus protect podocytes.
Introduction
Podocytes, as well as their associated highly complex 3D framework, are main components of the kidney filtration barrier. Although this podocyte-based kidney filtration barrier is a highly efficient filtration device that produces a large volume of protein-free ultrafiltrate per day, it is the most vulnerable component of the kidney and is responsible for the majority of progressive kidney diseases leading to end-stage renal disease (ESRD). Podocyte injury is a key determinant of urinary protein loss and can serve as a marker to predict proteinuric glomerular disease progression (1, 2). Unlike all other cell types forming the kidney filtration complex, podocytes are terminally differentiated cells and have an extremely limited capacity for replacement (3). On the other hand, podocytes face various challenges, including environmental factors such as infection, hyperglycemia, and intracellular stress, resulting in the accumulation of damaged proteins, lipids, and organelles (4). For podocytes to survive and perform filtration barrier function, they must develop the ability to cope with these stresses. Recent studies suggest that glomerular autophagy might be a major mechanism preventing podocyte degeneration (5). Podocytes maintain a high basal level of autophagic activity, and autophagy plays a critical role in the homeostasis of podocytes during glomerular disease and aging (6, 7). However, the regulatory mechanism underlying the capacity for podocytes to maintain high autophagic activity is poorly understood.
Signal regulatory protein α (SIRPα), an IgSF family member with 2 immunoreceptor tyrosine-based inhibitory motifs (ITIMs) in the cytoplasmic tail, plays an important role in modulating almost all aspects of leukocyte immune responses, such as adhesion, migration, and phagocytosis (8). It has been well documented that SIRPα’s function is mainly dependent on its ITIMs (9–11). Phosphorylation of SIRPα ITIMs will recruit and activate SHP-1/2, which in turn dephosphorylate a panel of substrates to initiate various signaling pathways downstream (9). One such substrate is Akt (12), which is involved in modulating cell survival and autophagy. It may be that SIRPα is also involved in regulating cellular autophagy through its regulation of Akt. The possibility that SIRPα plays a role in autophagy is consistent with the findings that SIRPα level (13) and autophagic activity (14) in leukocytes increase at the same time during cellular maturation. A recent study by Kurihara et al. showed that SIRPα is expressed in podocytes but not other glomerular cells (15). Interestingly, their study suggests that SIRPα may play a role in glomerular cell-cell communication through interaction with its ligand CD47. The role of podocyte SIRPα in nephropathy development, however, remains unclear.
In the present study, we observed that Sirpa-deficient (Sirpa–/–) mice display significant age-related proteinuria and podocyte injury, and also develop more rapid and severe nephropathy in various mouse models of nephropathy. In line with this, the podocyte SIRPα level was reduced in patients with focal segmental glomerular sclerosis (FSGS) and mice treated with puromycin aminonucleoside (PAN), adriamycin (ADR), and streptozotocin (STZ). The results showed that podocyte SIRPα expression correlates positively with autophagy activity but negatively with glomerular pathology. Our mechanistic studies suggest that SIRPα modulates the phosphorylation of Akt and subsequent Akt/GSK-3β/β-catenin signaling pathway to control podocyte autophagy. Finally, maintaining podocyte SIRPα levels during glomerular disease progression via delivery of SIRPα-expressing plasmid reversed PAN-induced proteinuria and glomerular damage. Our results demonstrate that podocyte SIRPα serves as a safeguard against podocyte injury through promotion of autophagic activity.
Results
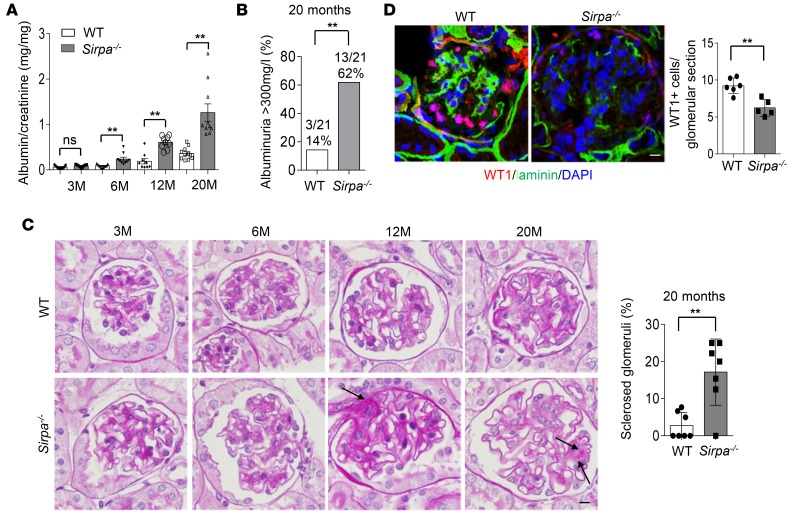
SIRPαdeficiency results in murine proteinuria and podocyte injuries from aging. Although Sirpa–/– mice appeared healthy under the standard specific pathogen–free housing conditions, we found that, compared with their WT littermates, Sirpa–/– mice displayed age-dependent onset of proteinuria (Supplemental Figure 1; supplemental material available online with this article; https://doi.org/10.1172/jci.insight.124747DS1), podocyte injury, and glomerulosclerosis. As shown in Figure 1A, the albumin/creatinine ratio in Sirpa–/– mice increased as the mice aged. At 6 months, the albumin/creatinine ratio in Sirpa–/– mice was significantly higher than that in WT mice. At 20 months, more than 60% of Sirpa–/– mice developed albuminuria of more than 300 mg/l compared with only approximately 15% of WT mice (Figure 1B). Histological analysis of WT and Sirpa–/– mouse kidney tissue sections showed that Sirpa–/– mice had significantly more sclerosed glomeruli (Figure 1C, arrows) compared with WT mice at 20 months of age. In addition to morphologic change, massive loss of Wilms tumor 1–positive (WT1-positive) cells in kidneys from 20-month Sirpa–/– mice was detected by WT1 immunostaining and quantification (Figure 1D), indicating podocyte cell loss in 20 months Sirpa–/– mice.
Figure 1. SIRPα deficiency results in an age-dependent onset of proteinuria, loss of podocytes, and glomerulosclerosis.
(A) Albumin/creatinine ratio in Sirpa–/– and WT mice at 3, 6, 12, and 20 months (M). (B) Percentages of albuminuria >300mg/l in 20-month-old WT and Sirpa–/– mice (n = 18 WT and n = 20 Sirpa–/– mice; P value was analyzed by Fisher’s exact test). (C) Histology of WT and Sirpa–/– mice at 3, 6, 12, and 20 months (arrows indicate glomerulosclerosis). The histogram represents statistical analysis of sclerosed glomeruli in 20-month WT and Sirpa–/– mice (n = 7 WT mice and n = 7 Sirpa–/– mice; 10–20 glomeruli of each mouse were analyzed). (D) WT1 immunostaining and quantification of WT1-positive glomerular cells in kidneys from 20 months WT and Sirpa–/– mice (glomeruli from n = 6 WT mice and n = 5 Sirpa–/– mice, were analyzed). Scale bars in C and D: 10 μm. Data in A, C, and D represent mean ± SEM, and P value was analyzed by 2-tailed Student’s t test. **P < 0.01.
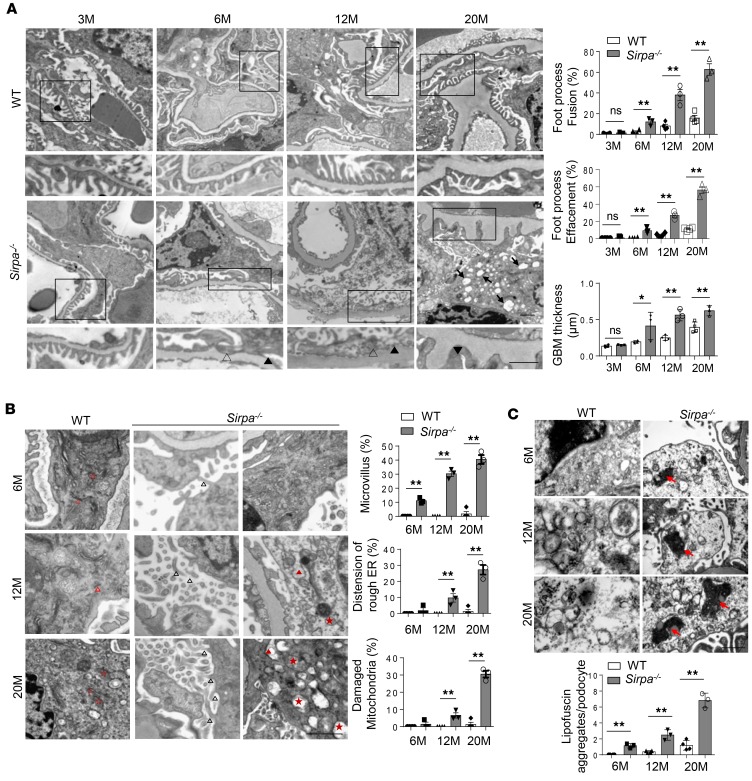
The ultrastructure of murine glomeruli was further analyzed using transmission electron microscopy (TEM). As shown in Figure 2A, more severe foot process fusion (filled black arrowheads), foot process effacement (open arrowheads), and glomerular basement membrane (GBM) thickness was observed in glomeruli of 6-, 12-, and 20-month-old Sirpa–/– mice than WT mice at the same age. A larger number of vacuoles (black arrows) were also found in podocytes from 20-month-old Sirpa–/– mice than WT mice (Figure 2B). Given that podocytes can synthesize the matrix components of the GBM (16), the irregular thickening of the GBM that we observed in SIRPα-knockout mice by 6 months of age may have been caused by the impaired podocytes. We thus analyzed the detailed ultrastructure of podocytes, including microvillus formation, ER, and mitochondria. As shown in Figure 2B, aging Sirpa–/– mice displayed obvious abnormalities such as microvillus formation (filled black arrowheads), distension of rough ER (filled red arrowheads), and damaged mitochondria (filled red stars) in podocytes compared with WT mice (open red arrowheads and stars), which showed no such structural disruption in their podocytes. Lipofuscin is one of the best markers of aging, and the accumulation of lipofuscin has been related to mitochondrial damage and oxidative stress (17). As lipofuscin cannot be completely hydrolyzed, due to its dense structure, or released from cells, it will affect the cellular metabolism and promote cell senescence when it accumulates in the cell. Therefore, we measured the degree of lipofuscin accumulation in podocytes of Sirpa–/– mice. As shown in Figure 2C, the prominent accumulation of lipofuscin (red arrows) in podocytes of Sirpa–/– mice by 6 months of age indicated that SIRPα deficiency accelerated the degeneration and aging of podocytes.
Figure 2. Detailed transmission electron microscopy analysis of glomeruli in SIRPα–deficient mice.
(A) Transmission electron microscopy (TEM) of foot process fusion and effacement of podocytes and the glomerular basement membrane (GBM) (podocytes of n = 4 WT mice and n = 3 Sirpa–/– mice were analyzed). Open arrowheads, foot process fusion; filled arrowheads, foot process effacement; filled arrows, vacuoles. Histograms represent quantification of foot process fusion, effacement of podocytes, and GBM thickness. (B) TEM of the glomerulus of 6-, 12-, and 20-month-old WT and Sirpa–/– mice. Open black arrowheads, microvillus; open red arrowheads, regular rough ER; filled red arrowheads, distension of rough ER; open red stars, regular mitochondria; filled red stars, damaged mitochondria. Histograms represent quantification of microvillus formation, distension of rough ER, and damaged mitochondria in WT versus Sirpa–/– mice. (podocytes of n = 4 WT mice and n = 3 Sirpa–/– mice were analyzed). (C) Lipofuscin accumulation in 6-, 12-, and 20-month-old Sirpa–/– mice (podocytes of n = 4 WT mice and n = 3 Sirpa–/– mice were analyzed). Arrows indicate lipofuscin aggregates. The histogram represents statistical analysis of lipofuscin aggregates. Scale bars: 1 μm. Data represent the mean ± SEM, and P value was analyzed by 2-tailed Student’s t test. *P < 0.05, **P < 0.01.
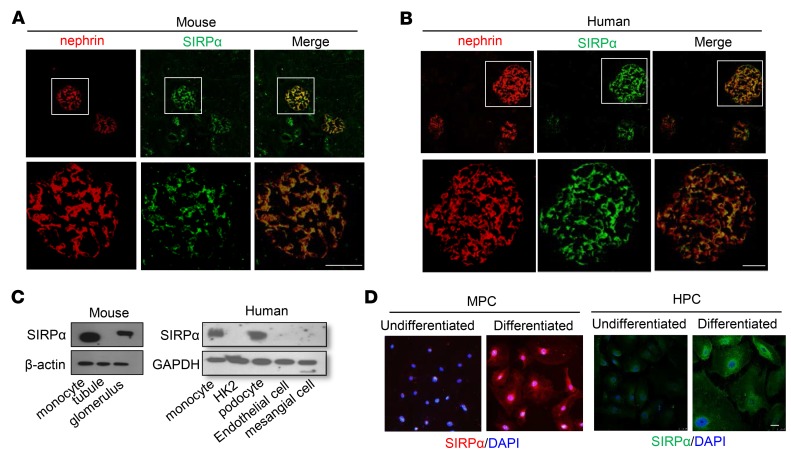
Podocyte SIRPαis significantly downregulated in nephropathy. To explore how SIRPα deficiency leads to age-associated murine proteinuria and podocyte injuries, we first examined the distribution of SIRPα in murine kidneys. As shown in Figure 3A, double staining of murine kidney tissue sections with antibodies against SIRPα (green) and nephrin (red), a podocyte marker, showed perfect colocalization of SIRPα and nephrin in murine glomeruli, suggesting that SIRPα is expressed in podocytes but not other glomerular cells. Colocalization of SIRPα with podocin, another podocyte marker protein, was also observed in murine glomeruli (Supplemental Figure 2). These findings are in agreement with the previous report that SIRPα is expressed in rat podocytes (15). Specific expression of SIRPα in podocytes was validated in human kidney tissue sections. A similar identical localization pattern of SIRPα and nephrin was observed in human glomeruli (Figure 3B). Western blot analysis of SIRPα levels in various cell types confirmed that murine glomeruli (Figure 3C, left) and human podocytes (Figure 3C, right) expressed SIRPα at a level comparable to that in monocytes. In contrast, murine renal tubule cells (Figure 3C, left) and the human renal tubule (HK2), endothelial (HMEC-1), and mesangial (T-SV40) cell lines (Figure 3C, right) did not express SIRPα. In line with this, when murine podocyte cell lines (MPC) (Figure 3D, left) and human podocyte cell lines (HPC) (Figure 3D, right) were differentiated into functional podocytes, SIRPα expression in differentiated podocytes was strongly increased compared with that in undifferentiated cells.
Figure 3. SIRPα is specifically expressed on podocytes.
(A) SIRPα colocalizes with nephrin in mouse glomerulus. (B) SIRPα colocalizes with nephrin in human glomerulus. (C) SIRPα is expressed in mouse glomerular lysates but not tubular lysates (left) and in human podocytes (monocyte served as a positive control) but not human HK2 cells, endothelial cells, or mesangial cells (right). (D) Induction of SIRPα in differentiated mouse podocytes (MPC) (left) and human podocytes (HPC) (right). Scale bars: 25 μm.
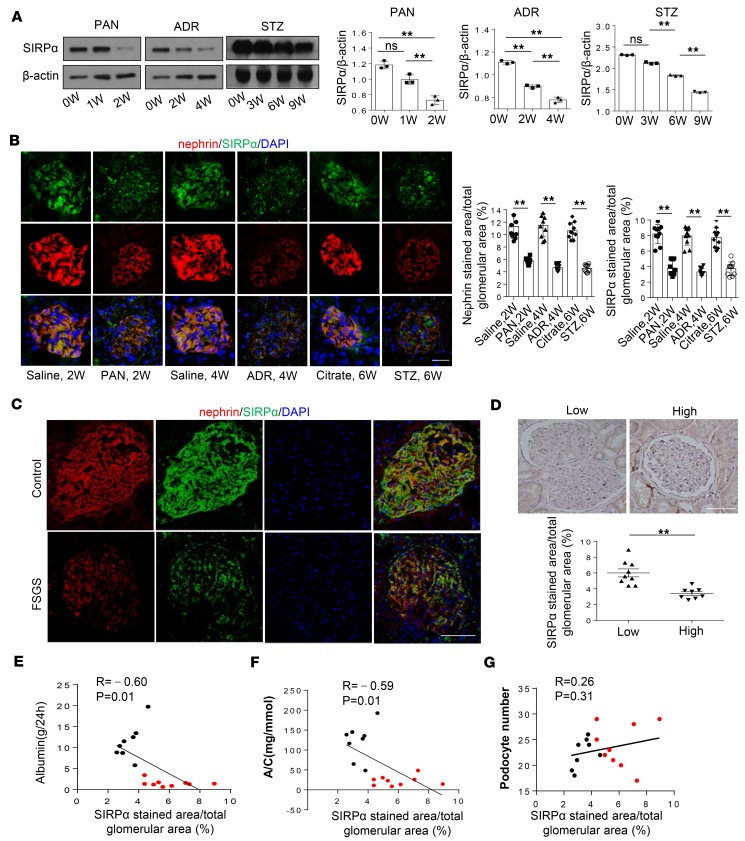
Given that podocytes specifically express SIRPα, we examined the level of podocyte SIRPα when podocytes were injured. In this experiment, WT mice were treated with PAN (18), ADR (19), or STZ (20) as previously described. PAN, ADR, and STZ-treated mice progressively developed decreased glomerular function as demonstrated by proteinuria (Supplemental Figure 3, A–C). SIRPα levels in murine glomeruli were time-dependently decreased following PAN, ADR, or STZ treatment (Figure 4A). Immunofluorescence staining of SIRPα and nephrin in murine kidney tissue sections (Figure 4B) confirmed the reduction of SIRPα in murine podocytes after treatment with PAN, ADR, or STZ for 2, 4, or 6 weeks, respectively. We obtained similar results in differentiated HPCs. When HPCs were treated with PAN and high glucose (HG; RPMI-1640 with glucose added) for various durations, SIRPα levels decreased in a time-dependent manner (Supplemental Figure 3, D and E).
Figure 4. Decrease of SIRPα in podocytes of mice and humans under nephropathy.
(A) SIRPα level in glomerulus of mice with PAN, ADR, and STZ treatment over time. Immunoblots are representative of 3 independently performed experiments. Histograms show quantification of SIRPα level. (B) Immunofluorescence staining of SIRPα and nephrin in glomerulus of mice treated with PAN, ADR, and STZ for 2, 4, and 6 weeks (W) respectively. Quantification of SIRPα and nephrin levels in glomerulus was performed by counting approximately 10 glomeruli from 3 independent determinations. Data in A and B represent mean ± SEM from 3 independent experiments, and P value was analyzed by ANOVA with Tukey-Kramer test and 2-tailed Student’s t test, respectively. (C) Colocalization and expression level of SIRPα and nephrin in podocytes of healthy control and FSGS patients. (D) Glomerular immunohistochemistry staining of SIRPα in FSGS patients with low proteinuria (n = 9) and with high proteinuria (n = 8). Histogram represents quantification of glomerular SIRPα staining in the 2 groups of patients. Data represent mean ± SEM, and P value was analyzed by 2-tailed Student’s t test. (E, F, and G) Correlation analysis between SIRPα and albumin level, albumin/creatinine ratio (A/C), and podocyte number; r and P values were analyzed by Pearson’s correlation analysis; red and black plots represent FSGS patients with low and high proteinuria, respectively. In Scale bars in B, C, and D: 25 μm.**P < 0.01.
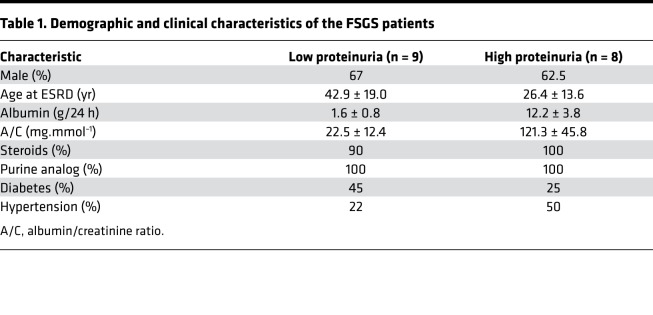
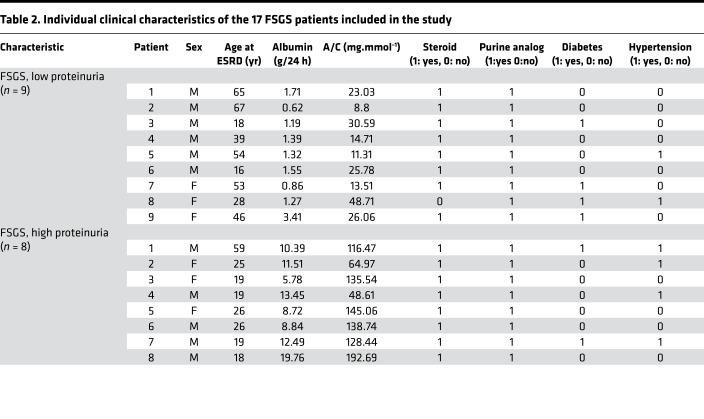
A decrease in podocyte SIRPα was also detected in patients with ongoing focal segmental glomerulosclerosis (FSGS). In this experiment, frozen sections of biopsy samples were obtained from healthy individuals (n = 2) and 17 FSGS patients (Tables 1 and 2). As shown in Figure 4C, glomerular immunostaining of SIRPα (green) and nephrin (red) revealed that SIRPα was colocalized with nephrin and heavily expressed in human podocytes, and that the level of podocyte SIRPα was substantially reduced in FSGS patients compared with healthy controls. We further analyzed the correlation between podocyte SIRPα level and severity of proteinuria. Seventeen FSGS patients were further separated into 2 groups according to their proteinuria content within 24 hours: “low” group, proteinuria <3 g/d (n = 9); and “high” group, proteinuria >3 g/d (n = 8). Immunohistochemical staining of glomerular SIRPα in renal tissue sections from FSGS patients showed that SIRPα levels in the low-proteinuria group were significantly higher than in the high-proteinuria group (Figure 4D). Quantification of SIRPα levels in FSGS patients’ glomeruli further indicated that glomerular SIRPα levels were negatively correlated with the proteinuria level (Figure 4E) and albumin/creatinine ratio (Figure 4F). In addition, correlation analysis showed no significant correlation between the SIRPα level and podocyte number, especially for patients with a lower level of proteinuria (Figure 4G), suggesting that loss of podocytes is not the main reason for reduction of glomerular SIRPα. Thus, at the early stage of kidney dysfunction, such as FSGS, reduction of glomerular SIRPα may be mainly due to the decrease in SIRPα expression in individual podocytes.
Table 1. Demographic and clinical characteristics of the FSGS patients.
Table 2. Individual clinical characteristics of the 17 FSGS patients included in the study.
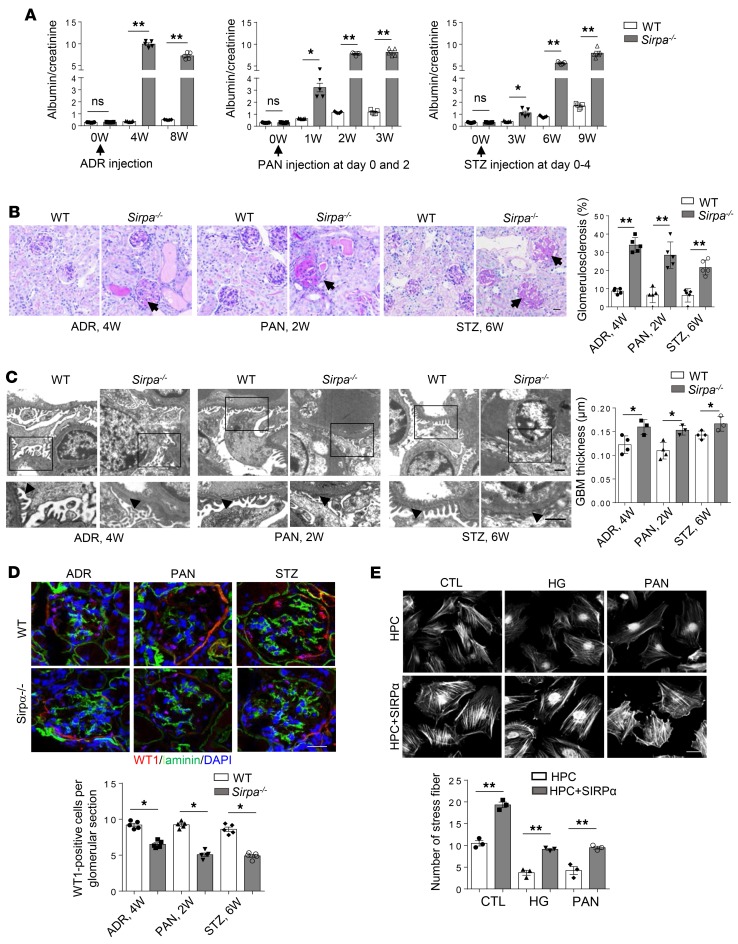
SIRPα-deficient mice develop more rapid and severe renal injury in various models of nephropathy. To investigate the role of SIRPα in podocytes, we examined the development of experimental nephropathy in 8-week-old Sirpa–/– mice and their WT littermates. As shown by the Western blotting and immunofluorescence results in Supplemental Figure 4, A and B, SIRPα was effectively knocked out in Sirpa–/– mouse glomeruli. To establish a murine experimental nephropathy model, Sirpa–/– and WT mice were given PAN, ADR, and STZ for 2, 4, and 6 weeks, respectively. As shown in Figure 5, A–D, SIRPα deficiency led to a higher level of proteinuria (Figure 5A), development of more glomerulosclerosis (arrows), and proteinaceous casts with tubular dilatation (Figure 5B), foot process fusion and GBM thickness (Figure 5C, arrowheads), and loss of podocytes (Figure 5D), indicating that SIRPα deficiency promotes the development of murine glomerular diseases. As actin cytoskeletal complex rearrangement plays a critical role in foot process fusion (21), we also stained cultured human podocytes from HPCs transfected with an SIRPα-overexpressing plasmid with phalloidin after treatment with or without HG and PAN. As shown in Figure 5E, even after treated with HG or PAN, the SIRPα-overexpressing podocytes largely maintained their central stress fiber formation. These results collectively suggest that SIRPα plays an important role in protecting the integrity of podocytes against glomerular disease progression.
Figure 5. Sirpa–/– mice develop more rapid and severe renal injury in various models of nephropathy.
(A) Albumin/creatinine ratio (mg/mg) in WT and Sirpa–/– mice with ADR, PAN, and STZ treatment (n = 5 WT and n = 5 Sirpa–/– mice). (B) ADR, PAN, and STZ injection in Sirpa–/– mice resulted in glomerulosclerosis by PAS staining (arrows); scale bar: 50 μm. Histogram represents quantification of glomerulosclerosis (5 WT and Sirpa–/– mice of each group; 10–20 glomeruli of each mouse were analyzed). (C) ADR, PAN, and STZ injection in Sirpa–/– mice results in more severe foot process fusion by electron microscopy (arrows indicate fused foot processes); scale bars: 1 μm. Histogram represents quantification of GBM thickness (glomeruli from 4 WT and 3 Sirpa–/– mice were analyzed). (D) ADR, PAN, and STZ injection in Sirpa–/– mice results in severe loss of podocytes (n = 5 WT and n = 5 Sirpa–/– mice; 5–6 glomeruli for each mouse were analyzed). Scale bar: 25 μm. (E) Fluorescence staining of F-actin using phalloidin in human podocytes (HPC) transfected with SIRPα-expressing plasmid. Scale bar: 25 μm. Quantification of fiber formation was performed by counting approximately 60 podocytes from 3 independent determinations. Data in A–E represent mean ± SEM, and P value was analyzed by 2-tailed Student’s t test. *P < 0.05, **P < 0.01.
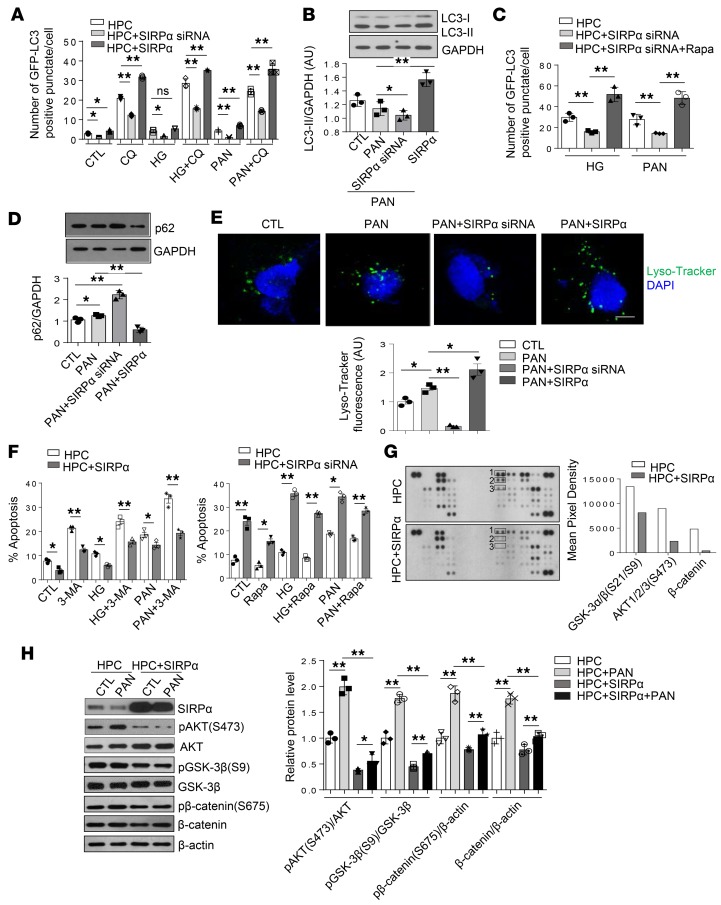
SIRPαprotects podocytes under stress through promotion of autophagic activity in vitro. Recent studies have shown that podocytes have a high basal level of autophagic activity and autophagy plays a crucial protective role for podocytes during the progression of glomerular aging and diseases (6, 22, 23). Failure to clear the damaged cellular structures by autophagy might result in the progressive accumulation of cytosolic protein aggregates, defective mitochondria, and lipofuscin accumulation in podocytes (6). Thus, the significant accumulation of lipofuscin and formation of microvilli observed in Sirpa–/– mice at 6 months age, and extensive distension of rough ER and damaged mitochondria observed in Sirpa–/– mice at 20 months age, may be attributable to a loss of autophagy in podocytes of Sirpa–/– mice. Therefore, we tested whether the protective function of SIRPα in murine podocytes is mediated through its potential regulation of podocyte autophagic activity. To determine the role of autophagic activity with respect to podocyte injury, we first treated the differentiated human podocytes with PAN or HG, 2 methods widely used in establishing podocyte injury (24–26), and then evaluated autophagic activity by analyzing LC3-II/GAPDH ratios. Western blot analysis showed that the LC3-II/GAPDH ratio (Supplemental Figure 5, A and B) in WT podocytes increased after PAN or HG treatment. Autophagic flux was also induced by PAN or HG treatment (Supplemental Figure 5C). We also examined the effect of SIRPα on the expression of the podocyte-specific protein podocin. As shown in Supplemental Figure 6, the level of podocin was decreased after SIRPα knockdown but increased after SIRPα overexpression. We then manipulated the level of expression of SIRPα in HPCs under the treatment with PAN or HG, which stably expressed the fluorescent microtubule-associated protein 1 light chain 3 (GFP-LC3), with SIRPα siRNA or SIRPα-overexpressing lentivirus and then monitored HPC autophagic activity. To block lysosomal degradation, HPCs were also treated with chloroquine (CQ). We found that autophagic flux was decreased in GFP-LC3–transgenic HPCs transfected with SIRPα siRNA lentivirus, while it was increased in HPCs transfected with SIRPα-expressing lentivirus (Figure 6A and Supplemental Figure 7A). Western blot results also showed that in the presence of CQ, knockdown of SIRPα via SIRPα siRNA decreased while SIRPα overexpression via SIRPα-expressing lentivirus increased the accumulation of LC3-II in HPCs treated with PAN (Figure 6B), suggesting that SIRPα regulates the conversion of LC3-I to LC3-II under stress conditions. Moreover, rapamycin administration restored the autophagic flux in HPCs with SIRPα knockdown (Figure 6C and Supplemental Figure 7B), suggesting that mTOR signaling pathways are involved in SIRPα-regulated autophagy.
Figure 6. SIRPα critically controls podocyte stress adaptation through promotion of autophagy in vitro.
(A) Level of autophagosomes in GFP-LC3–transgenic HPCs, transfected with SIRPα siRNA or SIRPα-overexpressing lentivirus. The cells were treated with or without HG, PAN for 48 hours. Autophagosomal degradation was inhibited with CQ for 3 hours. Numbers of punctate signals in GFP-LC3–transgenic HPCs were determined by counting approximately 60 cells from 3 independent experiments. (B) Comparison of LC3-II accumulation in PAN-induced HPCs transfected with or without SIRPα siRNA or SIRPα-overexpressing lentivirus in the presence of CQ. Immunoblots are representative of 3 independently performed experiments. Histograms are quantification of LC3-II level, and GAPDH was used as internal control. (C) Autophagic flux of HPCs transfected with or without SIRPα siRNA treated with HG, PAN, and/or Rapa for 48 hours in the presence of CQ was detected. (D) Comparison of p62 accumulation in PAN-induced HPCs transfected with SIRPα siRNA or SIRPα-overexpressing lentivirus in the absence of CQ. Immunoblots are representative of 3 independently performed experiments. Histograms show quantification of p62 level, and GAPDH was used as internal control. (E) Impaired or improved acidification of lysosomes was found by staining with LysoTracker Green in podocytes transfected with SIRPα siRNA or SIRPα-overexpressing lentivirus, respectively. (F) The level of phosphatidylserine-positive cells in HPCs transfected with or without SIRPα siRNA or SIRPα-overexpressing lentivirus treated with HG, PAN, 3-MA, and/or Rapa for 48 hours. Quantification of phosphatidylserine-positive cells was determined from 3 independent experiments. (G) Detection of kinase phosphorylation in HPCs and HPCs transfected with SIRPα-expressing plasmid using human phosphokinase arrays. Rectangles 1–3 highlight p–GSK-3α/β (S21/S9), p–Akt1/2/3 (S473), and β-catenin, respectively. The levels of p-GSK-3α/β (S21/S9), p–Akt1/2/3 (S473), and β-catenin were quantified using ImageJ software and are shown in the histograms. (H) The effect of SIRPα overexpression on autophagy through targeting p-Akt, Akt, p–GSK-3β, GSK-3β, and β-catenin. Immunoblots are representative of 3 independently performed experiments. Histograms are quantification of protein level from 3 independent experiments. Scale bar in E: 10 μm. Data in A–F and H represent mean ± SEM, and P value was analyzed by ANOVA with Tukey-Kramer test. *P < 0.05, **P < 0.01.
As p62/SQSTM1, a scaffold protein that is marked for destruction following ubiquitinylation, plays a critical role in regulating autophagy (27), we assessed the level of p62 and found that transfection with SIRPα siRNA lentivirus increased while transfection with SIRPα-expressing lentivirus decreased the accumulation of p62 (Figure 6D). This result suggests that SIRPα may modulate p62 degradation under stressed conditions. Furthermore, the lysosomal activity in HPCs treated with PAN was also measured. As shown by LysoTracker Green staining in Figure 6E, transfection with SIRPα siRNA lentivirus impaired while transfection with SIRPα-expressing lentivirus transfection improved acidification of lysosomes in HPCs. These results collectively suggest that the accumulation of p62 in HPCs under stressed conditions may be due to impaired lysosomal activity induced by SIRPα siRNA.
When we employed FITC–annexin V to label phosphatidylserine-positive HPCs, we found that the inhibition of autophagy by SIRPα siRNA led to a robust enhancement of PAN- or HG-induced podocyte apoptosis, while strengthening autophagy by SIRPα overexpression led to significant attenuation of PAN- or HG-induced podocyte apoptosis (Figure 6F and Supplemental Figure 8). In addition, inhibition of autophagy by 3-MA largely abolished the protective effect of SIRPα on PAN- or HG-induced podocyte apoptosis, while enhancement of autophagy by rapamycin restored the protective effect of SIRPα on PAN- or HG-induced apoptosis in SIRPα-knockdown podocytes (Figure 6F and Supplemental Figure 8). These results demonstrate that SIRPα plays a critical protective role in PAN- and HG-induced podocyte injury and that the autophagic activity induced by SIRPα may serve as the underlying mechanism.
To identify the downstream pathway of the functional effect of SIRPα in podocyte, we overexpressed SIRPα in HPCs and analyzed phospho-kinase activation. Whole-cell extracts from HPCs transfected with control lentivirus or SIRPα-overexpressing lentivirus were incubated with a human phospho-kinase array to compare the effects of SIRPα on the phosphorylation of kinases (Figure 6G). Several kinases, including p–GSK-3α/β (S21/S9), p-Akt1/2/3 (S473), and β-catenin, were downregulated by SIRPα. Furthermore, HPCs transfected with control or SIRPα-overexpressing lentivirus were treated with PAN, and expression of p–GSK-3α/β, GSK-3α/β, p-Akt, Akt, p–β-catenin, and β-catenin was analyzed by Western blotting. As shown in Figure 6H, SIRPα significantly downregulated the phosphorylation of GSK-3α/β, Akt, and β-catenin.
SIRPαfacilitates podocyte adaptation to stress conditions by promoting autophagy in vivo. To analyze the protective role of SIRPα as mediated through autophagy in vivo, we crossed transgenic mice expressing GFP-LC3 with Sirpa–/– mice (Sirpa–/–GFP-LC3) to monitor autophagy activity of podocytes under SIRPα-depleted conditions. Under basal conditions, 22-month-old GFP-LC3 mice displayed significantly higher levels of autophagosomes within their glomeruli than Sirpa–/–GFP-LC3 mice of the same age (Figure 7A). Accumulation of p62 was also monitored. As shown by immunofluorescence and Western blotting results (Figure 7, B and C), p62 deposited in larger aggregates in Sirpa–/–GFP-LC3 mice compared with GFP-LC3 mice. Furthermore, we also observed 8-week-old Sirpa–/–GFP-LC3 and GFP-LC3 control mice in which we had induced glomerular disease to clarify the effect of SIRPα on autophagic activity under glomerular stress conditions. Injection of PAN, ADR, or STZ resulted in a substantial decrease in autophagic activity (Figure 7D) and an increase in p62 accumulation within glomeruli of Sirpa–/–GFP-LC3 mice compared with control littermates (Figure 7, E and F).
Figure 7. SIRPα critically controls podocyte stress adaptation through promotion of autophagy in vivo.
(A) GFP-LC3–positive autophagosomes in GFP-LC3–transgenic mice (GFP-LC3) and Sirpa–/– mice crossed with GFP-LC3-transgenic mice (Sirpa–/–GFP-LC3, with proteinuria, 20 months). Arrows indicate autophagosomes. The histogram represents statistical autophagosomes in each group. n = 5 each group of mice and 6–10 glomeruli from each mouse were analyzed. (B) Accumulation of the ubiquitin-associated protein p62 in 20-month-old GFP-LC3 and Sirpa–/–GFP-LC3 mice (arrows indicate podocytes). (C) Western blot analysis of p62 in glomerulus of 20-month-old GFP-LC3 and Sirpa–/–GFP-LC3 mice. Immunoblots are representative of 3 independently performed experiments. The histogram represents statistical results from 3 independently performed experiments. (D) GFP-LC3–positive autophagosomes in 8-week-old GFP-LC3–transgenic mice and Sirpa–/–GFP-LC3 mice treated with PAN, ADR, or STZ; arrows indicate autophagosomes. The histograms represent statistical autophagosomes in each group. n = 3 each group of mice and 10 glomeruli from each mouse were analyzed. (E) Accumulation of p62 in 8-week-old GFP-LC3 and Sirpa–/–GFP-LC3 mice treated with PAN for 2 weeks (2W), ADR for 4 weeks, and STZ for 6 weeks (arrows indicate podocytes). (F) Western blotting of p62 in glomerulus of 8-week-old GFP-LC3 and Sirpa–/–GFP-LC3 mice with different treatments. Immunoblots are representative of 3 independently performed experiments. The histogram represents statistical results from 3 independently performed experiments. Scale bars in A, B, D, and E: 10 μm. Data in A, C, D, and F represent mean ± SEM, and P values were analyzed by 2-tailed Student’s t test. *P < 0.05, **P < 0.01.
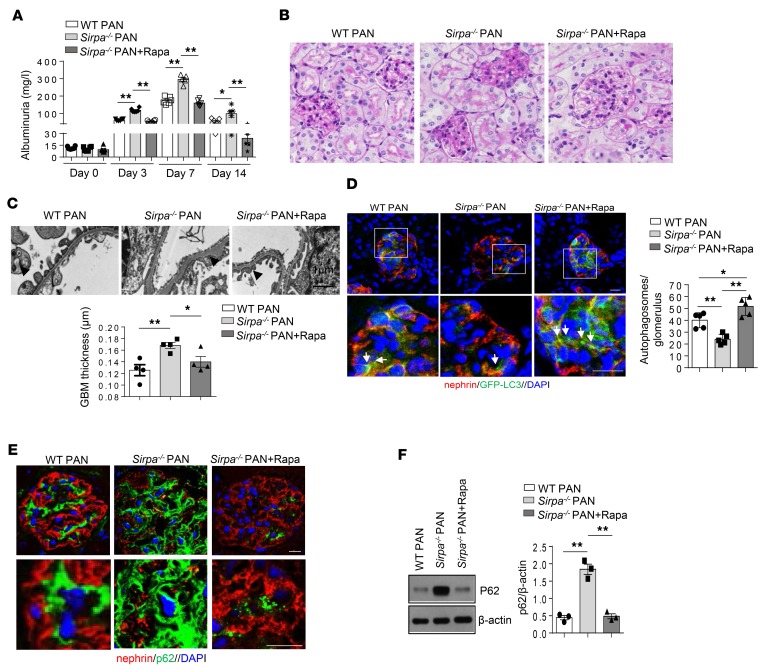
To demonstrate that autophagy is involved in the protection of podocytes under stress in vivo, we also treated 8-week-old SIRPα-deficient mice with PAN and rapamycin. As shown in Figure 8, rapamycin treatment significantly ameliorated PAN-induced proteinuria (Figure 8A), pathological damage of the glomerulus (Figure 8B), and foot process fusion of podocytes and GBM thickness (Figure 8C) in Sirpa–/– mice. Furthermore, rapamycin induced GFP-LC3–positive autophagosomes (Figure 8D) and decreased accumulation of p62 (Figure 8, E and F) in Sirpa–/– mice. These results further suggest that autophagy is involved in the protection of podocytes under stress conditions, and mTOR signaling pathways play an important role in SIRPα-regulated autophagy in vivo.
Figure 8. Promoting autophagy ameliorates PAN-induced proteinuria and renal pathological damage in Sirpa–/– mice.
(A) Proteinuria (mg/l) content within 24 hours of PAN-induced WT and Sirpa–/– mice administrated with or without Rapa (6 mice/group). (B and C) Rapa treatment results in less pathological damage of glomerulus (B) and foot process fusion of podocytes (C) in Sirpa–/– mice. Foot process fusion and effacement are indicated by open and filled arrowheads, respectively. Histogram represents quantification of GBM thickness (glomeruli from 4 mice of each group were analyzed). (D) Rapa induced GFP-LC3–positive autophagosomes in Sirpa–/– mice. The histogram represents levels of autophagosomes in each group. Each group had 5 mice, and at least 8 glomeruli from each mouse were analyzed. (E) Rapamycin inhibited the accumulation of p62 in Sirpa–/– mice. (F) Western blot analysis of glomerulus p62. The histogram represents statistical results from 3 independently performed experiments. Data in A, C, D, and F represent mean ± SEM, and P value was analyzed by ANOVA with Tukey-Kramer test. Scale bars in B, D, and E: 10 μm. Scale bar in C: 1 μm. *P < 0.05, **P < 0.01.
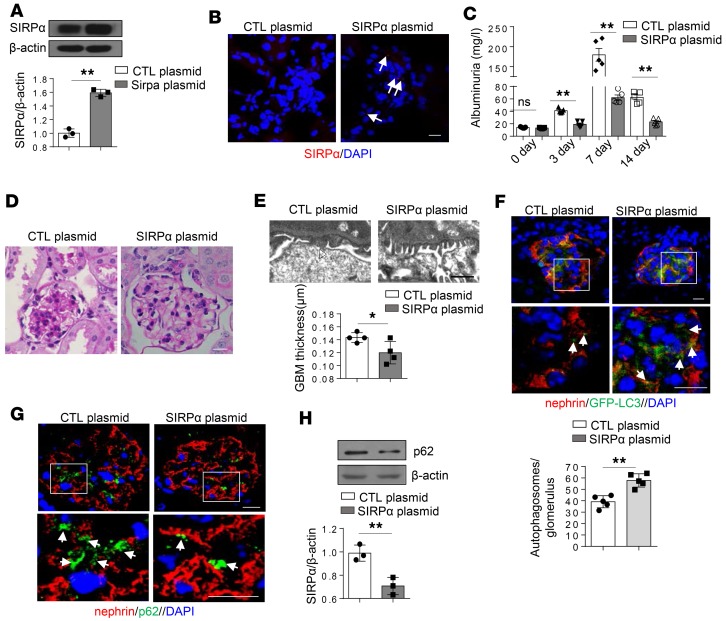
Overexpression of SIRPαreverses murine PAN-induced proteinuria and renal damage through activation of autophagy. We studied the effect of SIRPα on the progression of renal abnormalities and glomerular pathology in PAN-treated mice by injection of SIRPα-expressing plasmids into the tail vein of mice every 3 days after the onset of glomerular diseases. By employing the hydrodynamic delivery strategy previously used to deliver plasmid into podocytes (28), we successfully delivered SIRPα-expressing plasmids into glomeruli. As shown by Western blotting (Figure 9A) and immunofluorescence labeling (Figure 9B), SIRPα-expressing plasmids significantly increased the protein level of SIRPα in glomeruli. Following PAN treatment, PAN-induced murine proteinuria (Figure 9C), pathological damage of glomerulus (Figure 9D), and foot process fusion and GBM thickness (Figure 9E) were significantly improved in mice given SIRPα-expressing plasmids compared with control mice. Consistent with this, murine podocyte autophagic activity was remarkably enhanced by SIRPα overexpression (Figure 9F), while p62 accumulation was significantly reduced by SIRPα overexpression (Figure 9, G and H). These data confirm that increased SIRPα in podocytes can reverse renal abnormalities and glomerular pathology induced by PAN.
Figure 9. Overexpression of SIRPα reverses PAN-induced proteinuria and renal pathological damage through promotion of autophagy.
(A) Western blot analysis of SIRPα in mice administered SIRPα-expressing plasmid (SIRPα plasmid) or control plasmid (CTL plasmid) following PAN treatment. Immunoblots are representative of 3 independently performed experiments. The histogram represents statistical results from 3 independently performed experiments. (B) Detection of RFP-SIRPα in glomerulus. (C) Proteinuria (mg/l) content, within 24 hours, of mice treated with PAN. n = 5 mice of each group. (D) PAS staining of kidney tissue sections in mice treated with PAN. (E) SIRPα-overexpressing mice show less foot process fusion by electron microscopy (open arrowhead indicate fused foot processes); scale bar: 1 μm. Histogram represents quantification of GBM thickness (n = 4). (F) GFP-LC3–positive autophagosomes in mice treated with PAN. The histograms represent relative levels of autophagosomes in each group. Each group had 5 mice, and at least 8 glomeruli were analyzed in each mouse. (G) Accumulation of p62 in mice treated with PAN. (H)Western blot analysis of glomerulus p62 in mice treated with PAN. The histogram represents statistical results from 3 independently performed experiments. Data in A, C, E, F, and H represent mean ± SEM, and P value was analyzed by 2-tailed Student’s t test. Scale bars in B, D, F,and G: 10 μm. *P < 0.05, **P < 0.01.
Discussion
Autophagy plays a critical role in podocyte survival. It has been well documented that healthy podocytes maintain high autophagic activity, and that high autophagic activity leads to enhanced survival (29–31). However, the molecular mechanism that governs podocyte autophagy had been incompletely understood. In the present study, we demonstrate that podocyte autophagy is controlled by SIRPα, while SIRPα deletion leads to impairment of podocyte autophagy and development of podocyte dysfunction.
The protective role of podocyte SIRPα is supported by several pieces of evidence. First, SIRPα deficiency results in noticeable age-related murine proteinuria and podocyte injury, and compared with WT littermates, Sirpa–/– mice develop more rapid and severe proteinuria and glomerular tissue damage in various experimental nephropathy models. Second, reduction of podocyte SIRPα is found in both mice with various nephropathy conditions and patients with FSGS. Third, manipulation of the knockdown of SIRPα by siRNA or overexpression of SIRPα via SIRPα lentivirus in differentiated podocyte cells enhances or reduces podocyte apoptosis, respectively. Finally, maintaining a high level of SIRPα in murine podocytes via delivery of SIRPα-expressing plasmid can reverse podocyte injury induced by PAN.
The mTOR pathway is a key regulatory cascade that controls cell proliferation and survival by increasing autophagy (30, 32, 33). It has been shown that mTOR is activated by multiple kinases such as Akt (34–36) and MAPK (37), but how the dynamic process of Akt phosphorylation is regulated remains elusive. Our mechanistic study shows that SIRPα controls the phosphorylation of Akt as well as the GSK-3β/β-catenin signaling pathway. In agreement with this, a previous study reported that knockdown of SIRPα prolongs activation of PI3K/Akt pathways in macrophages, leading to the increased capacity of macrophages to promote inflammation (38). In addition, Petherick et al. revealed that β-catenin signaling could suppress cellular autophagic activity (39). Given that β-catenin signaling is inhibited by the overexpression of SIRPα (Figure 6, G and H), SIRPα may promote podocyte autophagy through suppression of β-catenin signaling. The negative correlation between SIRPα level and β-catenin signaling has been previously reported by Maekawa et al., who showed that SIRPα knockdown by stable transfection of SIRPα siRNAs can induce β-catenin in leukemia cells (40). Taken together, our results suggest that SIRPα may promote podocyte autophagic activity through controlling Akt/mTOR and Wnt/β-catenin signals.
It is widely accepted that rearrangement of the podocyte cytoskeletal complex plays a critical role in foot process effacement (21, 41, 42). The finding that development of more-severe proteinuria in Sirpa–/– mice during aging or following various nephropathy challenges is tightly correlated with massive podocyte foot process effacement may suggest a functional link between podocyte cytoskeleton alterations and SIRPα-modulated autophagy. Through gain-of-function and loss-of-function assays in differentiated podocyte cells, we validated the critical role of SIRPα in maintaining the cytoskeleton structure of podocytes, suggesting that SIRPα may be essential for preserving the integrity of podocytes. Supporting this notion is the recent finding that SIRPα interacts with nephrin, an important component of architecture (43, 44), at the podocyte slit diaphragm (45).
Given that SIRPα reduction in podocytes was observed in patients with FSGS and mice treated with various nephropathy-inducing challenges, a rapid decrease in podocyte SIRPα level may be a common phenomenon in glomerular diseases. However, the mechanism by which podocyte SIRPα is downregulated remains unknown. Since SIRPα mRNA is detected in various cells and tissues but SIRPα protein expression is highly restricted to certain cell types — mainly myeloid-derived leukocytes, neural cells, and podocytes — it is likely that SIRPα expression is modulated at the posttranscriptional level. Our previous study showed that SIRPα is a common target of miR-17, miR-20a, and miR-106a in macrophages, and the levels of these 3 miRNAs are strongly increased under inflammatory conditions (46). A hypothesis for future testing is that SIRPα reduction in podocytes is achieved via enhanced expression of miR-17, miR-20a, and miR-106a during the development of glomerular diseases. In addition to directly affecting podocytes, SIRPα may have different functional effects in various organs, since the experiments in the present study were not performed in podocyte-specific SIRPα-knockout mice. It will be necessary to generate podocyte-specific SIRPα-deficient mice to define the protective effect of SIRPα on podocytes. In conclusion, the present study demonstrates a critical role of SIRPα in facilitating podocyte survival via promotion of autophagic activity and suggests that SIRPα may serve as a novel therapeutic target for glomerular disease treatment.
Methods
Patients.
Patients with FSGS (n = 17) were enrolled in this study. All FSGS patients were diagnosed based on renal biopsies at the National Clinical Research Center of Kidney Diseases, Jinling Hospital, Nanjing University School of Medicine. Patient exclusion criteria included obesity, diabetes mellitus, HBV infection, hepatitis or malignant tumors, and participation in continuous renal replacement therapy. They were further grouped according to the proteinuria content within 24 hours (low group: occurrence of proteinuria <3 g/d; high group: occurrence of proteinuria >3 g/d). Table 1 lists the demographics/clinical characteristics of FSGS patients. Table 2 provides other relevant details of individual patients.
Mice.
Male C57BL/6J (8 weeks, 22–25 g) and GFP-LC3–transgenic mice were obtained from the Model Animal Research Center of Nanjing University. Sirpa–/– mice were described previously (47). All mice were backcrossed to a C57BL/6 background. To monitor the autophagy of Sirpa–/– mice, Sirpa–/– mice were crossed with GFP-LC3–transgenic mice.
Cell culture and treatment.
Human and mouse podocyte cell lines were gifts from M. Saleem (Children’s Renal Unit, Bristol Royal Hospital for Children, University of Bristol, Bristol, United Kingdom) and Stuart J. Shankland (University of Washington, Seattle, Washington, USA) and were cultured as previously described (48, 49). Cells were seeded onto type I collagen–coated culture plates and cultured in RPMI-1640 medium enriched with 10% FBS, 100 U/ml penicillin, and 100 μg/ml streptomycin (Gibco). The cells were cultured at 33°C and 5% CO2 for proliferation, and were then shifted to 37°C and 5% CO2 for differentiation lasting 10–12 days. For the human podocyte cell line, ITS (Sigma-Aldrich) was added to standard cell culture. For the mouse podocyte cell line, IFN-γ (R&D Systems) was added to standard culture at 33°C. The cells were incubated with RPMI-1640 with normal or 30 mM HG (Sigma-Aldrich) and 50 μg/ml PAN (Sigma-Aldrich) for the various times specified herein. For construction of SIRPα-, SIRPα siRNA–, and GFP-LC3–transgenic podocytes, SIRPα-overexpressing, SIRPα siRNA–expressing, and GFP-LC3–overexpressing lentiviruses were generated (GenePharma), and podocytes were infected. For lysosome-autophagosome fusion inhibition and blocking autophagosome formation, human podocytes were incubated with 50 μM CQ (Sigma-Aldrich) and 5 mM 3-MA (Sigma-Aldrich), respectively. Rapamycin (200 nM, Sigma-Aldrich) was used as to induce autophagy. For determination of acidification of lysosomes, podocytes were incubated with 500 nM LysoTracker Green DND-26 (Invitrogen, L7526) for 1 hour at 37°C. The human mesangial cell line was purchased from ATCC and cultured in RPMI-1640 medium containing 10% FBS (Gibco) at 37°C in a humidified atmosphere of 5% CO2.
Apoptosis assay.
Cell apoptosis was determined using an FITC-Annexin V Apoptosis Detection Kit (BioLegend). Briefly, 2 × 10⁵ cells were resuspended in 0.5 ml binding buffer and incubated with FITC–annexin V for 15 minutes in the dark. A FACSCalibur flow cytometer (BD Biosciences) was used to analyze cellular apoptosis.
Proteinuria induced by PAN, ADR, or STZ.
For PAN-induced proteinuria, mice received 2 intravenous injections of PAN (180 mg/kg body weight, Sigma-Aldrich) on day 0 and day 2. Urinary albumin/creatinine ratios were analyzed before and 7, 14, and 21 days after the injection. Kidneys were harvested and processed for autophagy analysis, WT1 detection, PAS staining and electron microscopy after the 14-day follow-up. For ADR-induced proteinuria, mice received 1 intravenous injection of ADR (Sigma-Aldrich) in saline (15 mg/kg body weight). Urinary albumin/creatinine ratios were analyzed before injection and 2, 4, 8 weeks after injection. Kidneys were harvested and processed for autophagy analysis, WT1 detection, PAS staining and electron microscopy after the 4-week follow-up. For STZ-induced proteinuria, mice received one intraperitoneal injection of STZ (50 mg/kg bodyweight, Sigma-Aldrich) in 100 mM citrate/sodium citrate each day for 5 days. Urinary albumin-creatinine ratios were analyzed before and 3, 6, 9 weeks after injection. In addition, blood glucose levels were measured at every point in time. Kidneys were harvested and processed for autophagy analysis, WT1 detection, PAS staining and electron microscopy after the 6-week follow-up.
SIRPαoverexpression to rescue PAN-induced proteinuria. For expression of SIRPα in mouse kidney, RFP-SIRPα–expressing plasmid was delivered into the kidney using the TransIT-EE Hydrodynamic Delivery Solution according to the manufacturer’s instructions (MIR5340, Mirus Bio), as described previously (29, 50, 51). Briefly, mice were injected with 200 μg DNA per mouse every 3 days after PAN treatment. On the basis of body weight (20–25 g) of each mouse, injection volume was determined. Two weeks after gene delivery, mice were killed. Mouse urine samples were collected, and kidneys were removed for further study.
Phosphokinase array.
A human Phospho-Kinase Array Kit (R&D Systems) was used to measure the relative level of phosphorylation of 46 distinct intracellular kinases according to the manufacturer’s instructions. The relative levels of phosphorylation of 46 kinases were measured using Proteome Profiler Human Phospho-kinase Array (R&D Systems) according to the manufacturer’s instructions. For imaging, the blots were incubated with ECL. Phospho-kinase array results were quantified by using ImageJ software (NIH).
Western blot analyses.
Western blot analyses were performed as previously described (52). Briefly, protein extracts from cells or tissues were resolved by SDS-PAGE before being transferred onto the appropriate membrane and incubated with antibodies. Primary antibodies for SIRPα (Abcam, ab8120), p62 (BD Biosciences, 610832), β-actin (Santa Cruz Biotechnology, sc-47778), p–β-catenin (Cell Signaling Technology, 4176T), β-catenin (Cell Signaling Technology, 8480s), p-Akt (Cell Signaling Technology, 4060s), Akt (Cell Signaling Technology, 4685s), p–GSK-3β (Cell Signaling Technology, 5558s), GSK-3β (Cell Signaling Technology, 12456s), and LC3B (Novus, NB100-2220), and secondary antibodies goat anti-mouse IgG–HRP (Santa Cruz Biotechnology, sc-2005) and goat anti-rabbit IgG–HRP (Santa Cruz Biotechnology, sc-2004) were used for detection. Band intensities were quantified using ImageJ software, and the results were normalized to β-actin and expressed relative to controls.
Immunofluorescence and immunohistochemistry.
Kidneys were frozen in O.C.T. compound, snap-frozen in liquid nitrogen, and sectioned using a Leica CM1950 at 6-μm thickness. The sections were fixed with 4% paraformaldehyde, blocked in PBS containing 10% FBS, and then incubated with primary antibodies overnight at 4°C. Anti-SIRPα (Abcam, ab8120), nephrin (Fitzgerald, 20R-NP002), podocin (Sigma-Aldrich, P0372), WT1 (Santa Cruz Biotechnology, sc-192), p62 (BD Biosciences, 610832), and LC3 (Novus, NB100-2220) antibodies were used as primary antibodies. After several PBS rinses, fluorophore-conjugated secondary antibodies were applied for 60 minutes. Cy3-conjugated donkey anti–guinea pig (Jackson ImmunoResearch Laboratories Inc., 706-165-148), Alexa Fluor 488–goat anti-mouse (Invitrogen, A11001), Alexa Fluor594–donkey anti-rabbit (Invitrogen, A21207), Alexa Fluor 488–donkey anti-rabbit (Invitrogen, A21206), and Alexa Fluor 594–goat anti-mouse (Invitrogen, A11005) secondary antibodies were used. Then the sections were mounted in Prolong Diamond Antifade Mountant (Life Technologies, P36961) with DAPI (Santa Cruz Biotechnology, sc-3598). Actin filaments were labeled with Phalloidin-Atto655 (Sigma-Aldrich, 18846). Confocal images were taken using a 2-photon laser confocal microscope (Leica TCS SP8-MaiTai MP). The number of LC3-positive punctate signals in the cells was analyzed, and the average number of punctate signals in 10 randomly selected cells was presented. WT1-positive cells were counted in 10 glomeruli per mouse. Other fluorescence intensities were quantified using ImageJ software. Kidney tissues from patients were embedded in paraffin and sectioned at 3.5-μm thickness (Leica CM1950). Paraffin sections were dewaxed, rehydrated, and blocked in 3% H2O2 in 70% methanol, followed by incubation for 20 minutes at 65°C in AP assay buffer (100 mM Tris, pH 9.5 containing 100 mM NaCl and 5 mM MgCl2). Sections were washed with PBS 3 times. Rabbit anti–human SIRPα antibody was applied for 1 hour at 37°C. Afterward, secondary antibody was added and incubated for 45 minutes at 37°C. Sections were finally stained with DAB. Protein expression was quantified using ImageJ software.
TEM.
Kidney tissues were fixed in 4% paraformaldehyde, dehydrated in graded alcohols, and embedded in paraffin. Sections (2-μm) were cut and stained with periodic acid–Schiff (PAS) reagent. All slides were evaluated by the same pathologist, who was blinded to the identities of the specimens, using a Nikon E800 microscope. TEM was performed as previously described (19). In brief, renal tissues were collected and dissected into 1-mm3 pieces and fixed in 3.75% glutaraldehyde, followed by post-fixation in 2% osmium tetroxide, dehydrated in graded series of acetone and ethanol, and embedded in epoxy resin (SPI Inc.). Ultrathin sections (80–90 nm) were stained for 15 minutes in 5% uranyl acetate, followed by 0.1% lead citrate for 5 minutes. Electron micrographs were obtained and analyzed using a Hitachi 7500 transmission electron microscope.
Albumin/creatinine ratio detection.
Coomassie gels were used to semiquantitatively confirm proteinuria of Sirpa–/– and WT mice of different ages. Urinary albumin and creatinine were measured using mouse albumin ELISA (Bethyl Laboratories) and creatinine assay (Sigma-Aldrich) kits according to the manufacturers’ protocols. Urine albumin excretion was expressed as the ratio of albumin to creatinine (mg/mg).
Isolation of mouse glomeruli.
Glomeruli were isolated using Dynabead perfusion (53). Briefly, mice were first perfused with prewarmed bead solution, followed by enzymatic digestion buffer (300 U/ml collagenase type II, 1 mg/ml proteinase, and 50 U/ml DNase I in bead solution) (Sigma-Aldrich). Kidney tissues were minced into 1-mm3 pieces and digested in enzymatic digestion buffer at 37°C for 15 minutes on a rotator (100 rpm). Digested tissues then were passed through a 100-μm cell strainer and collected by centrifugation. The pellet was resuspended in HBSS, and glomeruli were washed and collected using a magnet.
Statistics.
All of the data are presented as mean ± SD. When only 2 groups were compared, Student’s t test was used. Comparisons involving multiple dependent measures were Tukey-Kramer corrected. The reported P value was 2-sided. P values less than 0.05 were considered significant.
Study approval.
All protocols concerning the use of patient samples in this study were approved by the Human Subjects Committee of Jinling Hospital, Nanjing University School of Medicine (2017NZKY-013-01). All participants provided written informed consent for participation. Animal protocols and procedures were approved by the Institutional Animal Care and Use Committee at Nanjing University.
Author contributions
KZ, LML, and ZHL designed the experiments. LML, YL, and SL participated in the experiments and data analysis. CHZ, RY, and WWR collected FSGS tissue samples. MCZ and XDZ provided technical assistance in the histopathological analysis. YL, HWL, and KK provided SIRPα–knockout mice and anti–human SIRPα antibodies. LML and KZ drafted the manuscript. All authors read and approved the final manuscript.
Supplementary Material
Acknowledgments
The authors thank Jill Leslie Littrell (Georgia State University) for critical reading and constructive discussion of the manuscript. This work was supported by grants from the National Natural Science Foundation of China (no. 31670917); Natural Science Foundation of Jiangsu Province (BK20170076); Six Talent Peaks project of Jiangsu Province (YY-012); Project of Invigorating Health Care through Science, Technology, and Education (ZDRCA2016098); and Fundamental Research Funds for the Central Universities (nos. 020814380095, 020814380082).
Version 1. 03/19/2019
In-Press Preview
Version 2. 05/02/2019
Electronic publication
Footnotes
Conflict of interest: The authors have declared that no conflict of interest exists.
Copyright: © 2019 American Society for Clinical Investigation
Reference information: JCI Insight. 2019;4(9):e124747. https://doi.org/10.1172/jci.insight.124747.
Contributor Information
Limin Li, Email: liminli@nju.edu.cn.
Ying Liu, Email: yingliu2011@163.com.
Shan Li, Email: lishan_nju@163.com.
Caihong Zeng, Email: zengch_nj@hotmail.com.
Weiwei Rong, Email: 15651895670@163.com.
Hongwei Liang, Email: lianghongwei0418@163.com.
Mingchao Zhang, Email: zmchj99@163.com.
Xiaodong Zhu, Email: zxd1015@126.com.
Koby Kidder, Email: kkidder@gsu.edu.
Yuan Liu, Email: yliu@gsu.edu.
Zhihong Liu, Email: liuzhihong@nju.edu.cn.
Ke Zen, Email: kzen@nju.edu.cn.
References
- 1.Kriz W, Shirato I, Nagata M, LeHir M, Lemley KV. The podocyte’s response to stress: the enigma of foot process effacement. Am J Physiol-Renal. 2013;304(4):F333–FF47. doi: 10.1152/ajprenal.00478.2012. [DOI] [PubMed] [Google Scholar]
- 2.Greka A, Mundel P. Cell biology and pathology of podocytes. Annu Rev Physiol. 2012;74:299–323. doi: 10.1146/annurev-physiol-020911-153238. [DOI] [PMC free article] [PubMed] [Google Scholar]
- 3.Pavenstädt H, Kriz W, Kretzler M. Cell biology of the glomerular podocyte. Physiol Rev. 2003;83(1):253–307. doi: 10.1152/physrev.00020.2002. [DOI] [PubMed] [Google Scholar]
- 4.Reiser J, Altintas MM. Podocytes. F1000Res. 2016;5(F1000 Faculty Rev):114 [Google Scholar]
- 5.Hartleben B, Wanner N, Huber TB. Autophagy in glomerular health and disease. Semin Nephrol. 2014;34(1):42–52. doi: 10.1016/j.semnephrol.2013.11.007. [DOI] [PubMed] [Google Scholar]
- 6.Hartleben B, et al. Autophagy influences glomerular disease susceptibility and maintains podocyte homeostasis in aging mice. J Clin Invest. 2010;120(4):1084–1096. doi: 10.1172/JCI39492. [DOI] [PMC free article] [PubMed] [Google Scholar]
- 7.Zeng C, et al. Podocyte autophagic activity plays a protective role in renal injury and delays the progression of podocytopathies. J Pathol. 2014;234(2):203–213. doi: 10.1002/path.4382. [DOI] [PubMed] [Google Scholar]
- 8.Barclay AN, van den Berg TK. The interaction between signal regulatory protein alpha (SIRP alpha) and CD47: structure, function, and therapeutic target. Annu Rev Immunol. 2014;32:25–50. doi: 10.1146/annurev-immunol-032713-120142. [DOI] [PubMed] [Google Scholar]
- 9.Fujioka Y, et al. A novel membrane glycoprotein, SHPS-1, that binds the SH2-domain-containing protein tyrosine phosphatase SHP-2 in response to mitogens and cell adhesion. Mol Cell Biol. 1996;16(12):6887–6899. doi: 10.1128/MCB.16.12.6887. [DOI] [PMC free article] [PubMed] [Google Scholar]
- 10.Kharitonenkov A, Chen Z, Sures I, Wang H, Schilling J, Ullrich A. A family of proteins that inhibit signalling through tyrosine kinase receptors. Nature. 1997;386(6621):181–186. doi: 10.1038/386181a0. [DOI] [PubMed] [Google Scholar]
- 11.Timms JF, et al. Identification of major binding proteins and substrates for the SH2-containing protein tyrosine phosphatase SHP-1 in macrophages. Mol Cell Biol. 1998;18(7):3838–3850. doi: 10.1128/MCB.18.7.3838. [DOI] [PMC free article] [PubMed] [Google Scholar]
- 12.Neznanov N, et al. Dominant negative form of signal-regulatory protein-alpha (SIRP alpha/SHPS-1) inhibits tumor necrosis factor-mediated apoptosis by activation of NF-kappa B. J Biol Chem. 2003;278(6):3809–3815. doi: 10.1074/jbc.M210698200. [DOI] [PubMed] [Google Scholar]
- 13.Yamaguchi R, et al. Surfactant protein D inhibits interleukin-12p40 production by macrophages through the SIRP alpha/ROCK/ERK signaling pathway. Am J Med Sci. 2017;353(6):559–567. doi: 10.1016/j.amjms.2017.03.013. [DOI] [PubMed] [Google Scholar]
- 14.Zhang Y, Morgan MJ, Chen K, Choksi S, Liu ZG. Induction of autophagy is essential for monocyte-macrophage differentiation. Blood. 2012;119(12):2895–2905. doi: 10.1182/blood-2011-08-372383. [DOI] [PMC free article] [PubMed] [Google Scholar]
- 15.Kurihara H, Harita Y, Ichimura K, Hattori S, Sakai T. SIRP-alpha-CD47 system functions as an intercellular signal in the renal glomerulus. Am J Physiol Renal Physiol. 2010;299(3):F517–F527. doi: 10.1152/ajprenal.00571.2009. [DOI] [PubMed] [Google Scholar]
- 16.El-Aouni C, et al. Podocyte-specific deletion of integrin-linked kinase results in severe glomerular basement membrane alterations and progressive glomerulosclerosis. J Am Soc Nephrol. 2006;17(5):1334–1344. doi: 10.1681/ASN.2005090921. [DOI] [PubMed] [Google Scholar]
- 17.Höhn A, Grune T. Lipofuscin: formation, effects and role of macroautophagy. Redox Biol. 2013;1:140–144. doi: 10.1016/j.redox.2013.01.006. [DOI] [PMC free article] [PubMed] [Google Scholar]
- 18.Shimo T, et al. A novel nuclear factor κB inhibitor, dehydroxymethylepoxyquinomicin, ameliorates puromycin aminonucleoside-induced nephrosis in mice. Am J Nephrol. 2013;37(4):302–309. doi: 10.1159/000348803. [DOI] [PubMed] [Google Scholar]
- 19.Li L, et al. Role of myeloid-derived suppressor cells in glucocorticoid-mediated amelioration of FSGS. J Am Soc Nephrol. 2015;26(9):2183–2197. doi: 10.1681/ASN.2014050468. [DOI] [PMC free article] [PubMed] [Google Scholar]
- 20.Vallon V, et al. Knockout of Na-glucose transporter SGLT2 attenuates hyperglycemia and glomerular hyperfiltration but not kidney growth or injury in diabetes mellitus. Am J Physiol-Renal. 2013;304(2):F156–FF67. doi: 10.1152/ajprenal.00409.2012. [DOI] [PMC free article] [PubMed] [Google Scholar]
- 21.Faul C, Asanuma K, Yanagida-Asanuma E, Kim K, Mundel P. Actin up: regulation of podocyte structure and function by components of the actin cytoskeleton. Trends Cell Biol. 2007;17(9):428–437. doi: 10.1016/j.tcb.2007.06.006. [DOI] [PubMed] [Google Scholar]
- 22.Kume S, et al. Calorie restriction enhances cell adaptation to hypoxia through Sirt1-dependent mitochondrial autophagy in mouse aged kidney. J Clin Invest. 2010;120(4):1043–1055. doi: 10.1172/JCI41376. [DOI] [PMC free article] [PubMed] [Google Scholar]
- 23.Cui J, et al. Age-related changes in the function of autophagy in rat kidneys. Age (Dordr) 2012;34(2):329–339. doi: 10.1007/s11357-011-9237-1. [DOI] [PMC free article] [PubMed] [Google Scholar]
- 24.Wu L, et al. Rapamycin upregulates autophagy by inhibiting the mTOR-ULK1 pathway, resulting in reduced podocyte injury. PLoS ONE. 2013;8(5):e63799. doi: 10.1371/journal.pone.0063799. [DOI] [PMC free article] [PubMed] [Google Scholar]
- 25.Srivastava T, et al. LPS and PAN-induced podocyte injury in an in vitro model of minimal change disease: changes in TLR profile. J Cell Commun Signal. 2013;7(1):49–60. doi: 10.1007/s12079-012-0184-0. [DOI] [PMC free article] [PubMed] [Google Scholar]
- 26.Ma T, Zhu J, Chen X, Zha D, Singhal PC, Ding G. High glucose induces autophagy in podocytes. Exp Cell Res. 2013;319(6):779–789. doi: 10.1016/j.yexcr.2013.01.018. [DOI] [PMC free article] [PubMed] [Google Scholar]
- 27.Klionsky DJ, et al. Guidelines for the use and interpretation of assays for monitoring autophagy (3rd edition) Autophagy. 2016;12(1):1–222. doi: 10.1080/15548627.2015.1100356. [DOI] [PMC free article] [PubMed] [Google Scholar]
- 28.Meng J, et al. MicroRNA-196a/b mitigate renal fibrosis by targeting TGF-β receptor 2. J Am Soc Nephrol. 2016;27(10):3006–3021. doi: 10.1681/ASN.2015040422. [DOI] [PMC free article] [PubMed] [Google Scholar]
- 29.Cybulsky AV. Endoplasmic reticulum stress, the unfolded protein response and autophagy in kidney diseases. Nat Rev Nephrol. 2017;13(11):681–696. doi: 10.1038/nrneph.2017.129. [DOI] [PubMed] [Google Scholar]
- 30.Cinà DP, et al. Inhibition of MTOR disrupts autophagic flux in podocytes. J Am Soc Nephrol. 2012;23(3):412–420. doi: 10.1681/ASN.2011070690. [DOI] [PMC free article] [PubMed] [Google Scholar]
- 31.Riediger F, et al. Prorenin receptor is essential for podocyte autophagy and survival. J Am Soc Nephrol. 2011;22(12):2193–2202. doi: 10.1681/ASN.2011020200. [DOI] [PMC free article] [PubMed] [Google Scholar]
- 32.Huber TB, Walz G, Kuehn EW. mTOR and rapamycin in the kidney: signaling and therapeutic implications beyond immunosuppression. Kidney Int. 2011;79(5):502–511. doi: 10.1038/ki.2010.457. [DOI] [PubMed] [Google Scholar]
- 33.Narita M, et al. Spatial coupling of mTOR and autophagy augments secretory phenotypes. Science. 2011;332(6032):966–970. doi: 10.1126/science.1205407. [DOI] [PMC free article] [PubMed] [Google Scholar]
- 34.Canaud G, et al. AKT2 is essential to maintain podocyte viability and function during chronic kidney disease. Nat Med. 2013;19(10):1288–1296. doi: 10.1038/nm.3313. [DOI] [PubMed] [Google Scholar]
- 35.Zaza G, Granata S, Tomei P, Masola V, Gambaro G, Lupo A. mTOR inhibitors and renal allograft: Yin and Yang. J Nephrol. 2014;27(5):495–506. doi: 10.1007/s40620-014-0103-y. [DOI] [PubMed] [Google Scholar]
- 36.Manning BD, Toker A. AKT/PKB signaling: navigating the network. Cell. 2017;169(3):381–405. doi: 10.1016/j.cell.2017.04.001. [DOI] [PMC free article] [PubMed] [Google Scholar]
- 37.Borrie SC, Brems H, Legius E, Bagni C. Cognitive dysfunctions in intellectual disabilities: the contributions of the Ras-MAPK and PI3K-AKT-mTOR pathways. Annu Rev Genomics Hum Genet. 2017;18:115–142. doi: 10.1146/annurev-genom-091416-035332. [DOI] [PubMed] [Google Scholar]
- 38.Dong LW, et al. Signal regulatory protein alpha negatively regulates both TLR3 and cytoplasmic pathways in type I interferon induction. Mol Immunol. 2008;45(11):3025–3035. doi: 10.1016/j.molimm.2008.03.012. [DOI] [PubMed] [Google Scholar]
- 39.Petherick KJ, et al. Autolysosomal β-catenin degradation regulates Wnt-autophagy-p62 crosstalk. EMBO J. 2013;32(13):1903–1916. doi: 10.1038/emboj.2013.123. [DOI] [PMC free article] [PubMed] [Google Scholar]
- 40.Maekawa T, Imoto A, Satoh T, Okazaki T, Takahashi S. Induction of beta-catenin by the suppression of signal regulatory protein alpha 1 in K562 cells. Int J Mol Med. 2011;27(6):865–872. doi: 10.3892/ijmm.2011.630. [DOI] [PubMed] [Google Scholar]
- 41.Schell C, Huber TB. The evolving complexity of the podocyte cytoskeleton. J Am Soc Nephrol. 2017;28(11):3166–3174. doi: 10.1681/ASN.2017020143. [DOI] [PMC free article] [PubMed] [Google Scholar]
- 42.Asanuma K, Yanagida-Asanuma E, Faul C, Tomino Y, Kim K, Mundel P. Synaptopodin orchestrates actin organization and cell motility via regulation of RhoA signalling. Nat Cell Biol. 2006;8(5):485–491. doi: 10.1038/ncb1400. [DOI] [PubMed] [Google Scholar]
- 43.Hussain S, et al. Nephrin deficiency activates NF-kappa B and promotes glomerular injury. J Am Soc Nephrol. 2009;20(8):1733–1743. doi: 10.1681/ASN.2008111219. [DOI] [PMC free article] [PubMed] [Google Scholar]
- 44.Saleem MA, et al. Co-localization of nephrin, podocin, and the actin cytoskeleton: evidence for a role in podocyte foot process formation. Am J Pathol. 2002;161(4):1459–1466. doi: 10.1016/S0002-9440(10)64421-5. [DOI] [PMC free article] [PubMed] [Google Scholar]
- 45.Kajiho Y, et al. SIRPα interacts with nephrin at the podocyte slit diaphragm. FEBS J. 2012;279(17):3010–3021. doi: 10.1111/j.1742-4658.2012.08682.x. [DOI] [PubMed] [Google Scholar]
- 46.Zhu D, et al. MicroRNA-17/20a/106a modulate macrophage inflammatory responses through targeting signal-regulatory protein α. J Allergy Clin Immunol. 2013;132(2):426–36.e8. doi: 10.1016/j.jaci.2013.02.005. [DOI] [PMC free article] [PubMed] [Google Scholar]
- 47.Bian Z, et al. Cd47-Sirpα interaction and IL-10 constrain inflammation-induced macrophage phagocytosis of healthy self-cells. Proc Natl Acad Sci USA. 2016;113(37):E5434–E5443. doi: 10.1073/pnas.1521069113. [DOI] [PMC free article] [PubMed] [Google Scholar]
- 48.Saleem MA, et al. A conditionally immortalized human podocyte cell line demonstrating nephrin and podocin expression. J Am Soc Nephrol. 2002;13(3):630–638. doi: 10.1681/ASN.V133630. [DOI] [PubMed] [Google Scholar]
- 49.Mundel P, et al. Rearrangements of the cytoskeleton and cell contacts induce process formation during differentiation of conditionally immortalized mouse podocyte cell lines. Exp Cell Res. 1997;236(1):248–258. doi: 10.1006/excr.1997.3739. [DOI] [PubMed] [Google Scholar]
- 50.Yanagida-Asanuma E, et al. Synaptopodin protects against proteinuria by disrupting Cdc42:IRSp53:Mena signaling complexes in kidney podocytes. Am J Pathol. 2007;171(2):415–427. doi: 10.2353/ajpath.2007.070075. [DOI] [PMC free article] [PubMed] [Google Scholar]
- 51.Faul C, et al. The actin cytoskeleton of kidney podocytes is a direct target of the antiproteinuric effect of cyclosporine A. Nat Med. 2008;14(9):931–938. doi: 10.1038/nm.1857. [DOI] [PMC free article] [PubMed] [Google Scholar]
- 52.Li L, et al. MicroRNA-155 and microRNA-21 promote the expansion of functional myeloid-derived suppressor cells. J Immunol. 2014;192(3):1034–1043. doi: 10.4049/jimmunol.1301309. [DOI] [PubMed] [Google Scholar]
- 53.Liu X, et al. Isolating glomeruli from mice: a practical approach for beginners. Exp Ther Med. 2013;5(5):1322–1326. doi: 10.3892/etm.2013.1000. [DOI] [PMC free article] [PubMed] [Google Scholar]
Associated Data
This section collects any data citations, data availability statements, or supplementary materials included in this article.


