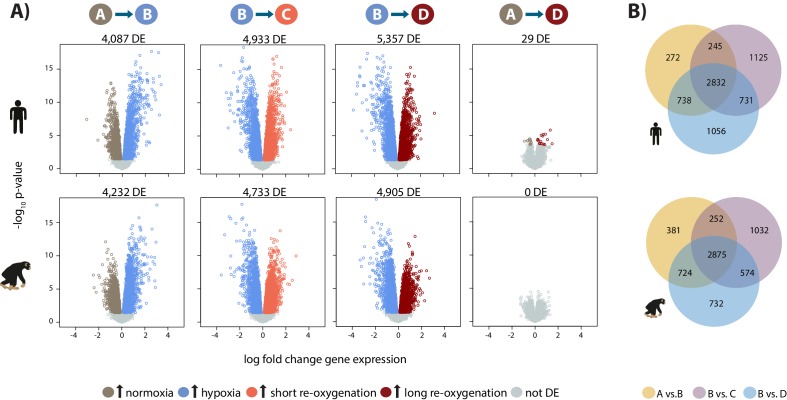
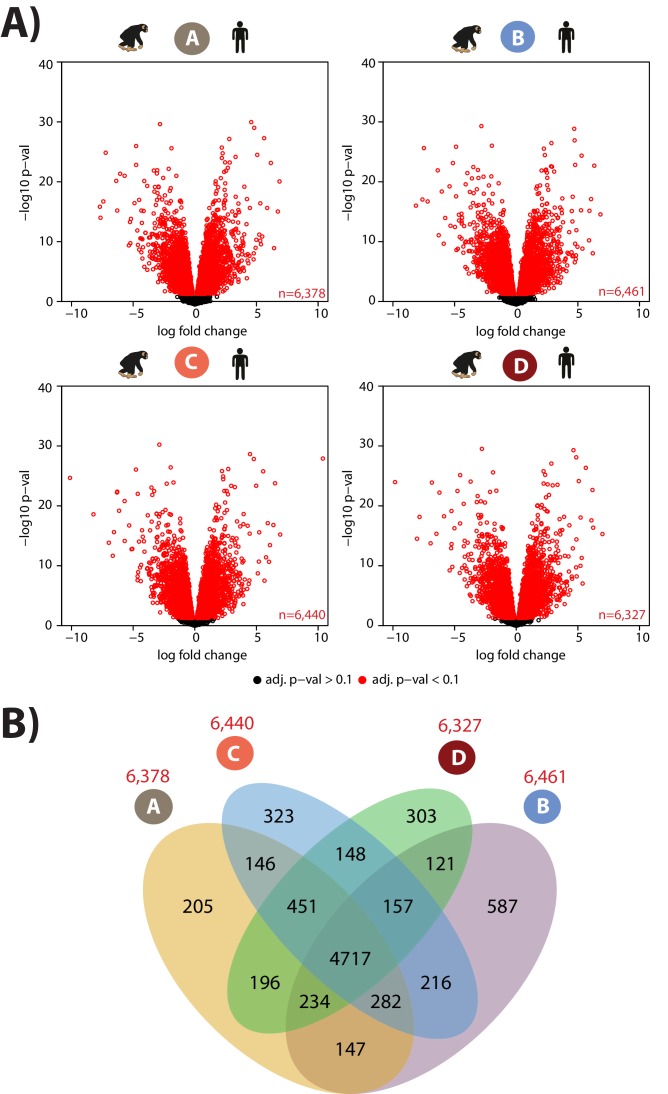
Figure 2. Hypoxia induces a gene expression response in humans and chimpanzees.
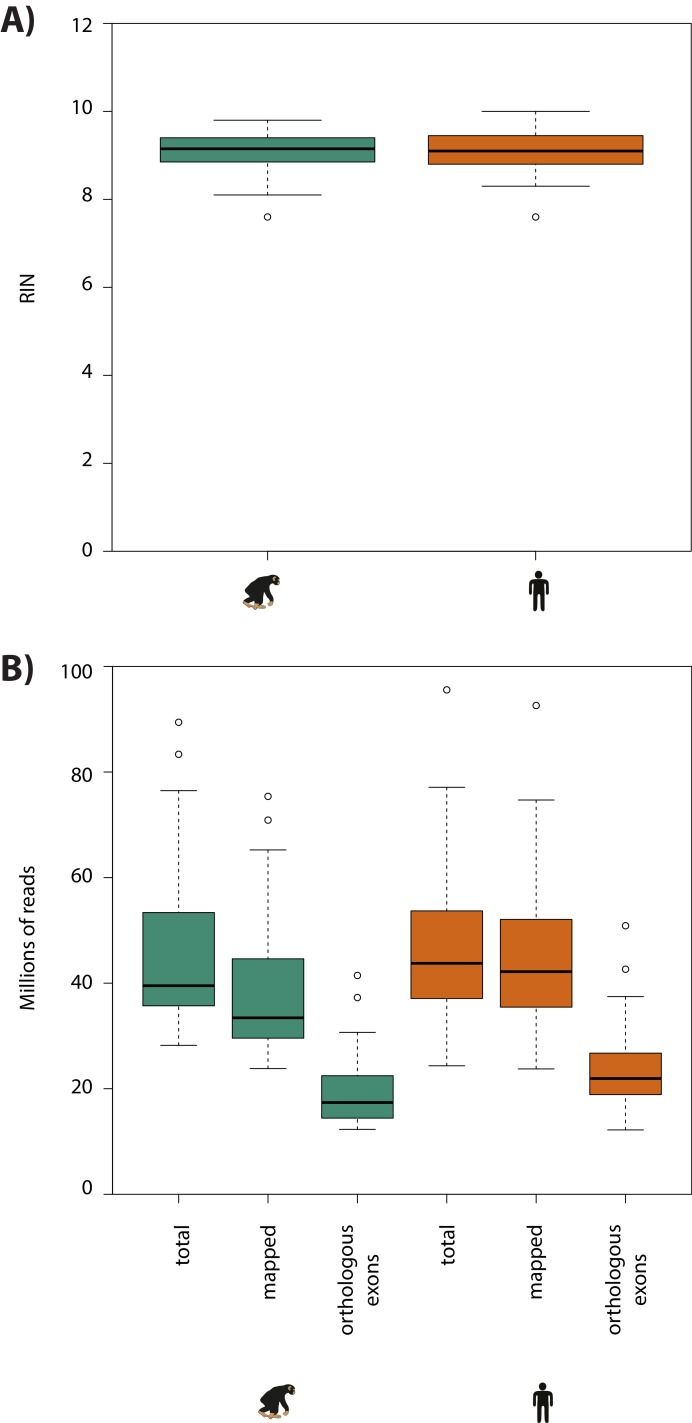
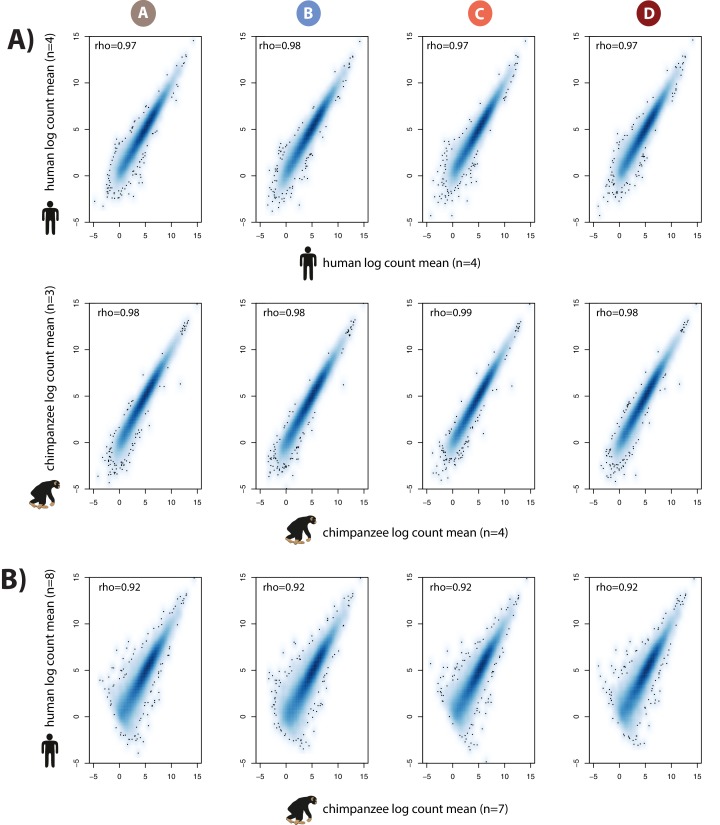
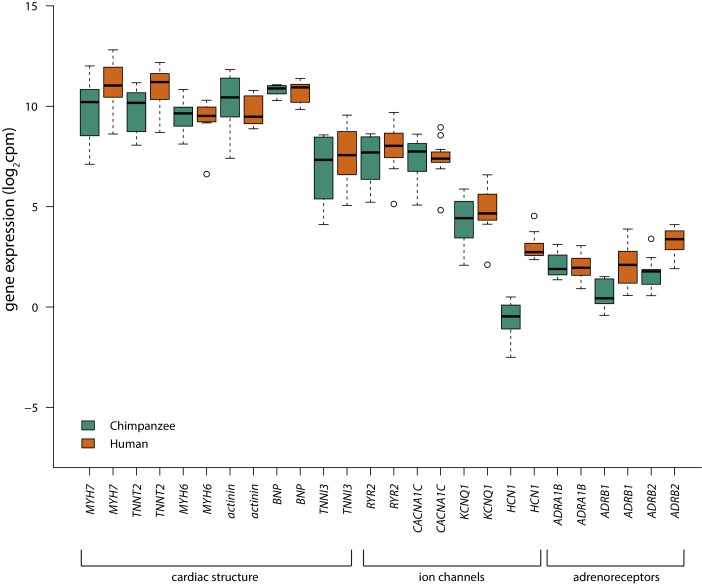
(A) Volcano plots representing genes that are differentially expressed (DE; 10% FDR) in pairwise comparisons across conditions in each species independently. In a comparison of A vs. B, genes that are up-regulated in hypoxia are represented in blue, and genes that are up-regulated in normoxia are represented in brown. Genes that are up-regulated in condition C are represented in coral, and genes that are up-regulated in D are represented in dark red. (B) Overlap of genes that are differentially expressed in pairs of conditions in each species independently. Also see Figure 2—figure supplements 1–7.

