Abstract
Glioblastoma is the most common primary brain tumor. It is highly malignant and has a correspondingly poor prognosis. Diagnosis and monitoring are mainly accomplished with MRI, but remain challenging in some cases. Therefore, complementary methods for tumor detection and characterization would be beneficial. Using Magnetic Resonance Elastography (MRE), we performed a longitudinal study of the biomechanical properties of intracranially implanted glioblastoma (GBM) in mice and compared the results to histopathology. The biomechanical parameters of viscoelastic modulus, shear wave speed and phase angle were significantly lower in tumors compared to healthy brain tissue and decreased over time with tumor progression. Moreover, some MRE parameters revealed sub-regions at later tumor stages, which were not easily detectable on anatomical MRI images. Comparison to histopathology showed that softer tumor regions contained necrosis and patches of viable tumor cells. In contrast, areas of densely packed tumor cells and blood vessels identified with histology coincided with higher values of viscoelastic modulus and shear wave speed. Interestingly, the phase angle was independent from these anatomical variations. In summary, MRE depicted longitudinal and morphological changes in GBM and may prove valuable for tumor characterization in patients.
Keywords: Magnetic Resonance Elastography, brain tumor, glioblastoma, stiffness, viscoelastic modulus, longitudinal progression
Graphical abstract
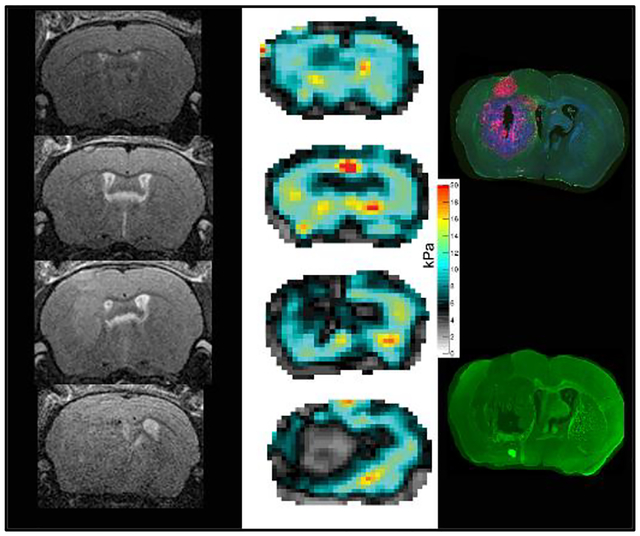
A longitudinal study of glioblastoma biomechanical properties in mice was performed using Magnetic Resonance Elastography (MRE). The tumor was softer than healthy tissue and its stiffness progressively decreased with age. Different tumor sub-regions were easily observed on both MRE and histology but not on T2w scans.
1. Introduction
Primary tumors of the central nervous system have an incidence of approx. 30/100,000 persons in the US1. Even though brain malignancies do not rank among the most common cancer types, they contribute significantly to overall cancer morbidity and mortality. Glioblastoma (GBM) is both the most common primary brain tumor1 and the most malignant. Patients have a poor prognosis with only a 5% survival rate five years post diagnosis1. GBM derives from poorly differentiated neoplastic astrocytes and is highly invasive. GBM typically presents with regional heterogeneity. Prominent microvascular proliferation as well as necrosis are important histopathological hallmarks2.
Magnetic Resonance Imaging (MRI) with contrast-enhanced T1-weighted (T1w) as well as T2-weighted (T2w) or fluid-attenuated inversion recovery (FLAIR) sequences is a standard method for diagnosis and follow-up of patients with brain tumors. The main issues addressed by MRI are the differentiation of neoplastic from other lesions, tumor grading, identification of complications, treatment planning and evaluation of treatment response3. The latter includes both assessment of contrast-enhancing and non-enhancing tumor components depicted on contrast-enhanced T1w- and T2w- or FLAIR sequences, respectively, according to the recommendations of the Response Assessment in Neuro-Oncology (RANO) Working Group4. Additionally, several advanced MRI techniques are part of the diagnostic work-up of patients with intracranial masses. Diffusion weighted imaging (DWI) is used to assess cellular density, dynamic contrast enhanced sequences are applied to gain information on vascular proliferation and permeability, MR spectroscopy can help to depict biochemical processes within a tumor and functional MRI as well as diffusion tensor imaging (DTI) are utilized to evaluate the relationship between tumors and eloquent brain regions or white matter tracts5. Despite these many methods to evaluate tumors, their differentiation is challenging and a biopsy is usually needed to establish a diagnosis.
Other groups have also investigated brain tumors with Magnetic Resonance Elastography (MRE)6–8. MRE is a noninvasive imaging technique that produces quantitative maps of in vivo biomechanical tissue properties such as tissue stiffness or softness9. MRE parameters are related to haptic sensation, but objectively inform about the stiffness or softness of a tissue. To perform MRE, mechanical shear waves are transmitted to the tissue of interest. The propagation of these waves is measured by applying motion-encoding MR gradients. The time harmonic steady state shear wave pattern is then used as input to a linear inversion of the wave equation to estimate biomechanical properties, which are then displayed in elastographic maps or elastograms10–12. Several studies have shown that stiffness, as measured with MRE, is in good agreement with tumor consistency assessed by a neurosurgeon intraoperatively6,13–15. In addition, different tumor types vary in their biomechanical properties. A general observation is that intracranial malignancies are softer than benign tumors or healthy brain parenchyma7,8,16. In an earlier study of GBM with MRE, Streitberger et al. observed a large heterogeneity of viscoelastic modulus within the tumors studied17.
To further investigate the potential of MRE to both detect and characterize GBM, we assessed brain viscoelastic modulus longitudinally in mice with intracranially implanted tumors and compared the elastograms to histopathology. We expect that biomechanical parameters will provide further insight into tumor characteristics complementing the information gained by classical MRI-based approaches.
2. Material and Methods
2.1. Animals and tumors
All experiments were performed in accordance with the local institutional animal care and use committee (IACUC). The glioblastoma stem cell line (G30) used for these experiments was originally established from a patient tissue sample obtained under an IRB approved protocol at the Ohio State University Medical Center and provided by The Ohio State University Tissue Procurement services. Tumor cells were grown in vitro as previously described18. A stable expression of mCherry red protein marker and Firefly Luciferase was accomplished by infection with lentivirus (GeneCopoeia, cat# LPP-HLUC-LV206–025-C, Rockville, MD, USA) and puromycin selection. Approximately 50,000 cells were surgically implanted into the central striatum of 5 nu/nu mice (Envigo, South Easton, MA, USA; 2 mm right lateral and 0.5 mm frontal to the bregma at 3.5 mm depth as described19). Mice survive an average of 30 days after implantation. Successful tumor engraftment was ultimately confirmed on T2w MR images.
2.2. MRI and MRE
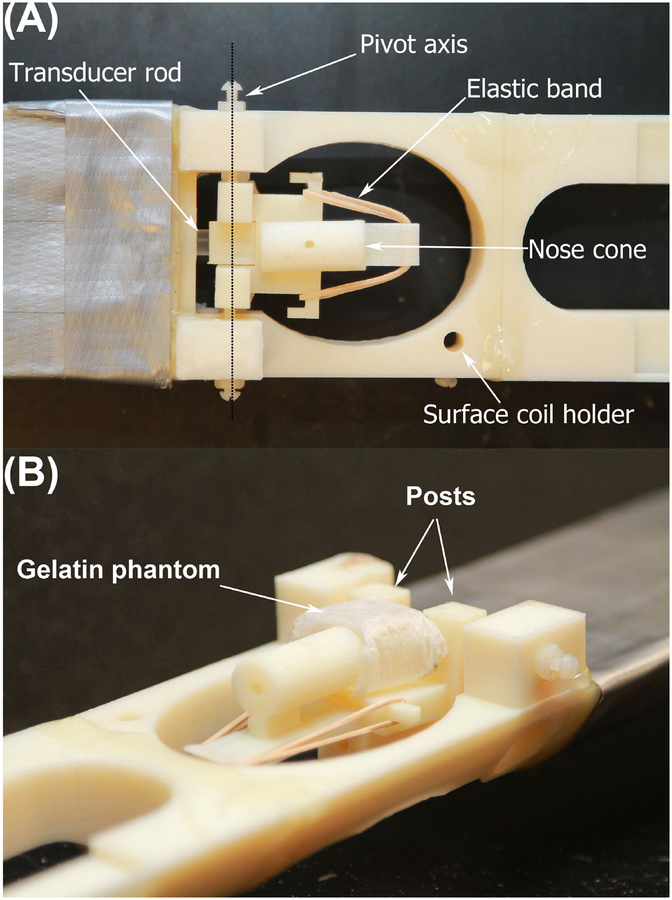
MRI and MRE were performed on a 7 T horizontal bore Bruker small animal scanner (Ettlingen, Germany; gradient strength 660 mT/m) using an 8.6 cm body coil for transmission and a 2 cm surface coil for reception. MRI and MRE data were acquired longitudinally at weekly time intervals: 3 of the 5 animals were scanned over a period of 4 weeks and subsequently sacrificed for histological analyses. The 2 remaining animals were sacrificed after completing 2 and 3 scanning time points, respectively. For imaging, anesthesia was induced with 2.5 % isoflurane in 100 % O2 and maintained with 1 – 1.5 % isoflurane in 100 % O2 delivered via a nose cone. Respiration rate was constantly monitored (SA Instruments, Stony Brook, NY, USA). The animals were placed prone on a custom-built bed with the head fixated in a cage assembly (Figure 1). Briefly, the neck of the animal is first placed between two posts on the cage assembly. A nose cone on the cage assembly has the freedom to slide in the head-foot direction and, with an elastic band, is tensioned to draw the nose cone towards the feet. Once the nose cone is placed on the animal, this tension squeezes the head against the posts through which the neck was placed. The entire head cage is mounted on two pivot points, and it is coupled to a rod protruding outside the MRI scanner. An external transducer, vibrating at 1 kHz, transmits mechanical vibrations to the brain through the rod. After standard calibration, pilot scans and shimming, a coronal T2w sequence was acquired (RARE; TR/TE 5000/56 ms; FOV 19.2 mm; matrix 192 × 192; 6 averages; 9 × 0.3 mm slices; acquisition time 12 min) followed by a customized multi-slice, single spin echo MRE sequence20 (TR/TE 900/29 ms; FOV 19.2 mm; matrix 64 × 64; 1 average; 8 wave phases; 9 slices; isotropic resolution 0.3 mm; acquisition time 23 min; vibration frequency 1 kHz). RARE and MRE covered identical volumes and were positioned in the tumor bearing region.
FIGURE 1.
The cage assembly of the shaker apparatus is shown in top (A) and side view (B). The gelatin phantom in B is placed where the mouse head would be located. The nose cone is tensioned with the elastic band and can slide in the head-foot direction. It is placed on the animal’s snout and the tension squeezes the head against the posts through which the neck is placed. The entire head cage is mounted on two pivot points, and it is coupled to a rod protruding outside the MRI scanner. This rod transmits mechanical vibration produced by an external transducer (not shown) to the brain.
MRE-data were reconstructed using dedicated in-house software (ROOT environment, CERN; Meyrin, Switzerland) according to published algorithms10,21. T2w RARE images were displayed in the same software and used as anatomical references. Regions of interest (ROI) covering the tumors were defined on T2w images and copied to reconstructed MRE-maps. The datasets acquired one week after tumor implantation were used to establish reference or control values. A second ROI was placed in the contralateral healthy hemisphere and encompassed the cortex and deep gray matter as well as adjacent white matter tracts but excluded the ventricles. This control ROI had the same shape and size across all animals. Mean and standard deviation were calculated for the following biomechanical parameters. |G*| is the absolute value of the complex valued shear modulus and comprises measures of elasticity (Gd) and viscosity (Gl), . We refer to |G*| as viscoelastic modulus in the following. Furthermore, shear wave speed (Cs) was evaluated. Cs = ω/β; ω = 2πν and the wave vector k = β − iα; β, wave propagation; α, attenuation; and ν, frequency. k is evaluated from the common relation between complex shear modulus and wave vector, i.e. . The phase angle (Y) was additionally analyzed, . Y reveals whether a tissue behaves more like an elastic (Y = 0) or like a viscous material (Y = 1).
As later tumor stages presented with distinguishable sub-regions on elastograms, separate ROIs covering these regions were defined and copied to the anatomical T2w images. Mean and standard deviation for MRE-parameters as well as for relative T2w signal intensity were obtained. As absolute values of T2w signal intensity are not meaningful due to a variable overall gain factor in different scans, we calculated relative T2w signal intensity. For this, the ratio between the average signal intensity in the tumor sub-regions and average signal intensity of another reference ROI positioned in a muscle was determined.
Statistical analysis was performed with GraphPad Prism (version 5 for Mac, GraphPad Software, La Jolla, CA, USA). The longitudinal change in the viscoelastic modulus and shear wave speed was obtained by calculating the percentage difference between a particular time point with respect to the immediate preceding time point as well as with respect to the control. For the comparison of tumor sub-regions, paired two-tailed t-tests were conducted for MRE-parameters and for relative T2w signal intensity.
All tests were classified as significant when P value was < 0.05.
2.3. Histology
Mice were sacrificed by CO2 asphyxation and intracardially perfused with 30 ml saline followed by 10 % neutral buffered paraformaldehyde (PFA; Sigma-Aldrich cat#HT501128–4L, St Louis, MO, USA). Brains were harvested, postfixed in 10% neutral buffered PFA and then transferred in 30% sucrose solution for dehydration. After this, brains were frozen and cryo-sectioned in 30 μm sections. These were collected into sets with 300 μm spacing allowing for whole tumor volume reconstruction. The sections were stained as follows: DNA (Hoechst 33342, Thermo Scientific cat#62249, Waltham, MA, USA), myelin (Thermo Scientific cat# F34651), actin cytoskeleton (Thermo Scientific cat# A12380), tubulin cytoskeleton (Thermo Scientific cat# T34075), blood vessels (purified rat anti-mouse CD31, BD Biosciences cat#A00158 and secondary antibody donkey anti-rat-Alexa647, Jackson ImmunoResearch Laboratories cat# 712–606-150, West Grove, PA, USA). The endogenous mCherry red protein or vimentin (Abcam, cat#ab16700, Jackson cat# 711–586-152, Cambridge, MA, USA) immunofluorescence labeling were used to mark the tumor area. Additionally, conventional hematoxylin and eosin (H&E) staining was performed. Whole slide images were captured with a motorized Nikon Eclipse Ti fluorescence microscope (Nikon, Melville, NY, USA) and edited in Nikon’s NIS software, open source ImageJ (NIH ImageJ, https://imagej.net) and Adobe Photoshop (version CS2 for Windows, Adobe Systems Incorporated, San Jose, CA, USA). Histological images in representative locations for each MRE and MRI image were identified. Morphological features of all three modalities were directly compared with emphasis on the tumor sub-regions identified on the elastograms.
3. Results
3.1. Tumor appearance on anatomical T2w images
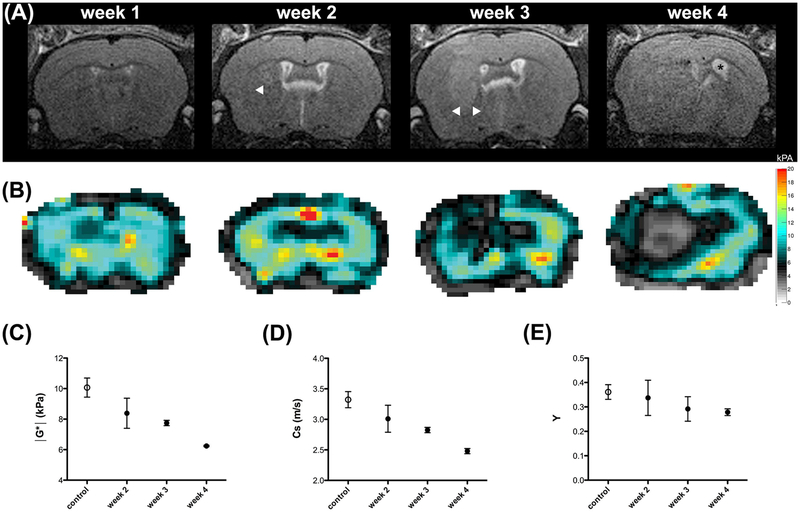
One week after implantation, in two out of five animals, small well circumscribed slightly hyperintense masses could be identified in the right deep gray matter on the T2w images. These slightly T2w hyperintense masses increased significantly in size over the course of one week and stretched from the deep gray matter into cortical structures (Figure 2A). The border remained rather sharp. Tumor size further progressed and a mass effect was observable in all animals 3 weeks after implantation. The tumors led to midline shift and compression of the right lateral ventricles. The left lateral ventricle was expanded in some animals, which hints at retention of cerebrospinal fluid (CSF). Two animals showed intratumoral hemorrhage. Apart from that, the masses appeared homogeneously hyperintense on T2w scans. At week 4, tumors were very large and their borders became harder to distinguish on T2w RARE images. A progressive significant mass effect was observable with increasing midline shift and almost complete compression of the right lateral ventricle. Signs of occlusive hydrocephalus with ballooning of the left lateral ventricle and transependymal edema were visible in all animals that reached this tumor stage. Additionally, intratumoral bleeding occurred in another animal.
FIGURE 2.
The longitudinal evaluation of tumor in one animal is shown on T2w RARE images (A) and on elastograms of viscoelastic modulus (in kPa; B). Borders of the hyperintense tumor in the T2w scans are circumscribed in weeks 2 and 3 (A, arrowheads) but are harder to delineate in week 4. The mass effect is significant in week 4 with midline shift and occlusive hydrocephalus (A, asterisk in ballooned left ventricle). The tumor is easily detectable on elastograms (B) and values for viscoelastic modulus (C), shear wave speed (D) and phase angle (E) decrease in tumors (black dots) significantly over time compared to healthy tissue (white dots). Mean and SD are shown.
3.2. MRE parameters change over time
We established reference values for viscoelastic modulus and shear wave speed in the healthy hemispheres of all animals one week after tumor implantation. As the tumors were very small at this time point, an influence of the tumor on MRE parameters of this non-tumor bearing hemisphere seemed to be very unlikely. Only two out of five animals presented with small tumors visible on T2w RARE one week after implantation. Hence, this time point was excluded from the longitudinal analysis of MRE parameters.
Starting from week 2, pronounced differences between the tumor and healthy brain tissue were easily visible to the naked eye on elastograms of the viscoelastic modulus, shear wave speed and phase angle (Figure 2B). In general, tumors had lower values for viscoelastic modulus, shear wave speed and phase angle than healthy tissue at all time points (Table 1). Moreover, a longitudinal evaluation of the biomechanical tumor properties was observable. The tumors became significantly softer over time (38% decrease of viscoelastic modulus in week 4 compared to control) and shear wave speed as well as the phase angle decreased considerably (25% and 22% decrease of shear wave speed and phase angle, respectively in week 4 compared to control; Table 1, Figure 2C, D and E).
TABLE 1.
Longitudinal evaluation of viscoelastic modulus and shear wave speed. The values were obtained in a control ROI and ROIs covering the tumors in week 2 – 4 after tumor implantation. The percentage difference was calculated between a particular time point with respect to the immediate preceding time point as well as with respect to the control. SD = standard deviation.
| shear wave speed Cs (m/s) mean (SD) |
viscoelastic modulus |G*| (kPa) mean (SD) |
phase angle Y mean (SD) |
||||||||||
|---|---|---|---|---|---|---|---|---|---|---|---|---|
| control | week 2 | week 3 | week 4 | control | week 2 | week 3 | week 4 | control | week 2 | week 3 | week 4 | |
| mouse 1 | 3.38 (0.39) |
3.39 (0.23) |
2.89 (0.43) |
2.51 (0.56) |
10.33 (2.04) |
10.07 (1.52) |
7.93 (2.57) |
6.21 (2.7) |
0.37 (0.13) | 0.45 (0.07) | 0.34 (0.14) | 0.29 (0.12) |
| mouse 2 | 3.35 (0.38) |
2.87 (0.34) |
2.80 (0.58) |
2.45 (0.74) |
10.23 (2.31) |
7.85 (1.53) |
7.57 (3.8) |
6.27 (4.27) |
0.34 (0.13) | 0.27 (0.11) | 0.32 (0.17) | 0.27 (0.14) |
| mouse 3 | 3.13 (0.48) |
3.01 (0.37) |
2.80 (0.58) |
- | 9.15 (2.47) |
8.30 (1.72) |
7.86 (3.58) |
- | 0.34 (0.12) | 0.30 (0.16) | 0.22 (0.13) | - |
| mouse 4 | 3.43 (0.60) |
2.85 (0.31) |
- | - | 10.56 (3.27) |
7.56 (1.59) |
- | - | 0.40 (0.18) | 0.31 (0.13) | - | - |
| mouse 5 | - | 2.93 (0.38) |
2.81 (0.48) |
- | - | 8.15 (1.89) |
7.63 (2.65) |
- | - | 0.33 (0.15) | 0.28 (0.13) | - |
| average | 3.32 (0.13) |
3.01 (0.22) |
2.83 (0.04) |
2.48 (0.04) |
10.07 (0.63) |
8.39 (0.98) |
7.75 (0.17) |
6.24 (0.04) |
0.36 (0.03) | 0.34 (0.07) | 0.29 (0.06) | 0.28 (0.01) |
| Percentage difference (%) | ||||||||||||
| vs. immediate previous time point | - | 9.34 | 6.00 | 12.37 | - | 16.68 | 7.63 | 19.48 | - | 5.5 | 13.89 | 3.45 |
| vs. control | - | 9.34 | 14.76 | 25.30 | - | 16.68 | 23.04 | 37.74 | - | 5.5 | 19.44 | 22.22 |
3.3. MRE parameters show regional differences
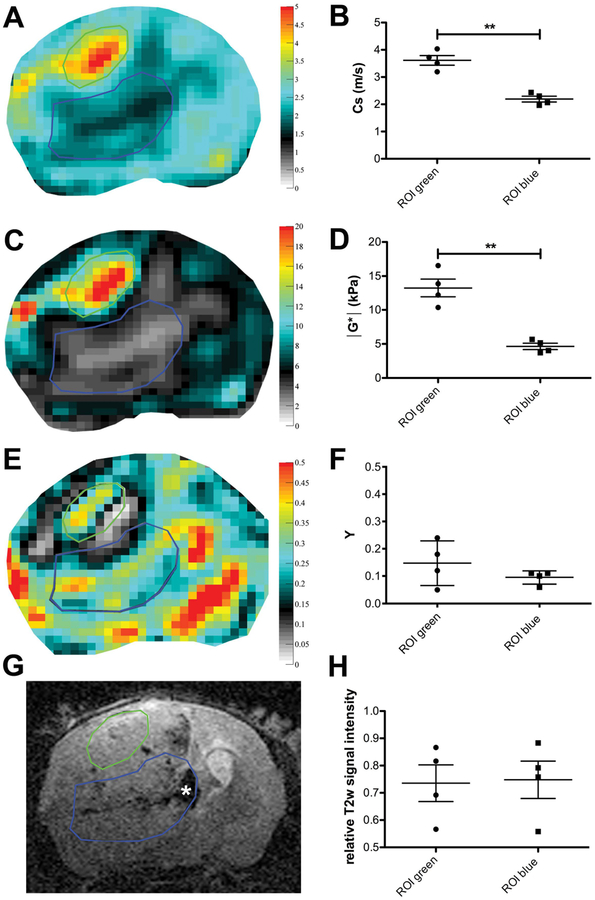
When examining the elastograms of the four animals that reached later tumor stages, i.e. 3 or 4 weeks post implantation, we noticed relatively well defined sub-regions with clearly diverging values of viscoelastic modulus and shear wave speed. These sub-regions were not obviously distinguishable on T2w RARE images. Two animals had local intratumoral hemorrhages in one of these regions, the remaining tumor however appeared rather homogeneous (Figure 3G). We defined ROIs covering these sub-regions on the elastograms, copied them to the respective RARE scan and compared mean values of MRE parameters and relative T2w signal intensity to objectify this observation (Figure 3). The analysis confirmed the visual impression, as the mean values of shear wave speed and viscoelastic modulus in the two sub-regions identified were significantly different (mean and percentages of differences for shear wave speed 1.42 m/s, 40% P value = 0.0047 and viscoelastic modulus 8.6 kPa, 60 %, P value = 0.0068; Table 2). In contrast, the mean relative T2w signal intensity of the two sub-region ROIs did not show a significant difference (mean and percentage of differences −0.0150, 0.03 %, P value = 0.5760; Table 2), even though one of the sub-regions included more hemorrhagic parts with low relative T2w signal compared to the other region. The phase angle did not reveal a significant difference between the two sub-regions either (mean and percentage of differences −0.0525, 33%, P value = 0.2019; Table 2).
FIGURE 3.
Elastograms of shear wave speed (in m/s; A) and viscoelastic modulus (in kPa; C) show easily distinguishable sub-regions (encircled in green and blue) that are not as easy to distinguish on T2w RARE images (G) where the tumor appears relatively homogeneous, apart from intratumoral hemorrhages (asterisk in G). The elastogram of the phase angle Y (E) does not reveal a significant difference between the sub-regions either. The mean values of shear wave speed (B) and viscoelastic modulus (D) in the sub-regions were significantly different, whereas Y (F) and the mean relative T2w signal intensity (H) were similar in both regions. ** P < 0.01; ROIs covering tumor sub-regions in all mice compared in a paired t-test. Mean and SD are shown.
TABLE 2.
Comparison of viscoelastic modulus, shear wave speed and relative T2w signal intensity in tumor sub-regions. SD, standard deviation.
| shear wave speed Cs (m/s) | viscoelastic modulus |G*| (kPa) | phase angle Y | T2w signal intensity relative to muscle | |||||
|---|---|---|---|---|---|---|---|---|
| ROI 1 (green) | ROI 2 (blue) | ROI 1 (green) | ROI 2 (blue) | ROI 1 (green) | ROI 2 (blue) | ROI 1 (green) | ROI 2 (blue) | |
| raw values | ||||||||
| mouse 1 | 3.19 | 2.06 | 10.36 | 4.03 | 0.12 | 0.32 | 0.73 | 0.81 |
| mouse 2 | 3.50 | 2.43 | 12.20 | 5.68 | 0.24 | 0.28 | 0.58 | 0.57 |
| mouse 3 | 3.72 | 1.96 | 13.87 | 3.70 | 0.18 | 0.27 | 0.94 | 0.96 |
| mouse 4 | 4.03 | 2.30 | 16.54 | 5.15 | 0.05 | 0.22 | 0.88 | 0.85 |
| mean | 3.61 | 2.19 | 13.24 | 4.64 | 0.15 | 0.10 | 0.78 | 0.80 |
| SD | 0.35 | 0.22 | 2.62 | 0.93 | 0.08 | 0.02 | 0.16 | 1.16 |
| P value | 0.0047 | 0.0068 | 0.2019 | 0.576 | ||||
3.4. Elastograms show differences revealed by histology
We then wanted to find out how the identified tumor regions compare to cellular and molecular structures. For this, we performed histopathological analyses.
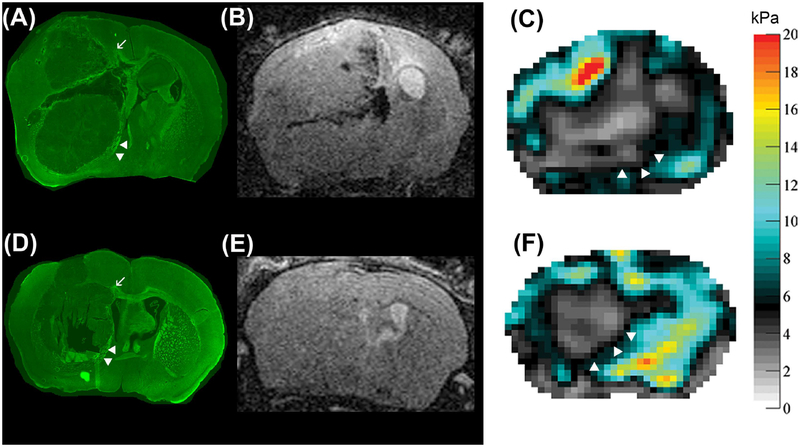
All tumors investigated showed highly aggressive growth and had relatively well circumscribed borders. The surrounding tissue was significantly displaced, which can be seen in the immunofluorescent staining for myelin (Figure 4). Larger white matter tracts located between deep gray matter structures were pushed aside and seemed partially heavily distorted. The corpus callosum of the tumor-bearing hemisphere was destroyed (Figure 4A, D).
FIGURE 4.
Comparison of immunofluorescent myelin staining (A, D) of two animals 4 weeks after tumor implantation to respective T2w RARE images (B, E) and viscoelastic modulus maps (in kPa; C, F). The tumors have relatively sharp borders and significantly displace the surrounding tissue as can be seen by distortion and dislocation of white matter tracts (A, D, arrowheads). Tumor borders are hard to delineate on T2w RARE images (B, E), but well circumscribed on the elastograms (C, F, arrowheads). The corpus callosum of the tumor-bearing hemisphere is destroyed (A, D, arrow).
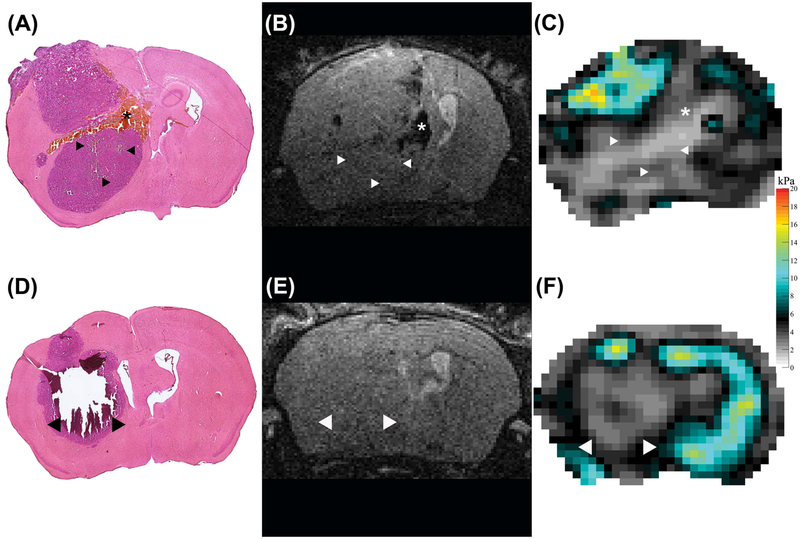
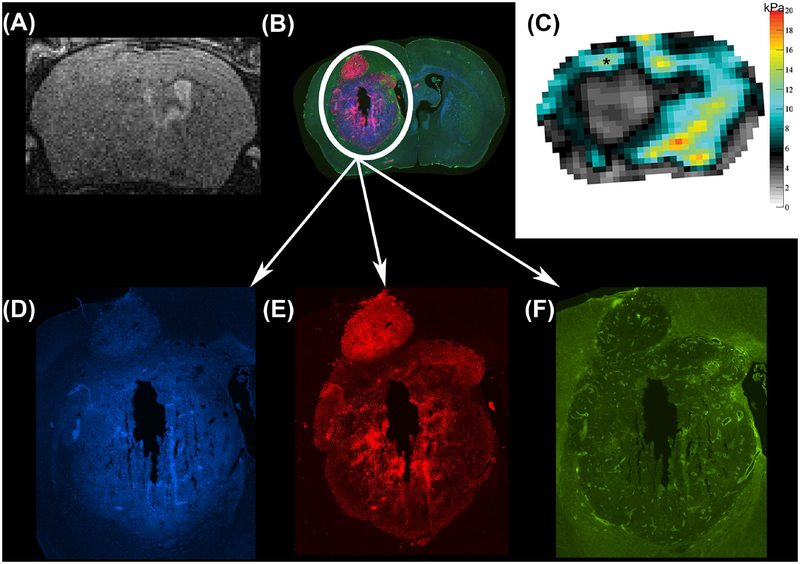
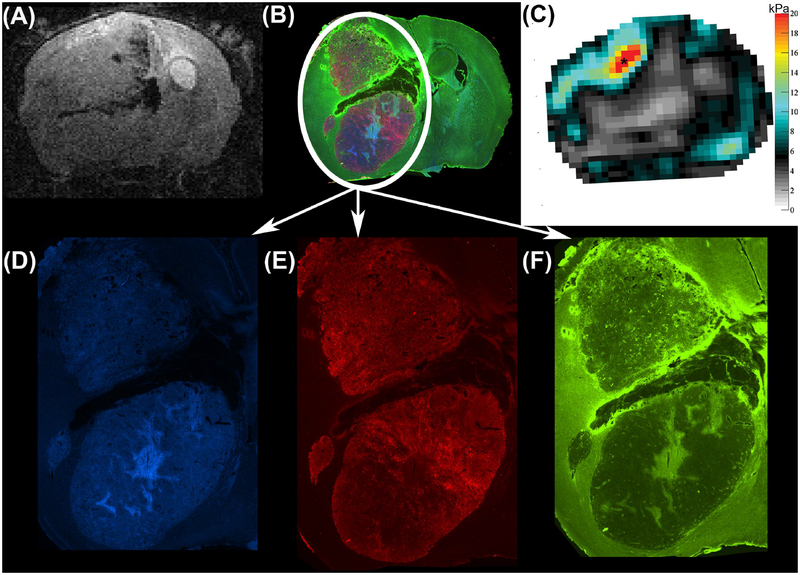
The sub-regions identified on the elastograms exhibited different histopathological features. In all animals investigated, the softer areas (blue ROIs in Figure 3A, C, E) were very heterogeneous. Hemorrhagic spots and patches where cells were absent, consistent with necrosis could be found next to viable tumor cells (Figures 5, 6 and 7).
FIGURE 5.
H&E staining (A, D), T2w RARE scan (B, E) and viscoelastic modulus map (in kPa; C, F), all in the same location in two different mice 4 weeks after tumor implantation. The arrowheads in the H&E stained sections indicate areas that were completely destroyed (D, arrowheads) or show larger cracks (A, arrowheads) after the staining procedure. These areas coincide with soft areas on the elastograms (C, F, arrowheads). We hypothesize that this damage occurred due to loss off necrotic tissue during the staining procedure. One animal presented with patchy intratumoral hemorrhage, corresponding to a softer region on the viscoelastic modulus map (asterisks, A-C).
FIGURE 6.
Anatomical T2w RARE scan (A), immunofluorescent staining (B) and viscoelastic modulus map (in kPa; C), all in the same location in a mouse 4 weeks after tumor implantation. Magnifications of the tumor region show three different immunofluorescent channels depicting DNA in blue (Hoechst, D), viable tumor cells in red (endogenous mCherry red protein, E) and blood vessels in green (CD31, F). Of note, the stiffer tumor region (C, asterisk) presents with an intense red staining (B, E) indicating densely packed viable tumor cells.
FIGURE 7.
Anatomical T2w RARE scan (A), immunofluorescent staining (B) and viscoelastic modulus map (in kPa; C) in the same location 4 weeks after tumor implantation and for a mouse different from the one shown in Figure 6. Magnifications of the tumor region show the separate immunofluorescent channels that depict DNA in blue (Hoechst, D), viable tumor cells in red (endogenous mCherry red protein, E) and blood vessels in green (CD31, F). In this mouse, the stiffer tumor region (C, asterisk) partially coincides with intense green immunofluorescence (B, F) marking blood vessels.
The stiffer area (green ROI in Figure 3A, C, E) showed cells of similar morphological characteristics and identical H&E staining properties as the remaining tumor. Additional divergent characteristics between the animals could be observed on the immunofluorescent stainings. In one animal, the density of viable tumor cells (mCherry protein expressed by tumor cells depicted in red in Figure 6E) was higher than in the adjacent tumor region. A second animal however presented with an increased number of vessels in the stiffer region (stained green in Figure 7F), while the density of viable tumor cells did not appear to be different (endogenous mCherry protein depicted in red, Figure 7B and E). Note that the location of different histological features shown in the blood vessel density map of Figure 7F does not correspond exactly to the locations of different stiffness in the MRE map (Figure 7C). Hence it is certainly possible that the MRE parameters are additionally influenced by another structure that is not identified with the histology stains used. The stiffer tumor sub-region in the third animal was on a cortical boundary and was lost during histological preparation. Therefore, we could not evaluate the histological features for this case.
4. Discussion
Intracranial malignancies have so far been observed to be softer than healthy brain parenchyma. This has been shown in several studies investigating brain tumors in both human patients7,8,17 and animal models16,22. Our results substantially corroborate these findings, with the notable exception for heterogeneity as discussed below. Our data show significantly reduced viscoelastic modulus, shear wave speed and phase angle in central tumors compared to healthy brain tissue. Moreover, Feng et al. observed a progressive softening of intracranially implanted GBM22 in mice. Despite using a different tumor cell line from Feng et al., their findings are consistent with our measurement of the change in MRE parameters with tumor progression. Viscoelastic modulus, shear wave speed and phase angle significantly decreased from week 2 to week 4 after tumor implantation.
Streitberger et al. observed high biomechanical heterogeneity in patients with GBM and hypothesized that this might be caused by variable tumor composition17. Our findings are not inconsistent with this hypothesis. We identified tumor sub-regions on elastograms of the viscoelastic modulus and shear wave speed that indeed differed in their histopathological appearance from the central tumor, but those differences were inconsistent from case to case. In one case, a higher density of viable tumor cells, and in another case, slightly elevated micro-vessel density, corresponded to regions that demonstrated elevated stiffness when compared to adjacent areas with hemorrhagic spots and areas consistent with necrosis. This finding may be considered in light of the results of Jamin et al., who compared the biomechanical properties of three intracranially implanted tumor types in mice16. They showed that cellular and micro-vessel density contributed to relative tumor stiffness and hence rendered the different tumors distinguishable based on their biomechanical properties16. Interestingly, the phase angle was not significantly different between the two sub-regions identified. This might hint at the conclusion that the phase angle is a structural parameter characterizing the tumor independent from cellular and micro-vessel density. Further studies in a larger cohort and different cell lines are needed to clarify the histopathological features reflected by the phase angle.
MRE seems to capture the degree of microstructural integrity of tissues23. Highly organized white matter tracts with densely packed layers of myelin surrounding large axons such as the corpus callosum are significantly stiffer than overall white or gray matter24. Furthermore, demyelination and degradation of the extracellular matrix structure lead to a decrease of stiffness25. When applying these findings to our results, it is not surprising that MRE parameters depict regional differences in tumor composition. The microstructural integrity is heavily affected in tumor regions with hemorrhage and necrosis next to patches of viable tumor cells. Moreover, necrosis in the brain leads to a liquefaction of the tissue, rendering the necrotic area viscous and liquid26. This is reflected by a significant decrease of viscoelastic modulus and shear wave speed in partially necrotic tumor sub-regions. In contrast, MRE parameters are increased in sub-regions consisting mainly of densely packed viable tumor cells and/or blood vessels, in which the mechanical network remains comparatively intact.
One technical limitation of our approach leads to a bias toward softer viscoelastic modulus estimates near the boundary of the region of interest. This limits our ability to conclusively track changes of viscoelastic modulus in tissues near the skull. Further limitations of our study design include the small sample size and use of only one tumor cell line. This led to a predominantly observational analysis, particularly regarding the comparison of imaging data with histopathology. Additionally, a comparative approach had to be used for the analysis of longitudinal changes in stiffness, shear wave speed and phase angle as different group sizes at several time points hindered statistical testing. Hence, it was not possible to establish explicit histopathological correlates of MRE parameters. Further studies using different cell lines and a larger group size are needed to confirm our data. Eventually, the transferability of animal models to patients should be tested.
In conclusion, we demonstrated that MRE can show longitudinal and morphological differences of GBM, which could not be as easily detected with conventional T2w imaging. Given this, MRE may prove to be a valuable tool for tumor characterization in patients complementing existing MRI techniques.
Acknowledgements
The authors thank Dr. Charles Guttmann for valuable discussions.
We acknowledge grant support from NIH R21 EB020757, from European Commission Horizon 2020 proposal 668039, from Boston University College of Engineering and the Brigham and Women’s Hospital Department of Radiology. K.S. received funding from the German Research Foundation (DFG, SCHR 1542/1–1).
List of abbreviations
- CSF
cerebrospinal fluid
- DTI
diffusion tensor imaging
- DWI
diffusion weighted imaging
- FLAIR,
fluid-attenuated inversion recovery
- GBM
glioblastoma
- MRE
Magnetic Resonance Elastography
- MRI
Magnetic Resonance Imaging
- PFA
paraformaldehyde
- ROI
region of interest
- SD
standard deviation
- T1w
T1-weighted
- T2w
T2-weighted
References
- 1.Ostrom QT, Gittleman H, Fulop J, Liu M, Blanda R, Kromer C, Wolinsky Y, Kruchko C, Barnholtz-Sloan JS. CBTRUS Statistical Report: Primary Brain and Central Nervous System Tumors Diagnosed in the United States in 2008–2012. Neuro-Oncol. 2015;17 Suppl 4:iv1–iv62. doi: 10.1093/neuonc/nov189. [DOI] [PMC free article] [PubMed] [Google Scholar]
- 2.Brandes AA, Tosoni A, Franceschi E, Reni M, Gatta G, Vecht C. Glioblastoma in adults. Crit Rev Oncol Hematol. 2008;67(2):139–152. doi: 10.1016/j.critrevonc.2008.02.005. [DOI] [PubMed] [Google Scholar]
- 3.Essig M, Anzalone N, Combs SE, Dörfler À, Lee S-K, Picozzi P, Rovira A, Weller M, Law M. MR imaging of neoplastic central nervous system lesions: review and recommendations for current practice. AJNR Am J Neuroradiol. 2012;33(5):803–817. doi: 10.3174/ajnr.A2640. [DOI] [PMC free article] [PubMed] [Google Scholar]
- 4.Wen PY, Macdonald DR, Reardon DA, Cloughesy TF, Sorensen AG, Galanis E, DeGroot J, Wick W, Gilbert MR, Lassman AB, Tsien C, Mikkelsen T, Wong ET, Chamberlain MC, Stupp R, Lamborn KR, Vogelbaum MA, van den Bent MJ, Chang SM. Updated Response Assessment Criteria for High-Grade Gliomas: Response Assessment in Neuro-Oncology Working Group. J Clin Oncol. 2010;28(11):1963–1972. doi: 10.1200/JCO.2009.26.3541. [DOI] [PubMed] [Google Scholar]
- 5.Pope WB, Djoukhadar I, Jackson A. Neuroimaging. Handb Clin Neurol. 2016;134:27–50. doi: 10.1016/B978-0-12-802997-8.00003-7. [DOI] [PubMed] [Google Scholar]
- 6.Xu L, Lin Y, Han JC, Xi ZN, Shen H, Gao PY. Magnetic resonance elastography of brain tumors: preliminary results. Acta Radiol. 2007;48(3):327–330. doi: 10.1080/02841850701199967. [DOI] [PubMed] [Google Scholar]
- 7.Simon M, Guo J, Papazoglou S, Scholand-Engler H, Erdmann C, Melchert U, Bonsanto M, Braun J, Petersen D, I Sack, Wuerfel J. Non-invasive characterization of intracranial tumors by magnetic resonance elastography. New J Phys. 2013;15(8):085024. doi: 10.1088/1367-2630/15/8/085024. [DOI] [Google Scholar]
- 8.Reiss-Zimmermann M, Streitberger K-J, Sack I, Braun J, Arlt F, Fritzsch D, Hoffmann K-T. High Resolution Imaging of Viscoelastic Properties of Intracranial Tumours by Multi-Frequency Magnetic Resonance Elastography. Clin Neuroradiol. 2015;25(4):371–378. doi: 10.1007/s00062-014-0311-9. [DOI] [PubMed] [Google Scholar]
- 9.Muthupillai R, Ehman RL. Magnetic resonance elastography. Nat Med. 1996;2(5):601–603. [DOI] [PubMed] [Google Scholar]
- 10.Sinkus R, Tanter M, Xydeas T, Catheline S, Bercoff J, Fink M. Viscoelastic shear properties of in vivo breast lesions measured by MR elastography. Magn Reson Imaging. 2005;23(2):159–165. doi: 10.1016/j.mri.2004.11.060. [DOI] [PubMed] [Google Scholar]
- 11.Mariappan YK, Glaser KJ, Ehman RL. Magnetic resonance elastography: a review. Clin Anat. 2010;23(5):497–511. doi: 10.1002/ca.21006. [DOI] [PMC free article] [PubMed] [Google Scholar]
- 12.Litwiller DV, Mariappan YK, Ehman RL. Magnetic Resonance Elastography. Curr Med Imaging Rev. 2012;8(1):46–55. doi: 10.2174/157340512799220562. [DOI] [PMC free article] [PubMed] [Google Scholar]
- 13.Murphy MC, Huston J 3rd, Glaser KJ, Manduca A, Meyer FB, Lanzino G, Morris JM, Felmlee JP, Ehman RL. Preoperative assessment of meningioma stiffness using magnetic resonance elastography. J Neurosurg. 2013;118(3):643–648. doi: 10.3171/2012.9.JNS12519. [DOI] [PMC free article] [PubMed] [Google Scholar]
- 14.Hughes JD, Fattahi N, Van Gompel J, Arani A, Meyer F, Lanzino G, Link MJ, Ehman R, Huston J. Higher-Resolution Magnetic Resonance Elastography in Meningiomas to Determine Intratumoral Consistency. Neurosurgery. 2015;77(4):653–658; discussion 658–659. doi: 10.1227/NEU.0000000000000892. [DOI] [PMC free article] [PubMed] [Google Scholar]
- 15.Sakai N, Takehara Y, Yamashita S, Ohishi N, Kawaji H, Sameshima T, Baba S, Sakahara H, Namba H. Shear Stiffness of 4 Common Intracranial Tumors Measured Using MR Elastography: Comparison with Intraoperative Consistency Grading. AJNR Am J Neuroradiol. June 2016. doi: 10.3174/ajnr.A4832. [DOI] [PMC free article] [PubMed] [Google Scholar]
- 16.Jamin Y, Boult JKR, Li J, Popov S, Garteiser P, Ulloa JL, Cummings C, Box G, Eccles SA, Jones C, Waterton JC, Bamber JC, Sinkus R, Robinson SP. Exploring the biomechanical properties of brain malignancies and their pathologic determinants in vivo with magnetic resonance elastography. Cancer Res. 2015;75(7):1216–1224. doi: 10.1158/0008-5472.CAN-14-1997. [DOI] [PMC free article] [PubMed] [Google Scholar]
- 17.Streitberger K-J, Reiss-Zimmermann M, Freimann FB, Bayerl S, Guo J, Arlt F, Wuerfel J, Braun J, Hoffmann K-T, Sack I. High-resolution mechanical imaging of glioblastoma by multifrequency magnetic resonance elastography. PloS One. 2014;9(10):e110588. doi: 10.1371/journal.pone.0110588. [DOI] [PMC free article] [PubMed] [Google Scholar]
- 18.Mao P, Joshi K, Li J, Kim S-H, Li P, Santana-Santos L, Luthra S, Chandran UR, Benos PV, Smith L, Wang M, Hu B, Cheng S-Y, Sobol RW, Nakano I. Mesenchymal glioma stem cells are maintained by activated glycolytic metabolism involving aldehyde dehydrogenase 1A3. Proc Natl Acad Sci U S A. 2013;110(21):8644–8649. doi: 10.1073/pnas.1221478110. [DOI] [PMC free article] [PubMed] [Google Scholar]
- 19.Williams SP, Nowicki MO, Liu F, Press R, Godlewski J, Abdel-Rasoul M, Kaur B, Fernandez SA, Chiocca EA, Lawler SE. Indirubins decrease glioma invasion by blocking migratory phenotypes in both the tumor and stromal endothelial cell compartments. Cancer Res. 2011;71(16):5374–5380. doi: 10.1158/0008-5472.CAN-10-3026. [DOI] [PMC free article] [PubMed] [Google Scholar]
- 20.Garteiser P, Sahebjavaher RS, Ter Beek LC, Salcudean S, Vilgrain V, Van Beers BE, Sinkus R. Rapid acquisition of multifrequency, multislice and multidirectional MR elastography data with a fractionally encoded gradient echo sequence. NMR Biomed. May 2013. doi: 10.1002/nbm.2958. [DOI] [PubMed] [Google Scholar]
- 21.Green MA, Bilston LE, Sinkus R. In vivo brain viscoelastic properties measured by magnetic resonance elastography. NMR Biomed. 2008;21(7):755–764. doi: 10.1002/nbm.1254. [DOI] [PubMed] [Google Scholar]
- 22.Feng Y, Clayton EH, Okamoto RJ, Engelbach J, Bayly PV, Garbow JR. A longitudinal magnetic resonance elastography study of murine brain tumors following radiation therapy. Phys Med Biol. 2016;61(16):6121–6131. doi: 10.1088/0031-9155/61/16/6121. [DOI] [PMC free article] [PubMed] [Google Scholar]
- 23.Sack I, Jöhrens K, Würfel J, Braun J. Structure-sensitive elastography: on the viscoelastic powerlaw behavior of in vivo human tissue in health and disease. Soft Matter. 2013;9(24):5672–5680. doi: 10.1039/C3SM50552A. [DOI] [Google Scholar]
- 24.Johnson CL, McGarry MD, Gharibans AA, Weaver JB, Paulsen KD, Wang H, Olivero WC, Sutton BP, Georgiadis JG. Local mechanical properties of white matter structures in the human brain. NeuroImage. 2013;79:145–152. doi: 10.1016/j.neuroimage.2013.04.089. [DOI] [PMC free article] [PubMed] [Google Scholar]
- 25.Schregel K, Wuerfel E, Garteiser P, Gemeinhardt I, Prozorovski T, Aktas O, Merz H, Petersen D, Wuerfel J, Sinkus R. Demyelination reduces brain parenchymal stiffness quantified in vivo by magnetic resonance elastography. Proc Natl Acad Sci U S A. 2012;109(17):6650–6655. doi: 10.1073/pnas.1200151109. [DOI] [PMC free article] [PubMed] [Google Scholar]
- 26.Kumar V, Abbas AK, Aster JC, eds. Robbins and Cotran Pathologic Basis of Disease. Ninth edition Philadelphia, PA: Elsevier/Saunders; 2015. https://www-clinicalkey-com.ezp-prod1.hul.harvard.edu/#!/browse/book/3-s2.0-C20110055734. Accessed March 28, 2017. [Google Scholar]


