

Abstract
The interaction between RNA‐binding proteins (RBPs) and RNA plays an important role in regulating cellular function. However, decoding genome‐wide protein–RNA regulatory networks as well as how cancer‐related mutations impair RNA regulatory activities in hepatocellular carcinoma (HCC) remains mostly undetermined. We explored the genetic alteration patterns of RBPs and found that deleterious mutations are likely to occur on the surface of RBPs. We then constructed protein–RNA interactome networks by integration of target binding screens and expression profiles. Network analysis highlights regulatory principles among interacting RBPs. In addition, somatic mutations selectively target functionally important genes (cancer genes, core fitness genes, or conserved genes) and perturb the RBP–gene regulatory networks in cancer. These regulatory patterns were further validated using independent data. A computational method (Mutational Effect on RNA Interactome Topology) and a web‐based, user‐friendly resource were further proposed to analyze the RBP–gene regulatory networks across cancer types. Pan‐cancer analysis also suggests that cancer cells selectively target “vulnerability” genes to perturb protein–RNA interactome that is involved in cancer hallmark–related functions. Specifically, we experimentally validated four pairs of RBP–gene interactions perturbed by mutations in HCC, which play critical roles in cell proliferation. Based on the expression of perturbed RBP and target genes, we identified three subtypes of HCC with different survival rates. Conclusion: Our results provide a valuable resource for characterizing somatic mutation‐perturbed protein–RNA regulatory networks in HCC, yielding valuable insights into the genotype–phenotype relationships underlying human cancer, and potential biomarkers for precision medicine.
Abbreviations
- CEP55
centrosomal protein 55
- eCLIP
enhanced CLIP
- FDR
false discovery rate
- HNRNPF
heterogeneous nuclear ribonucleoprotein F
- lincRNA
long intergenic noncoding RNA
- LIMT
lncRNA‐inhibiting metastasis
- MERIT
Mutational Effect on RNA Interactome Topology
- PRI
protein–RNA interaction
- RACGAP1
Rac GTPase activating protein 1
- RBP
RNA binding protein
- SART3
squamous cell carcinoma antigen recognized by T cells 3
- shRNA
short hairpin RNA
Hepatocellular carcinoma (HCC) is one of the most aggressive human cancer types, associated with dismal clinical outcomes. Numerous studies have been carried out to elucidate molecular mechanisms of HCC, and dysregulation of multiple RNAs have been reported to be involved in the development of HCC.1, 2 However, RNAs do not function in isolation but interact with other biological molecules (such as RNA binding proteins) in regulatory interactome networks in the cell. RNAs and their interacting protein partners can form distinct, highly dynamic ribonucleoprotein particles, which comprise the basic unit for gene expression regulation. Functional defects in RNA molecules can disrupt protein–RNA interaction (PRI) networks and cause various types of human diseases, such as cancer.3, 4 RNA binding proteins (RBPs) have been identified as key regulatory components that control the fate of nearly every RNA transcript in a cell. Due to the critical role of RBPs in regulating gene expression, mutations in RBP genes or their targets have been implicated as an important factor involved in human cancer progression.5, 6
In the past decade, a large number of somatic variants have been identified in various positions in the cancer genomes, including mutations in RBPs and RNAs.7, 8, 9 However, many fundamental questions regarding genotype–phenotype relationships engendered by these mutations remain unresolved. Most previous studies modeled genotype–phenotype relationships based on the assumption that driver mutations lead to complete loss of protein function through radical changes, such as protein instability or misfolding. However, it has been increasingly appreciated that many driver mutations could act to perturb molecular interactions important for cellular functions.10, 11, 12 We previously reported that a considerable fraction of driver disease mutations caused protein–protein interaction‐specific or “edgetic” perturbations.13 Based on the functional significance of protein–RNA regulatory interactome networks, mutations that disrupt either the RBPs or target RNAs might perturb the interactions among RBPs and RNAs as well as their protein products. These mutations could be deleterious to gene expression regulation and contributing to initiation or progression of various types of cancer. However, it is unclear to what extent protein–RNA interaction perturbations are involved in HCC development. Furthermore, how do patient‐specific mutations in RBPs or target genes contribute to the rewiring of protein–RNA regulatory networks and aberrant signal transduction? What are the driver mutations that cause protein–RNA interactome perturbations? To start addressing these questions, here we conducted a comprehensive study to systematically assess the functional impact of patient‐specific somatic mutations that resulted in distinct protein–RNA interactome network perturbations.
In this work, we first characterized widespread genetic alterations of RBPs in HCC and further constructed genome‐wide protein–RNA regulatory interactome networks by integration of target binding screens and expression profiling. Network analysis revealed regulatory principles among interacting RBPs and somatic mutations selectively targeted central genes in RBP–gene regulatory networks. Widespread mutation‐mediated network rewiring in HCC was revealed, with perturbed genes being primarily involved in cell adhesion and cell proliferation. We validated the RBP regulatory networks in HCC based on predicted RBP–gene networks and extended these analyses to pan‐cancer. Four pairs of RBP–gene interactions perturbed by mutations, which play critical roles in cell proliferation, were further experimentally validated. Moreover, three subtypes of HCC were identified based on the profiles of perturbed RBP–RNA regulatory networks, which exhibited distinct survival rates. Taken together, we provide evidence for widespread protein–RNA interactome perturbations in liver cancer, and our results suggest that network perturbation analysis helps distinguish driver mutations from passenger variants in RNA signaling networks (Fig. 1A).
Figure 1.

Genomic mutation landscape of RBP genes in HCC. (A) Protein–RNA interactome network perturbations may underlie genotype–phenotype relationships in cancer. (B) The RNA‐seq expression levels and the expression variances of RBP genes in HCC. Green color, RBP genes; gray color, other genes. (C) The number of samples with distinct number of RBP mutations. The barplot shows the number of samples with RBP mutations. The pie chart shows the distribution of samples with/without RBP mutations. (D) Distribution of functional impact scores of mutations in RBPs and other genes, predicted by CADD, and distribution of evolutionary conservation indices of the mutated residue positions in RBPs versus other genes. (E) Number of mutations located on the surface of RBP protein structures. The barplot shows the frequency of randomly selected mutations that are located on the protein surface. The red dot marks the number of mutations on the RBP surface. P value is computed by comparing against 10,000 random samplings from the proteome space by chance. P values in B and D are computed by Wilcox rank sum test. Abbreviation: CADD, Combined Annotation Dependent Depletion. * * *P < 0.001.
Materials and Methods
Construction of RBP–RNA Regulatory Network in HCC
To identify RBP–RNA interactions in HCC, we integrated enhanced CLIP (eCLIP) sequencing datasets with short hairpin RNA (shRNA)‐seq datasets in HepG2 cell line.14 In total, 136 eCLIP‐seq datasets for 68 diverse RBPs and 450 shRNA‐seq experiment datasets for 225 diverse RBPs in HepG2 cell line were integrated. Moreover, 10 normal RNA‐seq datasets for HepG2 were also downloaded. Gene expression was measured by fragments per kilobase of transcript per million mapped reads. The RBP–RNA regulatory network in HCC was constructed by assembling all the RBP–gene pairs that harbored potential binding sites and exhibited gene expression correlations (see details in Supporting Methods).
Proliferation Quantification
HEK293T cells were labeled with CellTrace Far Red (Invitrogen) per manufacturer’s instructions. Labeled cells were plated in 24‐well plates at 1 × 10⁵ cells/well and immediately transfected with desired plasmids containing green fluorescent protein (GFP)‐tagged wild‐type RNA, mutant RNA, or empty GFP vector with Lipofectamine 3000 per manufacturer’s instructions. The following day, medium was changed to serum‐free Dulbecco’s modified Eagle’s medium and cells were cultured for 48 hours. For liver cancer cell lines, HepG2 and SNU‐449 unlabeled cells were plated in serum‐containing media, transfected the following day using X‐tremeGENE HP DNA transfection reagent (Sigma) per manufacturer’s instructions, and then labeled 24 hours thereafter before transitioning to serum‐free Roswell Park Memorial Institute 1640 medium.
RNA Immunoprecipitation
FLAG‐tagged RNA binding proteins or empty FLAG control were cotransfected with either wild‐type or mutant putative target RNAs into HEK293T cells with Lipofectamine 3000 or liver cancer cell lines with X‐tremeGENE HP. RNA immunoprecipitation was then performed as previously described with minor modifications.15, 16
Statistical Analysis and Network Visualization
All statistical analyses were performed by R language 3.3.1. The violin plots were plotted by “vioplot” package in R. Survival analyses were based on the “NMF” package in R. Circos plot was performed by circos‐0.69‐3.17 Networks were visualized by Cytoscape 3.4. Other details for the methods are provided in the Supporting Methods.
Results
Widespread Genetic Alterations of RBPS in HCC
To compare and understand the differences in gene expression dynamics between RBPs and other genes in liver tissues, we first obtained a set of 1,350 genes coding for RNA binding proteins across the human genome (Supporting Table S3). Based on the genome‐wide expression profiles of 374 liver cancer and 50 normal samples, we found that RBPs were significantly more highly expressed (Fig. 1B) than other protein‐coding genes in liver cancer. Closer inspection of the variation also revealed that RBPs exhibited significantly lower variation in expression levels (Fig. 1B) than other coding genes. In addition, we investigated the expression of RBPs across normal tissues from the Genotype‐Tissue Expression and The Human Protein Atlas projects18, 19 and found that RBPs also showed stable and high expression levels (Supporting Fig. S1). These observations suggest that RBPs are with stabilized high expression across tissues, consistent with a central role in regulating gene expression.
To further define the extent to which RBPs are dysregulated in HCC, we analyzed the functional impact of RBP mutations in HCC. We found that 97% of HCC samples harbored at least one RBP mutation (Fig. 1C). Most tumors had only a few RBP mutations per sample, whereas other tumors had more than 10 RBP mutations each. To survey if somatic mutations located in RBPs had functional impact, we calculated the Combined Annotation Dependent Depletion scores and the conservation index of the amino acid position for each mutation.13 We found that somatic mutations in RBPs were likely to be deleterious and to occur in more evolutionarily conserved residue positions (Fig. 1D) as compared with randomly selected mutations. These results indicate that RBP genes exhibit frequent genetic alterations with possible functional impact in HCC.
In principle, somatic mutations may disrupt the overall structure of the corresponding protein, or alternatively exert specific effects on particular molecular interactions.12, 20, 21 To evaluate whether and how cancer mutations affect the binding of RBPs to their targets, we systematically explored the localization of somatic mutations on the three‐dimensional protein structures of RBPs. As a result, we found that 498 (63.4%; Fig. 1E) of the mutations were likely to locate on the surface of RBPs, a fraction that was significantly higher than that of randomly selected mutations (P < 0.001, random test). Moreover, we extended these analyses to 32 other cancer types and obtained similar results in mutations and gene expression as HCC (Supporting Fig. 2A,B). These results thereby highlight the fundamental roles of RBPs and potential relevance of somatic mutations in shaping the function of RBPs in cancer.
High‐Resolution Deconvolution of Protein–RNA Regulatory Networks in HCC
To further understand how RBPs are associated with their target genes, we constructed comprehensive PRI networks in HCC by integrating 136 e‐CLIP14 and 450 shRNA high throughput sequencing datasets (Fig. 2A). All of the RBP binding peaks were mapped to 58,037 genes (coding and noncoding) with approximately 580,000 interactions among 68 RBPs and 26,391 genes identified. Lines of evidence have indicated that RBP binding to RNAs might result in expression alterations.22, 23 We next integrated the RBP knockdown datasets to identify the context‐specific RBP–gene regulatory events. More than 754,000 interactions among 220 RBPs and 12,272 genes were identified. Integrating the eCLIP‐seq and shRNA datasets, we identified 103,967 interactions among 65 RBPs and 8,691 genes in the HepG2 cell line (Fig. 2A; Supporting Table S4). The majority (87%) of target genes represented protein coding genes, whereas approximately 3% were long intergenic noncoding RNAs (lincRNAs), suggesting that RBPs might play a role in regulating lincRNA expression (Fig. 2B).
Figure 2.

Global RBP–gene regulatory networks in HCC. (A) The flowchart for identifying RBP–gene regulatory networks by integration of eCLIP‐seq and shRNA datasets. First, eCLIP‐seq peaks were mapped to genome and genes with binding sites were identified. Second, RBP knockdown gene expression data sets were analyzed and genes with 2‐fold expression alterations were identified as RBP candidate targets. Global RBP–gene regulatory networks were constructed by intersection of genes with binding sites and expression alterations. (B) The left pie shows the proportion of different types of genes targeted by RBPs, and the right pie shows the proportion of different types of RBP–gene interactions in HCC. (C) The density of RBP–RBP pairs as a function of the number of their coregulated target genes. The gray bars show the distribution for randomly perturbed RBP–gene regulation, whereas the blue bars show the distribution for the real condition. (D) The number of coregulated target genes for interacting RBP pairs versus noninteracting pairs. P value is computed by Wilcox rank sum test.
RBPs were thought to control a large set of target genes through coregulation,24, 25, 26 in which multiple RBPs work together to control individual target genes. We observed that about 82.1% genes were targeted by multiple RBPs (Supporting Fig. S3), suggesting widespread coregulation of RBPs. Next, we computed the number of coregulated target genes for each pair of RBPs and found that the RBPs coregulated significantly more target genes than randomly selected genes (Fig. 2C; P < 0.001). We then sought to hypothesize the biological constraints behind the synergetic regulation of RBPs might largely be due to interacting RBPs of the same complex. To test this hypothesis, we overlapped the RBP–gene interactions in our networks with the experimentally derived binary protein–protein interaction networks.27 We found that interacting RBPs significantly coregulated more target genes (Fig. 2D; P = 0.003). These results demonstrate that coregulation of RBPs might largely be due to interacting RBPs of the same complex.
Somatic Mutations Selectively Target Vulnerability Points in PRI Networks in HCC
It is increasingly appreciated that perturbations of complex cellular networks are likely to underlie most genotype–phenotype relationships, including those mutations related to the pathogenesis of cancer. Our above analysis revealed that mutations in RBPs were likely to locate on the surface of RBPs (Fig. 1E). Next, we investigated whether these mutations might perturb the interactions between RBPs and target genes. We first compared the gene expression fold changes of samples with RBP mutations versus without mutations. We found that the targets of RBPs were more likely to be differentially expressed in RBP mutated samples (Supporting Fig. S4), suggesting that RBP mutations might influence target gene expression through altering RBP‐target binding. Cancer cells could selectively perturb functionally important RBPs, which might further change interactions among RBPs and target genes. Next, we investigated the extent to which mutations in target genes might perturb the RBP regulation. We identified 2,164 mutations that were located in the RBP binding sites (Fig. 3A). In addition, we randomly selected the same number of genomic regions as pseudo‐binding sites. We found that target gene mutations were significantly enriched in RBP binding sites (P < 0.01).
Figure 3.
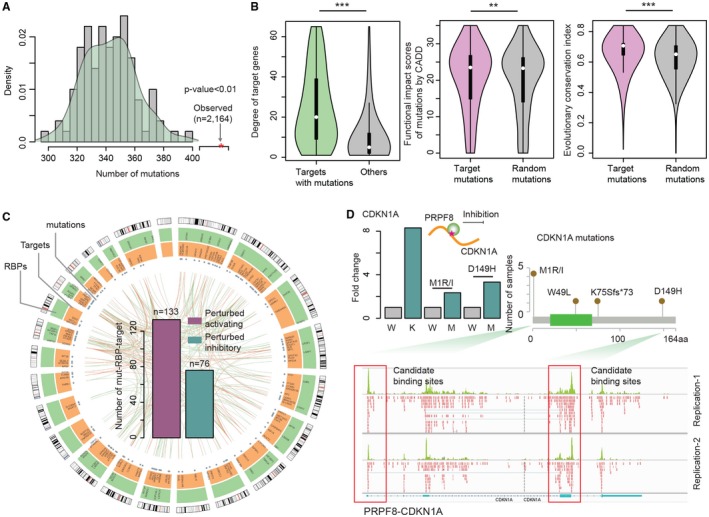
Somatic mutation‐mediated RBP–gene regulatory network rewiring in HCC. (A) Number of mutations located in RBP binding sites versus random genomic regions. The barplot shows the distribution of the number of mutations located in randomly selected genomic regions. The red star indicates the real number of mutations located in the binding sites of RBPs. (B) Number of RBP regulators for target genes with/without mutations in binding sites. Distribution of functional impact scores of mutations by CADD and evolutionary conservation indices of the mutated residue positions, respectively. (C) Circos plot shows the perturbed RBP–gene regulatory networks by somatic mutations. The inner circle shows the perturbed RBP–gene regulatory events. Purple, perturbed activation; green, perturbed inhibition. The blue dots mark the genomic locations of somatic mutations; the orange circle shows the locations of target genes; and the green circle shows the location of RBPs. (D) The fold‐change in expression levels of the target gene CDKN1A in RBP knockdown cells and cells that harbor RBP binding site mutations. The eCLIP‐seq read distribution around CDKN1A genomic loci and two binding sites of PRPF8 are marked by rectangles. Abbreviations: K, the RBP gene PRPF8 knockdown; M, somatic mutations in the target gene CDKN1A; W, wild‐type condition.
Highly connected proteins in protein interaction networks were previously found to be, on average, more essential.28 First, we calculated the number of target genes interacting with mutated RBPs or wild‐type RBPs. We found that the number of target genes for mutated and wild‐type RBPs was similar. Next, we compared the number of RBPs that bound to target genes with binding site mutations versus other target genes. We found that genes with binding site mutations were likely to be bound by more RBPs (Fig. 3B), suggesting that HCC mutations were likely to selectively target vulnerability points in PRI networks. Moreover, we observed that the mutations located in RBP binding sites were predicted to exhibit higher functional impact scores (Fig. 3B; Supporting Fig. S5; P = 0.014) and higher conservation index (Fig. 3B; Supporting Fig. S5) than randomly selected mutations. These results suggested the critical roles of somatic mutations in RBP binding sites. To investigate the function of the mutated target genes, we then performed functional enrichment analysis and found that mutated target genes were significantly enriched in cancer‐related pathways, including p53 signaling pathway, cell cycle, and FoxO signaling pathway (Supporting Fig. S6). Taken together, these results highlight the critical roles of mutations located in the binding sites of RBPs, and it would be necessary to determine the consequence of mutation‐mediated perturbations in the context of PRI interactome networks.
Somatic Mutation‐Mediated Pri Interactome Network Rewiring in HCC
To identify which protein–RNA interactions were perturbed in cancer, we integrated our genome‐wide PRI interactome networks with somatic mutation and gene expression profiles. Our hypothesis was that the expression of target genes might be altered in mutated samples compared with normal controls if the somatic mutations perturbed the binding of RBPs. In total, 204 somatic mutations were identified, which perturbed 209 interactions among 47 RBPs and 176 target genes (Fig. 3C). There were 63.6% (133/209) positively regulatory interactions and 36.4% (76/209) negatively regulatory interactions perturbed in HCC.
Identifying somatic mutation‐altered RBP–gene interactions also revealed some critical cancer‐related genes. For instance, as an inhibitor of cellular proliferation in response to DNA damage, CDKN1A had been demonstrated to play key roles in cancer.29 Here, we identified two mutations in the CDKN1A gene (M1R/I and D149H) that were likely to reduce the inhibition of the corresponding RBP PRPF8 (Fig. 3D). CDKN1A showed more than 8‐fold increase in expression levels upon knockdown of its RBP gene PRPF8, suggesting that PRPF8 binding might inhibit the expression of CDKN1A. Among the four mutations in CDKN1A, we found that two mutations were located in the PRPF8 binding region, suggesting that these mutations might disrupt the binding of this RBP. Comparing the CDKN1A expression levels in mutated samples with those in wild‐type samples, we found that the mutated samples showed increased expression (Fig. 3D; larger than 2‐fold changes in expression). These results suggest that the disruption of RBP binding by somatic mutations could play a role in regulating the expression of cancer target genes. Taken together, all these results validate the mutation‐mediated network rewiring in cancer and highlight the role of somatic mutations in rewiring PRI networks.
Validation of Mutation‐Mediated PRI Perturbations and Extension to PAN‐Cancer
To validate the above results for mutation‐mediated RBP regulatory network perturbations, we analyzed other independent RBP‐regulatory networks in HCC. The integration of high‐throughput eCLIP‐seq and shRNA‐seq data had demonstrated great power for investigating the PRI alterations in cancer. However, such analysis might be blocked by the limited number of available data sets across cancer types. Thus, we proposed a three‐step computational method (Mutational Effect on RNA Interactome Topology [MERIT]), which was based on the regulatory principles summarized from the eCLIP‐seq and shRNA‐seq data analysis, to systematically identify candidate driver mutations in cancer (Supporting Fig. S7; Supporting Methods). First, we retrieved 1,198 motifs of 160 RBPs and used Find Individual Motif Occurrences to screen 15,429 gene sequences to discover potential binding sites.30 At the P value < 1.0e‐4, we obtained 751,539 correlations among 125 RBPs and 15,429 protein coding genes. We hypothesized that the expression of RBPs were correlated with their target genes if the regulation was active in a specific context.31 Thus, we integrated genome‐wide gene expression profiles across cancer samples and calculated the expression correlation coefficients between RBPs and potential target genes. We determined the false discovery rate (FDR) by identifying 55,223 interactions among 124 RBPs and 12,515 genes (FDR < 0.001), and we observed a significant overlap with those identified by eCLIP‐seq data (Supporting Fig. S8). In addition, about 66.3% of the RBP–gene interactions inferred from gene expression profiles showed regulatory patterns consistent with those from shRNA datasets, which was significantly more than the proportion of inconsistent ones (P < 0.001, Fisher’s exact test). Moreover, if two RBPs interact with each other in protein–protein interaction networks, their target regulatory similarity was higher (Supporting Fig. S9). These results not only validated the observations obtained from eCLIP‐seq data but also demonstrated the proposed computational method could capture functional PRIs in liver cancer.
Next, we extended the analysis to Pan‐cancer and observed that the RBP regulatory networks showed great variations across cancer types (Supporting Fig. S10). Despite their inherent diversity, we found that cancer types with similar tissue origins showed higher similarity in PRI regulatory network profiles (Supporting Fig. S10). Through analysis of these PRIs across cancer types, we found that synergistic regulation of RBPs might largely be due to interacting RBPs of the same complex (Supporting Fig. S10). Most of the RBP pairs belonged to the families of splicing factors and hnRNPs (Fig. 4A).
Figure 4.

Validation of somatic mutation‐mediated RBP–gene regulatory network rewiring. (A) RBP–RBP coregulation networks in cancer. The splicing factor family is marked with the orange circle, and the hnRNP family is marked with the green circle. (B) Functional enrichment of the RBP target genes with binding site mutations. Each row indicates a cancer hallmark–related GO term, and each column indicates a type of cancer. The top barplot shows the number of GO terms enriched in each cancer, and the right barplot shows the number of cancer types each GO term is enriched in. Bigger dots indicate smaller P values (hypergeometric test). Abbreviation: GO, gene ontology.
To investigate whether these target genes with binding site mutations were likely to play a role in cancer, we found that mutated target genes were likely to be significantly highly expressed and with lower expression variations, and that the mutation positions in RBP binding sites exhibited significantly higher evolutionary conservation (Supporting Fig. S11). To investigate the function of the mutated target genes, we performed functional enrichment analysis and found that mutated target genes were significantly enriched in cancer hallmark–related functions, including “cell adhesion” in tissue invasion and metastasis, and “DNA repair” in genome instability and mutations (Fig. 4B). Taken together, these results suggest the functional role of somatic mutations in RBP binding sites, and that cancer cells selectively target “vulnerability” genes to perturb the RBP regulation.
Perturbed RBP‐Gene Regulation Identifies HCC Subtypes with Distinct Survival Rates
HCC has been demonstrated to be one of the most heterogeneous cancers, as reflected by its multiple grades and difficulty to subtype. Next, we explored whether the expression profiles of perturbed RBP–gene targets could inform different subtypes of HCC. We applied the nonnegative matrix factorization (NMF) to the gene expression profiles of 219 genes in perturbed PRI networks of patients with cancer. With rank k from 2 to 7, NMF consistently predicted the existence of robust classes for k= 3 (Fig. 5A). Specifically, we found that the subtype C2 had a lower number of RBP/target mutations (Fig. 5B; P < 0.005) and a higher body mass index (Fig. 5C; P = 0.015). Next, we analyzed ethnic and etiological contributions in these subtypes. We found that there were more Asian patients in subtype C2, whereas the proportion of white patients was high in C1 and C3 (Supporting Fig. S12). Moreover, there was a higher proportion of patients with hepatitis C virus infection and alcohol consumption (Supporting Fig. S12). Previous studies had shown that mutation burden was correlated with immune cell infiltration in cancer. Next, we inferred the immune cell infiltration of each sample based on gene expression.32 Consistently, we found that patients in subtype C2 showed a lower macrophage infiltration but higher stromal score (Supporting Fig. S12). In addition, the patients in subtype C2 had a higher fraction of advanced‐stage tumors than other subtypes (Fig. 5D; P < 0.001). These results suggest that the perturbed PRI profiles could help identify potential biomarkers to classify HCC subtypes.
Figure 5.

RBP–gene network perturbation profiles identify HCC subtypes. (A) Similarity of HCC samples. (B) The boxplots show the number of mutated RBP/target genes in the patients of different subtypes. (C) The boxplots show the distribution of BMI for different subtypes of HCC. (D) The proportion of samples with different tumor stages in each subtype. (E) Comparative analysis of different HCC subtypes. (F) The survival curve for different subtypes of HCC patients. (G) The pathways enriched by differentially expressed genes in different subtypes of HCC. Abbreviations: BMI, body mass index; CC‐like, cholangiocarcinoma‐like subtype; HB16, 16‐gene HCC subtype; HIPPO, Hippo pathway subtype; Hoshida, HCC RNA expression profiling subtype; NCIPHS, noncirrhotic intrahepatic portal hypertension subtype; NCIP, National Cancer Institute proliferation subtype; PRI cluster, current study; RS65, 65‐gene risk score subtype; SNUR, Seoul National University recurrence subtype.
To better interpret these observations, we compared our derived HCC subtypes with those in previous studies (Fig. 5E; Supporting Methods). We found that the patients in subtype C2 exhibited similarity to nondifferentiated RNA clustering phenotypes (Hoshida C2),33 cholangiocarcinoma‐like HCC, and silencing of the Hippo pathway and had high risk scores based on a gene expression signature of 65 genes.34 This subtype was similar to the iClust1 identified by a recent study,35 which showed poor prognosis. Indeed, we found that patients in these three subtypes exhibited different survival rates (Fig. 5F; log‐rank P = 0.009). Moreover, we identified differentially expressed genes among different subtypes and performed pathway enrichment analysis to find whether distinct pathways were perturbed in these patients of different subtypes. It revealed that these subtypes exhibited distinct pathway perturbations (Fig. 5G); subtype C1 exhibited several cancer‐related pathway perturbations, such as FoxO signaling pathway, cell cycle, and metabolic pathways. In subtype C2 and C3, the most significant pathway is spliceosome, indicating that RBP–RNA regulation in these subtypes might be perturbed in alternative splicing signaling in these patients. Moreover, we found that viral infection, alcoholism, or metabolism‐related pathways were specifically enriched in subtype C1 and C3 (Fig. 5G), suggesting that the subtypes are linked with HCC etiology. Taken together, these results suggest that distinct perturbations of RBP–RNA networks generate different HCC subtypes by dysregulation of distinct pathways.
Mutations Perturbing RBP–Gene Regulation Play a Functional Role in Cell Proliferation
There are two possible modes of action for RBP–gene regulation: RBP may inhibit or activate the expression of target genes through RBP–target binding, which we term as “inhibitory” or “activating,” respectively. Next, we experimentally evaluated the functional effects of HCC‐associated mutations on RBP–gene regulation in HEK‐293T cells, as well as HepG2 and SNU‐499 liver cancer cell lines. We focused on somatic HCC mutations in target genes that we predicted to perturb PRIs, and randomly selected one such mutation in each RBP–gene regulation category (“inhibitory” or “activating”) to experimentally assess their role in cell proliferation.
Rac GTPase activating protein 1 (RACGAP1) plays a key role in controlling various cellular phenomena including cytokinesis, transformation, invasive migration, and metastasis.36 We found that RACGAP1 was significantly overexpressed in HCC, whereas the RBP regulator (heterogeneous nuclear ribonucleoprotein F [HNRNPF]) was underexpressed (Fig. 6A). The expression of HNRNPF and RACGAP1 was significantly anticorrelated (Fig. 6A), and HNRNPF knockdown resulted in increased expression of RACGAP1 (Fig. 6B). These results suggest that RACGAP1 is likely to be a target gene of the RBP HNRNPF, which possibly plays an inhibitory role in regulating RACGAP1 expression. We then cloned an HCC patient–derived RACGAP1 mutation c.1228A>T located in the RBP binding site and found this mutation significantly perturbed the interaction between HNRNPF and its RNA target RACGAP1 (Fig. 6B). In patients with HCC, high expression of RACGAP1 was correlated with poor survival (Fig. 6C; P = 0.003). Consistently, in our functional assay, we found that mutated RACGAP1 led to a significant increase in cell proliferation (Fig. 6B).
Figure 6.

Effect of mutations perturbing RBP–gene interactions in cell proliferation. (A) Boxplots show the expression of the RBP gene (HNRNPF) and target gene (RACGAP1) in paired cancer and normal samples. The bottom plot shows the correlation in expression between the RBP and target gene. (B) Validation of the mutation perturbed RBP–gene interaction in three cell lines. Left panels show the expression of RACGAP1 upon HNRNPF knockdown relative to control. Middle panels show the fold enrichment of mutated and wild‐type RACGAP1 RNAs that are bound by the RBP HNRNPF. Right panels show the relative proliferation in wild‐type and RACGAP1 mutant cells. (C) The Kaplan‐Meier plot for patients with HCC with high (red) and low expression (blue) of RACGAP1. (D‐F) Similar as A‐C for SART3 and CEP55. (G) The proposed model: Mutations in RBP binding sites perturb the inhibition or activation of target gene expression by RBPs and result in cell proliferation dysregulation in cancer.
Another example is the interaction between the RBP squamous cell carcinoma antigen recognized by T cells 3 (SART3) and its target gene centrosomal protein 55 (CEP55). Several studies have illuminated the role of CEP55 in cancer, and CEP55 overexpression has been found in various types of cancer.37 However, we are lacking knowledge about the determinants of the expression dysregulation in cancer. Based on the prediction by MERIT, we found that CEP55 expression was possibly regulated by the RBP SART3, which was also significantly overexpressed in HCC (Fig. 6D). This positive correlation in gene expression suggested that SART3 likely activates the expression of CEP55. To further support this, we found that knockdown of SART3 in cell lines significantly reduced the expression of CEP55 (Fig. 6E). In addition, MERIT predicted that CEP55 mutation in the RBP binding site would perturb the interaction between SART3 and CEP55. We thus cloned one such HCC‐derived CEP55 mutation, c.81A>T, and found that this mutation significantly reduced the interaction between SART3 and CEP55, consistent with MERIT prediction (Fig. 6E). Moreover, high expression of CEP55 was correlated with poor survival in patients with HCC (Fig. 6F; P = 0.01). In support of this, we found that the mutated CEP55 reduced cell proliferation significantly compared with wild‐type controls (Fig. 6E). These results suggest that target gene mutations in the RBP binding site significantly alter cell proliferation, possibly through PRI perturbations in HCC.
To further support the high quality of our computational predictions, we also validated another two mutations (in “inhibitory” and “activating” RBP–gene regulatory class, respectively) predicted by MERIT to perturb RBP–gene interactions in HCC (Supporting Fig. S13). The experimental results in three cell lines were consistent with MERIT predictions, suggesting that mutations that perturb the inhibition or activation of target gene expression by RBPs play a role in cell proliferation (Fig. 6G). Taken together, all these results suggest that characterizing somatic mutation‐perturbed protein–RNA regulatory networks in HCC yields valuable insights into genotype–phenotype relationships underlying human cancer and could help identify potential biomarkers for precision medicine.
A User‐Friendly Web Portal to Investigate Protein–RNA Regulatory Networks in Cancer
To facilitate researchers to apply the principles described in this work on any mutation or protein–RNA regulation of interest, we developed a comprehensive and interactive web resource (https://bio-bigdata.hrbmu.edu.cn/MERIT; Supporting Fig. S14). The features provided in the resource, which will be routinely updated, should serve as a guide for biologists interested in identifying protein–RNA regulation specificity for various applications (for example, alternative splicing and pleiotropic studies) and understanding the consequences of mutations (for example, driver mutations and neutral variants) in patients with cancer and healthy individuals.
Discussion
Great efforts have been made to identify regulatory RNAs (genes or lincRNAs) with expression alterations in HCC. However, the precise molecular mechanisms for RNA deregulation remain largely unknown. Here, we systematically characterized the PRI interactome networks as well as somatic mutation‐mediated network rewiring in HCC. We found that RBP genes were more highly expressed than other classes of genes and were likely to be mutated in cancer. These somatic mutations tended to locate on the surface of RBPs, suggesting that they might influence the binding of RBPs to their target genes. As mutation frequency is important for identifying critical mutations, we anticipate that the mutations in RBPs with higher mutation frequency might play functional roles in cancer. Mapping somatic mutations to RBP binding sites, we identified 0.29%‐49.95% of mutated target genes with mutations located in RBP binding sites across cancer types. Although the mutations were likely to be located in the middle or downstream region of the RBP binding sites, the distance between the mutations and the start sites of RBP binding sites showed a marginal trend of negative correlation with the functional impact of these mutations (R = ‐0.02; P = 2.50e‐14). This result suggests that the certain subregions of the binding sites might be more important for RBP binding, and disruption of these sequences is likely to result in perturbed RBP regulation in cancer.
To understand the roles of RNAs and RBPs in cancer, we constructed global PRI regulatory interactome networks by integrating multiple omics datasets in HCC. This work has not only revealed widespread protein‐coding RNAs that are regulated by RBPs, but also identified interesting noncoding RNA targets. We further found that somatic mutations in cancer are enriched in RBP binding sites, suggesting that somatic mutations might disturb RBP–target regulation. Based on the global protein–RNA interactome network analysis, we not only identified the RBPs and target genes perturbed by somatic mutations but also identified candidate RBP–gene edgetic perturbations in cancer. In addition, based on the regulatory principles learned from cell lines, we proposed a three‐step method (MERIT) to identify candidate driver mutations perturbing PRIs in cancer. Pan‐cancer analysis further provides insights into mutation‐mediated specific PRI perturbations. Expression analysis of these perturbed interactions also identifies three subtypes of HCC with different survival rates.
Our genome‐wide analysis has revealed 539 interactions among 65 RBPs and 59 differentially expressed lincRNAs (Supporting Fig. S15A). Moreover, we found that these differentially expressed lincRNAs were able to distinguish HCC samples from normal samples in this data set and another independent Chinese HCC data set (Supporting Fig. S15B). ENSG00000225680 is the most highly expressed lincRNA in HCC (Supporting Fig. S15C), suggesting that it might be a target for HCC therapy. Another representative example is the lincRNA LINC01089 (also known as lncRNA‐inhibiting metastasis [LIMT]), recently demonstrated as a novel metastasis inhibiting lncRNA in aggressive breast cancer.38 We observed that high expression of this lincRNA was associated with good prognosis of patients. We also found a mutation (G/C) located in the RBP binding sites of LIMT, which might disrupt the interactions between LIMT and putative RBPs. To investigate the targets of LIMT, we integrated gene expression profiling data and found that LIMT was coexpressed with genes involved in DNA replication, homologous recombination (Supporting Fig. S15D; FDR < 0.001), and immune‐related functions (Supporting Fig. S15E; FDR < 0.001). Taken together, our integrative analysis reveals potential functions of lincRNAs in PRI signaling networks.
Our results further provide a genome‐wide view on how somatic mutations mediate network rewiring in cancer, but this view is possibly incomplete. In particular, the number of available RBP motifs, eCLIP‐seq, and genetic perturbations data sets for RBPs is small compared with thousands of RBPs identified in humans. Thus, the proposed computational method (MERIT) is a useful tool to identify previously unknown functional PRIs in cancer. This computational framework has not only validated the experimental results observed in HCC but also provided insights into the RBP–gene regulatory networks across cancer types. In addition, alternative splicing (AS) is a process highly regulated by RBPs.39, 40 Integration of AS data sets will provide novel insights into our understanding of RBP regulation in cancer. The most commonly used methods for distinguishing drivers from passengers are frequency‐based methods, which quantify the significance of the mutation frequency of each gene compared with a background mutation rate.41 We also compared the mutation frequency of RBP genes and mutations in RNA binding sites with other mutations across cancer types. There are 35.7% of cancer types with higher mutation frequency in RBPs than mutations in other genes. For the mutations in binding sites of target genes, there are about 32.1% cancer types with higher mutation frequency. These results suggest that the mutations with lower frequency might also play critical roles in cancer by perturbing the RBP–gene interactions. Integration of mutation frequency and network analyses will identify the key mutations in cancer.
In conclusion, these results should guide prioritizations of cancer‐causing mutations emerging from genome‐wide association analysis and next‐generation sequencing projects and provide insights into genotype–phenotype relationships in cancer.
Supporting information
Acknowledgment
We acknowledge Dr. Snorri S. Thorgeirsson and Dr. Jasmin Coulombe‐Huntington for valuable feedback and critical reading of the manuscript. We are grateful for contributions from TCGA Research Network Analysis Working Group. We also acknowledge the high‐performance computing core facility at MD Anderson for computing assistance.
Supported by the AASLD Foundation Pinnacle Research Award in Liver Disease to N.S., the University of Texas System Rising STARs award to N.S., and the University Center Foundation via the Institutional Research Grant program at the University of Texas MD Anderson Cancer Center to N.S. Y.L. would also like to acknowledge National Natural Science Foundation of China (grants 31871338, 61873075, 61502126, and 31571331) and postdoctoral fellowships from Harold C. and Mary L. Daily Endowment Fund and Ben F. Love Fellowship in Innovative Cancer Therapies. D.J.M. was supported by NCI T32CA186892.
Potential conflict of interest: Nothing to report.
Contributor Information
Xia Li, Email: lixia@hrbmu.edu.cn.
Song Yi, Email: stephen.yi@austin.utexas.edu.
Nidhi Sahni, Email: nsahni@mdanderson.org.
References
Author names in bold designate shared co‐first authorship.
- 1. Brito AF, Abrantes AM, Tralhao JG, Botelho MF. Targeting hepatocellular carcinoma: what did we discover so far? Oncol Rev 2016;10:302. [DOI] [PMC free article] [PubMed] [Google Scholar]
- 2. Prieto J, Melero I, Sangro B. Immunological landscape and immunotherapy of hepatocellular carcinoma. Nat Rev Gastroenterol Hepatol 2015;12:681‐700. [DOI] [PubMed] [Google Scholar]
- 3. Lukong KE, Chang KW, Khandjian EW, Richard S. RNA‐binding proteins in human genetic disease. Trends Genet 2008;24:416‐425. [DOI] [PubMed] [Google Scholar]
- 4. Cooper TA, Wan L, Dreyfuss G. RNA and disease. Cell 2009;136:777‐793. [DOI] [PMC free article] [PubMed] [Google Scholar]
- 5. Kechavarzi B, Janga SC. Dissecting the expression landscape of RNA‐binding proteins in human cancers. Genome Biol 2014;15:R14. [DOI] [PMC free article] [PubMed] [Google Scholar]
- 6. Wang J, Liu Q, Shyr Y. Dysregulated transcription across diverse cancer types reveals the importance of RNA‐binding protein in carcinogenesis. BMC Genom 2015;16(Suppl 7):S5. [DOI] [PMC free article] [PubMed] [Google Scholar]
- 7. Chin L, Hahn WC, Getz G, Meyerson M. Making sense of cancer genomic data. Genes Dev 2011;25:534‐555. [DOI] [PMC free article] [PubMed] [Google Scholar]
- 8. MacArthur J, Bowler E, Cerezo M, Gil L, Hall P, Hastings E, et al. The new NHGRI‐EBI Catalog of published genome‐wide association studies (GWAS Catalog). Nucleic Acids Res 2017;45:D896‐D901. [DOI] [PMC free article] [PubMed] [Google Scholar]
- 9. Welter D, MacArthur J, Morales J, Burdett T, Hall P, Junkins H, Klemm A, et al. The NHGRI GWAS Catalog, a curated resource of SNP‐trait associations. Nucleic Acids Res 2014;42:D1001–D1006. [DOI] [PMC free article] [PubMed] [Google Scholar]
- 10. Zhong Q, Simonis N, Li QR, Charloteaux B, Heuze F, Klitgord N, et al. Edgetic perturbation models of human inherited disorders. Mol Syst Biol 2009;5:321. [DOI] [PMC free article] [PubMed] [Google Scholar]
- 11. Mosca R, Tenorio‐Laranga J, Olivella R, Alcalde V, Ceol A, Soler‐Lopez M, et al. dSysMap: exploring the edgetic role of disease mutations. Nat Methods 2015;12:167‐168. [DOI] [PubMed] [Google Scholar]
- 12. Yi S, Lin S, Li Y, Zhao W, Mills GB, Sahni N. Functional variomics and network perturbation: connecting genotype to phenotype in cancer. Nat Rev Genet 2017;18:395‐410. [DOI] [PMC free article] [PubMed] [Google Scholar]
- 13. Sahni N, Yi S, Taipale M, Fuxman Bass JI, Coulombe‐Huntington J, Yang F, et al. Widespread macromolecular interaction perturbations in human genetic disorders. Cell 2015;161:647‐660. [DOI] [PMC free article] [PubMed] [Google Scholar]
- 14. Van Nostrand EL, Pratt GA, Shishkin AA, Gelboin‐Burkhart C, Fang MY, Sundararaman B, et al. Robust transcriptome‐wide discovery of RNA‐binding protein binding sites with enhanced CLIP (eCLIP). Nat Methods 2016;13:508‐514. [DOI] [PMC free article] [PubMed] [Google Scholar]
- 15. He C, Sidoli S, Warneford‐Thomson R, Tatomer DC, Wilusz JE, Garcia BA, et al. High‐resolution mapping of RNA‐binding regions in the nuclear proteome of embryonic stem cells. Mol Cell 2016;64:416‐430. [DOI] [PMC free article] [PubMed] [Google Scholar]
- 16. Ying Y, Wang XJ, Vuong CK, Lin CH, Damianov A, Black DL. Splicing activation by Rbfox requires self‐aggregation through its tyrosine‐rich domain. Cell 2017;170:312‐323.e310. [DOI] [PMC free article] [PubMed] [Google Scholar]
- 17. Krzywinski M, Schein J, Birol I, Connors J, Gascoyne R, Horsman D, et al. Circos: an information aesthetic for comparative genomics. Genome Res 2009;19:1639‐1645. [DOI] [PMC free article] [PubMed] [Google Scholar]
- 18. GTEx Consortium . Human genomics. The Genotype‐Tissue Expression (GTEx) pilot analysis: multitissue gene regulation in humans. Science 2015;348:648‐660. [DOI] [PMC free article] [PubMed] [Google Scholar]
- 19. Uhlen M, Fagerberg L, Hallstrom BM, Lindskog C, Oksvold P, Mardinoglu A, et al. Proteomics. Tissue‐based map of the human proteome. Science 2015;347:1260419. [DOI] [PubMed] [Google Scholar]
- 20. Zhao L, Sun T, Pei J, Ouyang Q. Mutation‐induced protein interaction kinetics changes affect apoptotic network dynamic properties and facilitate oncogenesis. Proc Natl Acad Sci USA 2015;112:E4046‐E4054. [DOI] [PMC free article] [PubMed] [Google Scholar]
- 21. Yang X, Coulombe‐Huntington J, Kang S, Sheynkman GM, Hao T, Richardson A, et al. Widespread expansion of protein interaction capabilities by alternative splicing. Cell 2016;164:805‐817. [DOI] [PMC free article] [PubMed] [Google Scholar]
- 22. Jiang H, Xu L, Wang Z, Keene J, Gu Z. Coordinating expression of RNA binding proteins with their mRNA targets. Sci Rep 2014;4:7175. [DOI] [PMC free article] [PubMed] [Google Scholar]
- 23. Nishtala S, Neelamraju Y, Janga SC. Dissecting the expression relationships between RNA‐binding proteins and their cognate targets in eukaryotic post‐transcriptional regulatory networks. Sci Rep 2016;6:25711. [DOI] [PMC free article] [PubMed] [Google Scholar]
- 24. Iadevaia V, Gerber AP. Combinatorial control of mRNA fates by RNA‐binding proteins and non‐coding RNAs. Biomolecules 2015;5:2207‐2222. [DOI] [PMC free article] [PubMed] [Google Scholar]
- 25. Xu J, Li CX, Li YS, Lv JY, Ma Y, Shao TT, et al. MiRNA‐miRNA synergistic network: construction via co‐regulating functional modules and disease miRNA topological features. Nucleic Acids Res 2011;39:825‐836. [DOI] [PMC free article] [PubMed] [Google Scholar]
- 26. Xu J, Shao T, Ding N, Li Y, Li X. miRNA‐miRNA crosstalk: from genomics to phenomics. Brief Bioinform 2017;18:1002‐1011. [DOI] [PubMed] [Google Scholar]
- 27. Rolland T, Tasan M, Charloteaux B, Pevzner SJ, Zhong Q, Sahni N, et al. A proteome‐scale map of the human interactome network. Cell 2014;159:1212‐1226. [DOI] [PMC free article] [PubMed] [Google Scholar]
- 28. He X, Zhang J. Why do hubs tend to be essential in protein networks? PLoS Genet 2006;2:e88. [DOI] [PMC free article] [PubMed] [Google Scholar]
- 29. Kramer HB, Lai CF, Patel H, Periyasamy M, Lin ML, Feller SM, et al. LRH‐1 drives colon cancer cell growth by repressing the expression of the CDKN1A gene in a p53‐dependent manner. Nucleic Acids Res 2016;44:582‐594. [DOI] [PMC free article] [PubMed] [Google Scholar]
- 30. Grant CE, Bailey TL, Noble WS. FIMO: scanning for occurrences of a given motif. Bioinformatics 2011;27:1017‐1018. [DOI] [PMC free article] [PubMed] [Google Scholar]
- 31. Khosravi P, Gazestani VH, Pirhaji L, Law B, Sadeghi M, Goliaei B, et al. Inferring interaction type in gene regulatory networks using co‐expression data. Algorithms Mol Biol 2015;10:23. [DOI] [PMC free article] [PubMed] [Google Scholar]
- 32. Yoshihara K, Shahmoradgoli M, Martinez E, Vegesna R, Kim H, Torres‐Garcia W, et al. Inferring tumour purity and stromal and immune cell admixture from expression data. Nat Commun 2013;4:2612. [DOI] [PMC free article] [PubMed] [Google Scholar]
- 33. Hoshida Y, Nijman SM, Kobayashi M, Chan JA, Brunet JP, Chiang DY, et al. Integrative transcriptome analysis reveals common molecular subclasses of human hepatocellular carcinoma. Cancer Res 2009;69:7385‐7392. [DOI] [PMC free article] [PubMed] [Google Scholar]
- 34. Borger DR, Tanabe KK, Fan KC, Lopez HU, Fantin VR, Straley KS, et al. Frequent mutation of isocitrate dehydrogenase (IDH)1 and IDH2 in cholangiocarcinoma identified through broad‐based tumor genotyping. Oncologist 2012;17:72‐79. [DOI] [PMC free article] [PubMed] [Google Scholar]
- 35. Cancer Genome Atlas Research Network . Comprehensive and integrative genomic characterization of hepatocellular carcinoma. Cell. 2017;169:1327‐1341.e1323. [DOI] [PMC free article] [PubMed] [Google Scholar]
- 36. Imaoka H, Toiyama Y, Saigusa S, Kawamura M, Kawamoto A, Okugawa Y, et al. RacGAP1 expression, increasing tumor malignant potential, as a predictive biomarker for lymph node metastasis and poor prognosis in colorectal cancer. Carcinogenesis 2015;36:346‐354. [DOI] [PubMed] [Google Scholar]
- 37. Jeffery J, Sinha D, Srihari S, Kalimutho M, Khanna KK. Beyond cytokinesis: the emerging roles of CEP55 in tumorigenesis. Oncogene 2016;35:683‐690. [DOI] [PubMed] [Google Scholar]
- 38. Sas‐Chen A, Aure MR, Leibovich L, Carvalho S, Enuka Y, Korner C, et al. LIMT is a novel metastasis inhibiting lncRNA suppressed by EGF and downregulated in aggressive breast cancer. EMBO Mol Med 2016;8:1052‐1064. [DOI] [PMC free article] [PubMed] [Google Scholar]
- 39. Witten JT, Ule J. Understanding splicing regulation through RNA splicing maps. Trends Genet 2011;27:89‐97. [DOI] [PMC free article] [PubMed] [Google Scholar]
- 40. Li Y, Sahni N, Pancsa R, McGrail DJ, Xu J, Hua X, et al. Revealing the determinants of widespread alternative splicing perturbation in cancer. Cell Rep 2017;21:798‐812. [DOI] [PMC free article] [PubMed] [Google Scholar]
- 41. Cho A, Shim JE, Kim E, Supek F, Lehner B, Lee I. MUFFINN: cancer gene discovery via network analysis of somatic mutation data. Genome Biol 2016;17:129. [DOI] [PMC free article] [PubMed] [Google Scholar]
Associated Data
This section collects any data citations, data availability statements, or supplementary materials included in this article.
Supplementary Materials