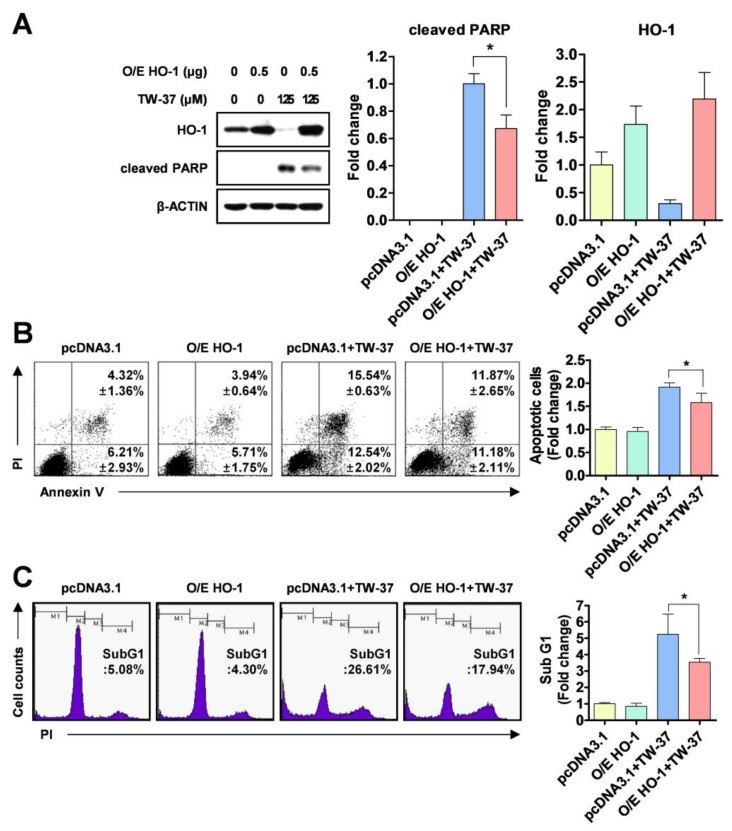
Figure 3.
Blockade of TW-37-induced apoptosis by ectopic expression of HO-1. YD-15 cells were transiently transfected with pcDNA3.1 or pcDNA3.1-HO-1 for 6 h, and then treated with DMSO or TW-37 for 48 h. (A) Protein levels of HO-1 and cleaved PARP were analyzed by western blotting. Actin was used as a loading control. Bar graphs are expressed as mean ± SD from three independent experiments. *, p < 0.05. (B) FACS analysis of annexin V/PI staining. The annexin V-positive cells are expressed as the percentage of apoptotic cells. The results are expressed as mean ± SD from three independent experiments. *, p < 0.05. (C) FACS analysis of PI staining. The histogram represents the distribution of the cell cycle and the percentage of cells in the sub-G1 phase are expressed as mean ± SD from three independent experiments. *, p < 0.05.

