Abstract
The binding modes at the A2B adenosine receptor (AR) of 72 derivatives of adenosine and its 5’-N-methyluronamide with diverse substitutions at the 2 and N6 positions were studied using a molecular modeling approach. The compounds in their receptor-docked conformations were used to build CoMFA and CoMSIA quantitative structure–activity relationship models. Various parameters, including different types of atomic charges, were examined. The best statistical parameters were obtained with a joint CoMFA and CoMSIA model: R2) 0.960, Q2) 0.676, SEE) 0.175, F) 158, and R2test) 0.782 for an independent test set containing 18 compounds. On the basis of the modeling results, four novel adenosine analogues, having elongated or bulky substitutions at N6 position and/or 2 position, were synthesized and evaluated biologically. All of the proposed compounds were potent, full agonists at the A2B AR in adenylate cyclase studies. Thus, in support of the modeling, bulky substitutions at both positions did not prevent A2B ARactivation, which predicts separate regions for docking of these moieties.
Introduction
The A2B adenosine receptor (AR)a is one of the four known subtypes of ARs: A1, A2A, A2B, and A3. These receptors are members of the rhodopsin family of G-protein-coupled receptors (GPCRs).1–3 A2B AR agonists are of interest in the treatment of diseases such as cardiac ischemia and diabetes.4,5
Like other members of the class A GPCR family, ARs are transmembrane proteins containing the typical seven transmembrane R-helical domains (TM I–VII) as well as extracellular (EL) and intracellular (IL) loops. X-ray crystallographic data are available for only a few GPCRs, i.e., rhodopsin and the β2-adrenergic receptor; the experimental three-dimensional structures of the ARs are unknown. Therefore, the homology modeling approach is commonly used to study the structure and ligand–receptor interactions of various GPCRs and other proteins.6–9 Several rhodopsin-based molecular models of the A1,A2A,A2B and A3, ARs have been proposed. The SAR (structure–activity relationship) of adenosine derivatives acting as A2B AR agonists has been studied qualitatively (representative reference structures in Chart 1). Recently we have published a model of the A2B AR complex with its potent agonist MRS3997 4.16
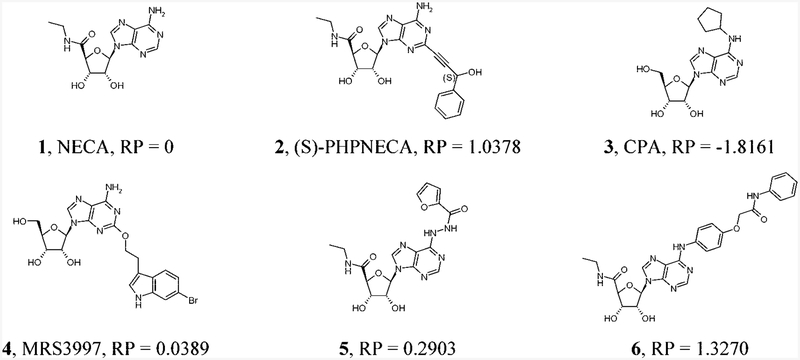
Chart 1.
Structures of Known AR Agonists That Were Used as Reference Compounds at the A2B ARa a RP: NECA related potency. RP = pEC50(comp)i – pEC50(NECA)i, where i represents the same reference publication.
Since molecular models can provide information about ligand–receptor interactions, quantitative SAR (QSAR) statistical models are widely used to evaluate the activity or other properties of known ligands and in virtual screening.17,18 QSARmodels are useful to explore the contribution of specific functional groups and moieties on the ligand to the overall biological activity. The comparative molecular field analysis (CoMFA) and comparative molecular similarity indices analysis (CoMSIA) are two of the most effective and descriptive methods of QSAR-modeling.19 CoMFA/CoMSIA in conjunction with receptor docking has been used to study the binding of agonists20 and antagonists21,22 at the human A3 AR. CoMFA has also beenused to study ligand recognition at other ARs.23,24
Recently, novel adenosine derivatives substituted at the N6 and/or 5’positions or at the C2 position were reported to be potent and/or selective A2B AR agonists (Chart 1).16,25,26 In the present study we have synthesized new analogues in which several of these affinity-(or selectivity-) enhancing substituents have been recombined in order to probe the compatibility of multiple extended groups in receptor docking and activation. Previous studies have reported that certain combinations of otherwise affinity-enhancing substitutions at the N6 and C2 positions were incompatible in binding to a given AR subtype.16,27,28 Here, the molecular docking at the A2B AR of both previously reported and novel derivatives of adenosine and the potent, nonselective agonist 5’-N-ethylcarboxamidoadenosine (NECA, 1) combined with the CoMFA and CoMSIA modeling was used to characterize the distal regions of the receptor involved in ligand recognition.
Results and Discussion
A2B Agonists Binding Mode.
For a long time within the superfamily of GPCRs, an X-ray structure was available for rhodopsin only.29,30 Very recently Kobilka and co-workers reported the first X-ray structure of the β2-adrenergic receptor.53 However, the structure of other GPCRs and their ligand–receptor complexes can be studied with the rhodopsin-based homology modeling approach.31,32 In this paper, our previously publishedmolecular model of the human A AR15,162B was used to study the binding modes of various well-known and recently proposed agonists of the A2B AR. The A2B AR model was built in homology with the X-ray structure of bovine rhodopsin and contains all seven transmembrane R-helices, as well as the intracellular and the extracellular hydrophilic loops.
Adenine and Ribose Moieties in the Putative Receptor Binding Site.
Prior to the building of the CoMFA and CoMSIA quantitative structure–activity relationship models, the receptor-docked conformations of the nucleoside ligands were calculated. Unfortunately, the X-ray structure of rhodopsin that serves as the template for our GPCR models was obtained for its ground state only. For this reason, there is an opinion that rhodopsin-based homology modeling of GPCRs is more applicable for studying antagonist than agonist binding modes. On the other hand successful docking studies of agonists were reported for various rhodopsin-based models of GPCRs. It was demonstrated that differences in the binding site configuration in the active and inactive states of the receptor can be taken into account using protein-flexible docking or conformational search analysis.6,12,14 In this study the putative binding modes of various agonists (1-6, 11-76) of the A2B AR (2- and N6-substituted analogues of adenosine and 1) were studied with the Monte Carlo multiple minimum (MCMM) conformational search analysis applied to the ligand docked to the binding site of the receptor. The structures of all ligands used in the study with their experimental and predicted activities are given in the Supporting Information. MacroModel software was used for automated docking.33
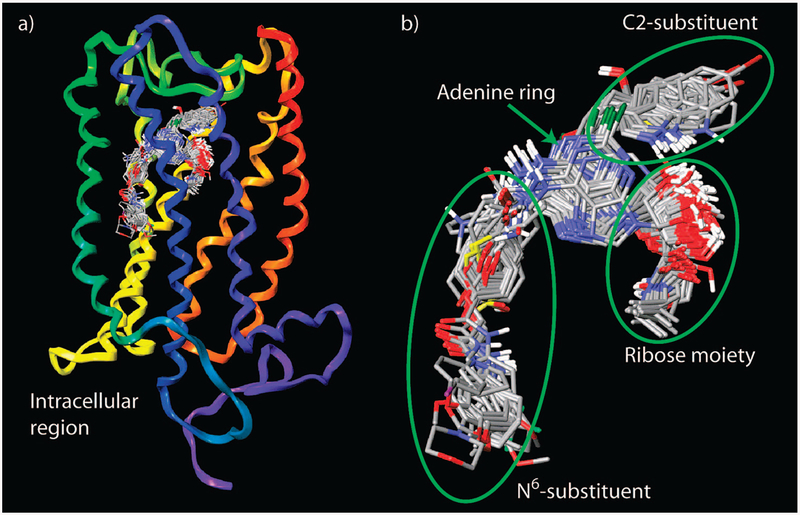
The results obtained indicated that the adenosine moiety of all studied ligands had a similar position and orientation inside the putative binding site. In particular, the N6-amino group of the ligands was oriented toward TM V, and position 2 of the adenine ring was oriented toward EL2. The 5’position of the ribose ring and the N6 substituent, when present, were oriented toward the intracellular part of the receptor (Figure 1).
Figure 1.
(a) Overlay of all docked ligands at the A2B AR. (b) Structural alignment of the ligands extracted from the ligand–receptor models. The structure of the A2B AR is colored by residue position: N-terminus and TM1 in orange, TM2 in ochre, TM3 in yellow, TM4 in green, TM5 in cyan, TM6 in blue, TM7 and C-terminus in purple.
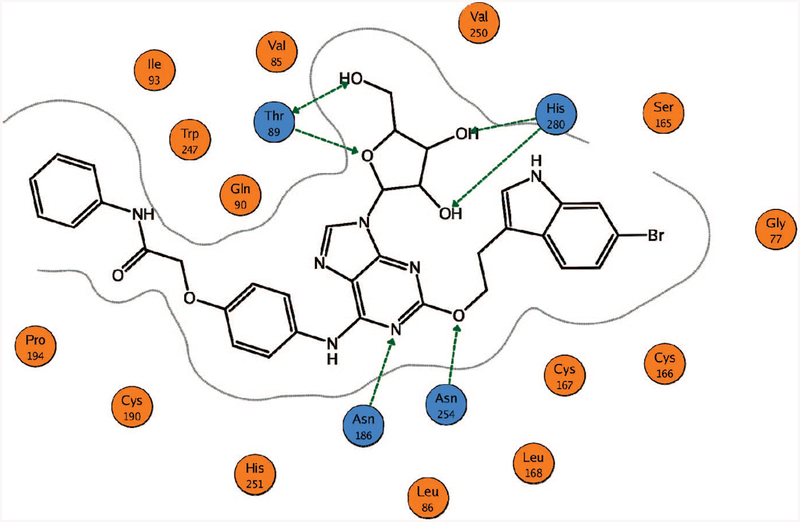
A schematic representation of the ligand binding mode at the putative nucleoside binding site of the human A2B AR isshown in Figure 2. In agreement with the published data of molecular modeling and site-directed mutagenesis of the AR family,12,14–16,34 the 2’-and 3’-hydroxyl groups of the dockednucleosides could form H-bonds with the conserved His2807.43. In addition, Thr893.36 was involved in H-bonding with the oxygen atom of the ribose ring and the 5’-hydroxyl group of adenosine analogues. The 5’-NH-group of 5’-N-alkylcarboxamidoadenosine derivatives also formed an H-bond with Thr893.36, while the oxygen atom of the 5’-amido group was H-bonded to Ser2797.42. The side chains of Asn1865.42 and Asn2546.55 were observed in proximity to the adenine ring of the ligands. Also, Trp2476.48 and His2516.52 were located near the N6 and 7 positions of the adenine ring, in agreement with previous studies.12 On the basis of the data of site-directed mutagenesis of other ARs, all of these conserved residues were reported to be critical for ligand binding.34
Figure 2.
Schematic representation of the ligand binding mode obtained after the docking studies. The binding mode of the 5’-OH derivative 9 is shown as an example. The green arrows correspond to the putative H-bonds. The critical residues involved in interactions with a ligand are colored in blue. For 5’-uronamide derivatives, the carbonyl oxygen atom was H-bonded to Ser2797.42 (not shown).
Detailed Interactions of N6- and 2-Substituted Derivatives of Adenosine and 1.
The binding modes of various N6- substituted analogues of adenosine and 1 at the A2B AR werestudied using MCMM calculations. As already mentioned, the N6 position of the ligands was oriented toward TM V. In addition, the N6-amino group appeared in proximity to the side chain of Asn2546.55, with which it likely could form an H-bond. This observation confirmed the previously published results of molecular modeling of ARs.15,16 However, extended groups at the N6 position, in particular N6-arylcarbamoylmethoxyphenyl or N6-(arylcarbonyl)hydrazino groups, present in recently reported A2B AR agonists,25,26 were found to be oriented toward the intracellular region of the receptor. Interestingly, previous modeling studies indicated that similar groups at the 8 position of some xanthine antagonists of the A2B AR could be oriented in the opposite direction, i.e., toward the extracellular region.10,11 In this study the MCMM calculations performed for such agonists were initiated from various starting points with various randomly generated initial orientations of the N6 substituent. The results obtained indicated that the orientation of this group toward the intracellular region was the most favorable energetically. Moreover, in those cases when the opposite orientation of the long N6 substituent was observed, critical ligand–receptor interactions were lost. In particular, in such cases the 2’-and 3’-hydroxyl groups were not involved in H-bonding with His2807.43, and the H-bonds with Thr893.36 were lost.
In the models obtained for N6-arylcarbamoylmethoxyphenyl derivatives such as 6, neither the amido group of this chain nor its ether oxygen atom was involved in H-bonding. However, the backbone oxygen atoms of Cys1905.46 and Val1915.47 werelocated in proximity to these groups. The terminal aromatic ring of the N6 substituent was favorably located in the pocket formed by several hydrophobic residues including Pro1945.50, Leu1955.51, Met1985.54, Phe2436.44, and Ala2446.45.
On the basis ofthe models obtained, the arylcarbonyl oxygen atom of N6-(arylcarbonyl)hydrazino derivatives, such as 5, can form a H-bond with His2516.52. In addition, it was found that the oxygen atom of the furan ring of such compounds could form a weak H-bond with the NH-group of the indole ring of Trp2476.48.
In summary, in our docking hypothesis the substituent at the 2 position was oriented toward the extracellular loops and the N6 substituent toward TM V, in the direction of the cytosolic side of the receptor. The binding modes obtained for known 2-substituted derivatives of adenosine and 1 such as 2, 4, 16, 18–26, 28, 33–47 were the same as we reported previously.15,16
QSAR Models.
Statistical models of quantitative structure– activity or structure–property relationships (QSAR/QSPR) are widely used to evaluate computationally various properties of chemical structures.35–37 In particular, such methods are useful to evaluate and predict the ligand potency or activity. Numerous approaches to build QSAR models have been introduced.38–42 Most of these approaches are based on multiple linear-regression analysis or on partial least-squares (PLS) analysis. They use a number of independent variables, i.e., descriptors calculated from the molecular structure, to obtain a reasonable correlation with a dependent variable, the studied biological property.
In the present study, CoMFA and CoMSIA implemented in Sybyl 7.343 were utilized to build statistically reliable “structure-potency” models for agonists of the human A2B AR. BothCoMFA and CoMSIA approaches are based on the PLS analysis.44,45 To build the CoMFA or CoMSIA model, an alignment of the studied compounds is needed. Since the initial model of the A2B AR used for the ligand docking had the same coordinates for all compounds, a reasonable and receptor-related alignment was obtained automatically after the docking studies (Figure 2). The relative potency (RP) with respect to 1 was calculated for each compound as described in the Experimental Section, and it was used as the dependent variable in QSAR models. Then the steric and electrostatic CoMFA contours as well as electrostatic, H-bond donor (HBD) and acceptor (HBA), and hydrophobic CoMSIA contours were calculated with Sybyl7.3.
Individual CoMFA and CoMSIA and joint CoMFA/CoMSIAmodels were built for the training set of 54 randomly selected A2B AR agonists, for which data in the stimulation of adenylate cyclase has been reported (Table 1 and Tables S1 and S2 of Supporting Information). The four different types of partial atomic charges, namely, Gasteiger-Hückel, AM1, PM3, and MNDO, were used. Initially the lattice spacing of 2 Å and only electrostatic, HBA, and HBD but not hydrophobic CoMSIA contours were calculated. The results obtained for a succession of models are summarized in Table 1. The best CoMFA model was derived for the data set (DS) of compounds with AM1 partial charges (Q2)=0.585, R2)=0.914, standard error of estimation (SEE))=0.252, F =102; PLS components (C) =5). In contrast, the best statistical parameters of the CoMSIA models were obtained for the compounds with the PM3 atomic charges (Q2) =0.612,=R2)=0.917,=SEE)=0.253, =F)=73, C)=7). Both AM1 and PM3 partial atomic charges provided reasonable statistical parameters of the joint CoMFA/CoMSIA models. However, the best results were obtained for the set of compounds with the MNDO charges assigned (Q2)=0.649,=R2)=0.958, SEE)=0.182,=F)=128, C)=8). Also, as follows from the data, the joint CoMFA/CoMSIA model allowed a better correlation and error of estimation in comparison with individual CoMFA and CoMSIA models. It is known that in some cases the quality of a CoMFA/CoMSIA model can be significantly improved using a decreased value of the lattice spacing. To examine this possibility, the joint CoMFA/CoMSIA model derived for the MNDO-charged compounds was rebuilt with a lattice spacing of 1 Å. This model (model 1) was characterized by the following improved statistical parameters: Q2)=0.668,=R2)=0.963, SEE)=0.171,=F)=146, C)=8. The value of the regression coefficient obtained for the independent test set of 18 compounds (indicated in Table S2 of Supporting Information) was as high as R2test)=0.714.
Table 1.
Statistical Parameters of the CoMFA and CoMSIA Modelsa
| lattice space = 2 Å | ||||
|---|---|---|---|---|
| GH charge type | AM1 charge type | PM3 charge type | MNDO charge type | lattice space = 1 Å MNDO charge type |
| CoMFA | ||||
| R2 = 0.233 | R2 = 0.914 | R2 = 0.705 | R2 = 0.705 | R2 = 0.952 |
| Q2 = 0.538 | Q2 = 0.585 | Q2 = 0.579 | Q2 = 0.492 | Q2 = 0.525 |
| SEE = 0.233 | SEE = 0.252 | SEE = 0.245 | SEE = 0.458 | SEE = 0.193 |
| F = 87 | F = 102 | F = 91 | F = 40 | F = 129 |
| C = 7 | C = 5 | C = 6 | C = 3 | C = 7 |
| CoMSIA,b α = 0.30 | ||||
| R2 = 0.782 | R2 = 0.919 | R2 = 0.917 | R2 = 0.927 | R2 = 0.915 |
| Q2 = 0.475 | Q2 = 0.605 | Q2 = 0.612 | Q2 = 0.571 | Q2 = 0.589 |
| SEE = 0.398 | SEE = 0.250 | SEE = 0.253 | SEE = 0.237 | SEE = 0.253 |
| F = 44 | F = 75 | F = 73 | F = 84 | F = 84 |
| C = 4 | C = 7 | C = 7 | C = 7 | C = 6 |
| CoMFA and CoMSIA,b α = 0.30 | Model 1 | |||
| R2 = 0.676 | R2 = 0.946 | R2 = 0.933 | R2 = 0.958 | R2 = 0.963 |
| Q2 = 0.474 | Q2 = 0.598 | Q2 = 0.636 | Q2 = 0.649 | Q2 = 0.668 |
| SEE = 0.480 | SEE = 0.205 | SEE = 0.227 | SEE = 0.182 | SEE = 0.171 |
| F = 35 | F = 114 | F = 92 | F = 128 | F = 146 |
| C = 3 | C = 7 | C = 7 | C = 8 | C = 8 |
| R2test = 0.714 | ||||
| CoMFA and CoMSIA,c α = 0.30 | Model 2 | |||
| R2 = 0.952 | ||||
| Q2 = 0.691 | ||||
| R2test = 0.759 | ||||
| SEE = 0.192 | ||||
| F = 131 | ||||
| C = 7 | ||||
| CoMFA and CoMSIA,c α = 0.50 | Model 3 | |||
| R2 = 0.960 | ||||
| Q2 = 0.676 | ||||
| R2test = 0.782 | ||||
| SEE = 0.175 | ||||
| F = 158 | ||||
| C = 7 | ||||
GH, Gasteiger-Hückel; SEE, standard error of estimation; C, PLS components. The training set consisted of compounds 1–6, 12, 13, 15–17, 20–22, 24–26, 30–35, 37, 38, 40–48, 50–52, 54–56, 58, 60–62, 64–66, 68–70, 72–74, 76 (Supporting Information).
Steric, electrostatic, H-bond donor and acceptor CoMSIA regions were used; R, attenuation factor.
Steric, electrostatic, H-bond donor and acceptor, and hydrophobic CoMSIA regions were used; α, attenuation factor.
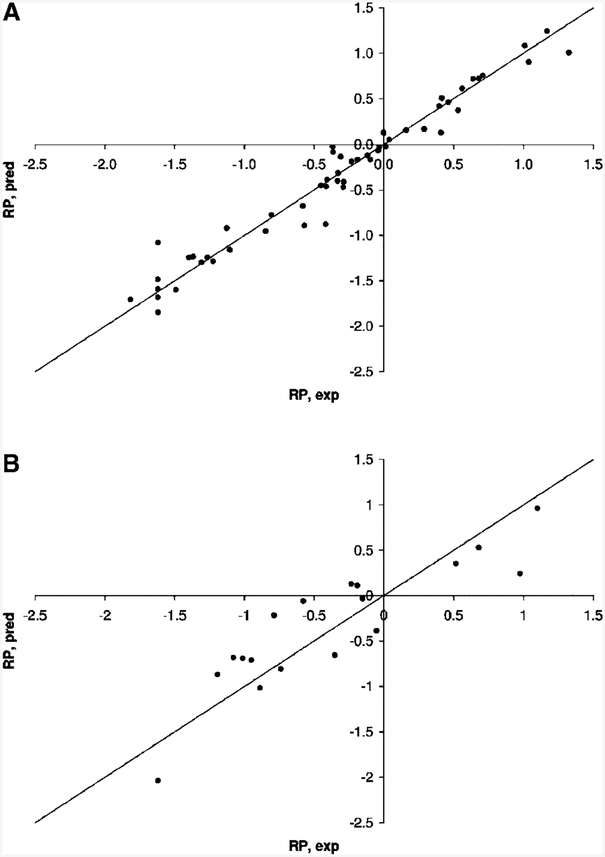
Then with the aim of improving the model quality, the hydrophobic CoMSIA contours were taken into account to provide model 2. The lattice spacing of 1 Å and MNDO partial atomic charges were used. The optimal number of PLS components was found to be C)=7. The addition of the hydrophobic CoMSIA regions resulted in slightly decreased values of the regression coefficient (R2)=0.952) and Fisher’s criterion (F)=131). Also, the value of standard error of estimation was increased (SEE)=0.192). However, the value of leave-one-out cross-validated correlation coefficient (Q2)= 0.691) was found to be higher than in model 1, demonstrating the better stability of model 2. Moreover, the regression coefficient obtained for the independent test set of compounds was also higher in model 2 (R2test)=0.759) than in model 1 (R2)=0.714). As a final step of the model refinement, model 2 was rebuilt with the attenuation factor (R) increased from its standard value of 0.30 to 0.50. The higher value of the attenuation factor provided more detailed and localized CoMSIA contours.45 Model 3 was obtained and characterized by the following statistical parameters: R2)=0.960,=Q2)=0.676, SEE) 0.176, F)=158,=C)=7, R2test)=0.782. The higher value of the attenuation factor provided a further improvement of the model statistics, namely, a higher value of the regression coefficient for the test set, a lower value of SEE, and optimal values of R2 and Q2 coefficients. Also the F criterion was increased. As shown in Figure 3, all points on the correlation plot fit well with the ideal line for both training and test sets of compounds, and no outliers were observed. Since the statistical parameters of model 3 were found to be reasonable, a further refinement of the model quality was not performed.
Figure 3.
Correlation plots obtained for the training (A) and test (B) sets of compounds with the CoMFA/CoMSIA model 3.
CoMFA Regions. CoMFA Steric Regions.
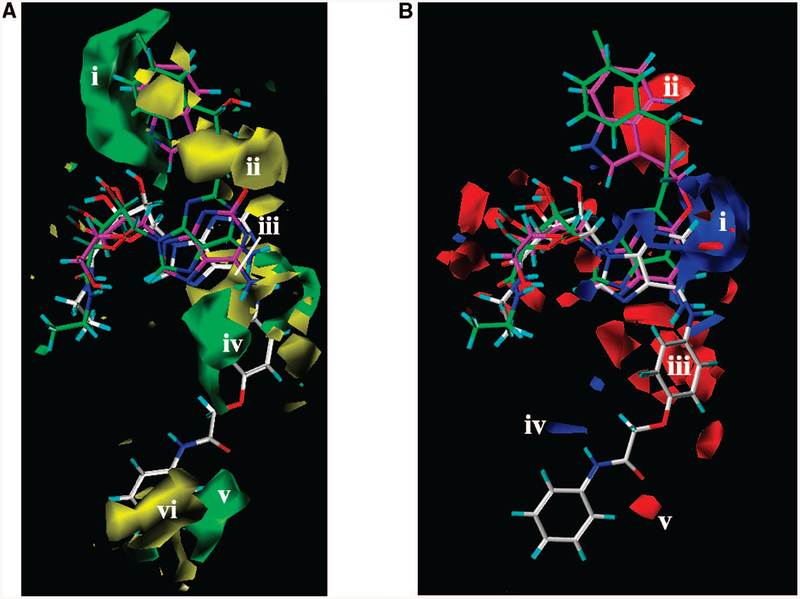
In agreement with experimentally determined ligand potencies at the A2B AR, bulky groups were predicted to be favorable around the indolyl ring of 2-(3-(indolyl)ethyloxy) derivatives such as MRS3997 4 (Figure 4A, region i). In contrast, the existence of bulky groups between the indole ring and the 2 position of the adenine ring was predicted to be less favorable (Figure 4A, region ii). Those conditions are reflected in the experimental data, particularly with the low potency of 2-chloro substituted derivatives and compounds with an alkyl chain at the 2 position. The unfavorable region for bulky groups (yellow region iii) was also observed near the N6 position of the ligands. This region corresponds to weak N6 substituted ligands, for example, N6- cyclopentyl, N6-isopropyl, or N6-ethyl derivatives. However, because of the presence of more potent N6-(arylcarbonyl)hydrazino substituted derivatives of 1, the favorable bulky group area iv appeared just below the unfavorable yellow region iii (Figure 4A). The green area v in the lower part of Figure 4A corresponds to the terminal aryl ring of N6-arylcarbamoylmethoxyphenyl derivatives, namely, 6, 58, 60–62, 64–66.
Figure 4.
Contour maps of the CoMFA regions are shown around (S)-PHPNECA 2 (carbon atoms colored in green), MRS3997 4 (carbon atoms colored in magenta), and ligand 6 (carbon atoms colored in white) superimposed in their conformations obtained after the docking studies; regions i and ii surround the 2 substituent. (A) Contour maps of the CoMFA steric regions (green, favored; yellow, disfavored). Regions iii–visurround the N6 substituent, and regions i and ii are located around the C2 substituent. (B) Contour maps of the CoMFA electrostatic regions. Blue regions are favorable for more positively charged groups; red regions are favorable for less positively charged groups. Polyhedral regions labeled with Roman numerals are discussed in the text. Regions i and ii surround the C2 substituent, and regions iii–v surround the N6 substituent.
In contrast to N6-arylcarbamoylmethoxyphenyl-substituted derivatives, benzyl- or cyclohexyl-substituted compounds (such as 70, 72, 76) are generally less potent at the A2B AR. For this reason, the areavi occupied by those groups was recognized by the model as unfavorable (yellow) for the bulky groups.
CoMFA Electrostatic Regions.
The 2-chloro substituted derivatives of adenosine and 1 (e.g., pEC50 (51))= −2.322, pEC50 (73))= −1.629) are less potent at the A2B AR than the corresponding compounds unsubstituted at the 2 position (e.g., pEC50 (5)= −1.914, pEC50 (73))= −0.863). Since a chlorine atom has a negative partial atomic charge, more positively charged groups were predicted to be favorable near position 2 of the adenine ring (Figure 4B, region i).
In contrast, the red region ii, which is favorable for the less negatively charged groups, was derived in the upper part of Figure 4B. This red area corresponds to the hydroxyl group of the 2-(3-hydroxy-3-phenyl) propyn-1-yl moiety of (S)-PHPNECA 2 and (S)-PHPAdo 33. Also, the region iii of the favorable position of more negatively charged atoms appeared just below the N6-amino group of the studied compounds. This area corresponds to the carbonyl oxygen atom and the oxygen atom of the furanyl ring of the N6-(arylcarbonyl)hydrazino derivatives such as 5.
In addition, positively charged groups were predicted to be favorable in proximity to the distal NH group of the N6-arylcarbamoylmethoxyphenyl derivatives such as 6 (Figure 4B, region iv). Additional negatively charged groups were predicted to be favorable in proximity to the oxygen atom of the arylcarbamoyl moiety in this series (region v).
CoMSIA Regions.
The CoMSIA steric and electrostatic contours were found to be nearly identical to the corresponding CoMFA contours. Since these contours were discussed above, the following section will concern the CoMSIA H-bond donor and acceptor contours as well as the CoMSIA hydrophobic contours.
CoMSIA H-Bond Donor and Acceptor Regions.
To take into account the role of H-bond donor and acceptor groups of the compounds, the corresponding CoMSIA contours were calculated. The CoMSIA acceptor contour corresponds to the H-bond donating groups of the receptor, and similarly, the CoMSIA donor contour describes the regions where the H-bond acceptor groups of the receptor should be located.
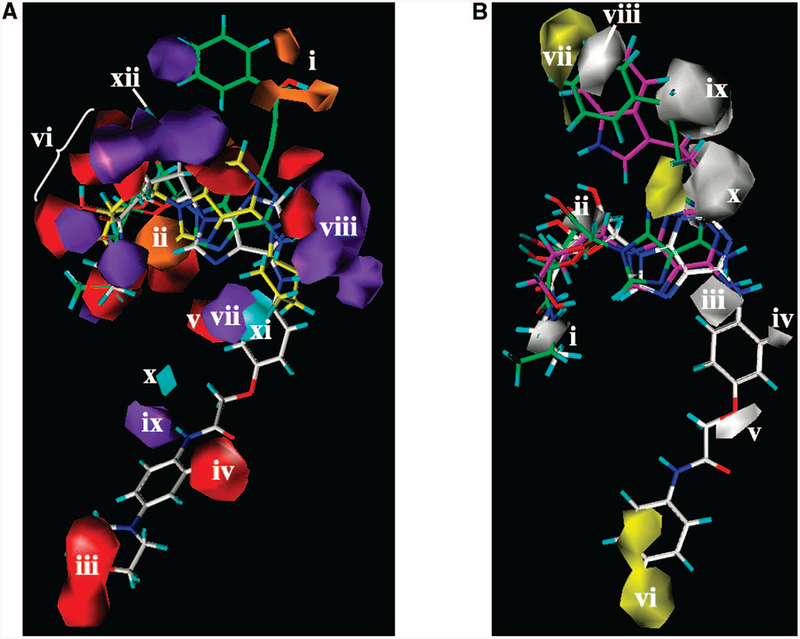
As shown in Figure 5A, H-bond donating groups of the receptor were predicted to be favorable in proximity to the oxygen atoms of the hydroxyl group of the 2-(3-hydroxy-3-phenyl)propyn-1-yl moiety of (S)-PHPNECA 2 and (S)-PHPAdo 33 (orange region i). A second region (ii) favorable for receptor H-bond donating groups appeared between the ribose oxygen atom and the 5’-OH group of the adenosine derivatives.
Figure 5.
(A) Contour maps of the CoMSIA H-bond donor and acceptor regions are shown around (S)-PHPNECA 2 (carbon atoms colored in green), CPA 3 (carbon atoms colored in yellow), and ligand 68 (carbon atoms colored in white): cyan plots, regions favored for the receptor H-bond acceptor groups; purple, regions disfavored for the receptor H-bond acceptor groups; orange, regions favored for the receptor H-bond donating groups; red, regions disfavored for the receptor H-bond donating groups. Region i appeared in proximity to the hydroxyl group of the 2-(3-hydroxy-3-phenyl)propyn1-yl moiety of (S)-PHPNECA 2 and (S)-PHPAdo 33. Region ii is located between the ribose oxygen atom and the 5’-OH group of the adenosine derivatives. Regions iii–v and vii–xi surround the N6 substituent. The group of regions vi and xii surround the 2’-and 3’-hydroxyl groups of the ribose moiety. (B) Contour maps of the CoMSIA hydrophobic regions (yellow, favored; white, disfavored) are shown around (S)-PHPNECA 2 (carbon atoms colored in green), MRS3997 4 (carbon atoms colored in magenta), and ligand 6 (carbon atoms colored in white) superimposed in their receptor-docked conformations. Polyhedral regions labeled with Roman numerals are discussed in the text. Region i corresponds to the 5’-position. Region ii is located in proximity to the 2’- and 3’-hydroxyl groups of the ribose moiety. Regions iii–visurround the N6 substituent, and regions vii–x appear around the 2 substituent.
Since the morpholino-substituted analogue 68 is one of the weak compounds in the series of N6-arylcarbamoylmethoxyphenyl derivatives, the oxygen atom of the morpholine ring was recognized as a disfavored feature by the model. For this reason, the location of the receptor H-bond donating groups was predicted to be unfavorable near that oxygen atom (red region iii in the bottom part of Figure 5A). A second red region (iv) in the bottom part of the Figure 5A was derived from the presence of N6-arylcarbamoylmethoxyphenyl derivatives containing methoxy groups at positions 3, 4, and 5 of the phenyl ring. These compounds are weaker than unsubstituted compound 6 (Chart1) or 4-phenyl substituted derivatives. For this reason, the model considered methoxy groups at those positions of the phenyl ring as unfavorable modifications. The red contour appearing near the N6-phenyl ring (Figure 5A, region v) reflects the sulfo group of N6-(4-sulfophenyl)adenosine (SPA) 32, which also binds weakly at the A2B AR.
Several regions that were unfavorable for the occurrence of H-bond donating groups on the receptor appeared around the ribose and adenine rings of the ligands(vi). However, these regions do not correspond to any unique structural features of individual ligands. It was found that, in general, the adenosine moieties of small nucleosides that were weak ligands of the A2B AR, namely, N6-cyclopentyladenosine (CPA) 3, 32, and some other derivatives, were located deeper inside the receptor than the corresponding moiety of more potent, larger ligands, for example, compound 1 or 6. The positions of the functional groups of the ribose moiety varied in the models obtained for various compounds. These differences were taken into account and resulted in the corresponding regionvi (Figure 5A).
For similar reasons, multiple regions that were unfavorable for H-bond acceptors on the receptor were derived in proximity to the ribose ring of the ligands.
In addition, as shown in Figure 5A, the position of the N6-amino group was found to be different for various ligands. In particular, the N6 position of the adenine ring of 3 had the same position as adenine N1 of compound 6. For this reason, regions where H-bond acceptor groups on the receptor are predicted to decrease the potency appeared in proximity to the N6 and 1 positions of the ligands (regions vii, viii).
Interestingly, it was observed after the docking studies that the phenylcarbamoyl moiety of the less potent N6-arylcarbamoylmethoxybenzyl derivatives, namely, 70 included in the training set, appeared slightly deeper inside the receptor than this moiety of more potent N6-arylcarbamoylmethoxyphenyl derivatives (e.g., 6). This difference in the ligand binding modes was characterized by two polyhedra in the CoMSIA model that appeared near the NH group of those compounds. The purple area ix, unfavorable for H-bond acceptor groups on the receptor, was located deeper than the area × that was favorable for such groups (cyan). The regions xi and xii, favoring H-bond acceptors on the receptor, were predicted to be near the 2’- and 3’-hydroxyl groups and the N6-amino group of the potent ligands of the A2BAR.
CoMSIA Hydrophobic Regions.
Not surprisingly, the calculated CoMSIA hydrophobic contours are in a good agreement with the experimentally observed potencies of the studied compounds and their binding modes proposed with the molecular modeling (Figure 5B). Region i, unfavorable for hydrophobic groups on the receptor, appeared in proximity to the 5”region, i.e., consisting of a hydroxyl group for derivatives of adenosine or an NH group for 1. Also, the presence of hydrophobic groups in positions occupied by 2’- and 3’-hydroxyl groups was predicted to be unfavorable (region ii). In addition, hydrophobic groups at the N6 position were predicted to be unfavorable (region iii). These findings are in agreement with experimental values of EC50 of N6-methyl-(e.g., 29, 39, 46), N6-ethyl (e.g., 35, 36, 40), N6-isopropyl (e.g., 44, 47) derivatives, CPA 3, and N6-phenyladenosine 30. The small white area iv located below the N6 position in Figure 5B was placed between the aromatic ring of N6-benzyladenosine 31 and the aromatic ring of compound 5 and its derivatives.
As shown in Figure 5B, the hydrophilic oxygen atom at position 4 of the phenyl ring of compound 6 was recognized by the model, and the corresponding hydrophobic disfavored region v appeared at that position.
The favored hydrophobic region vi appeared near the aromatic ring of the arylcarbamoyl moiety of 6, indicating a lower potency of compounds with more hydrophilic methoxy groups in comparison with the unsubstituted phenyl ring or 4-halogenophenyl substituted derivatives.
One favored region (vii) and one disfavored region (viii) appeared in the upper part of Figure 5B. The favored (yellow) regionviicorrespondstothearomaticringsof2-(3-(indolyl)ethyloxy) substituted adenosine derivatives (e.g., 4), and to the phenyl ring of PHPNECA and PHPAdo analogues such as 2 and 34. In contrast, the disfavored (white) region viii was located at the position of the long alkyl chain of 2-hexynyl substituted adenosine derivatives (38, 40, 41) and 2-(1-(E)-hexenyl)adenosine-5’-N-ethyluronamide (HENECA) 45. Also, a disfavored hydrophobic region appeared in proximity to the hydroxyl group of the 2-(3-hydroxy-3-phenyl)propyn-1-yl moiety of (S)-PHPNECA 2 and (S)-PHPAdo 34. In addition, the area occupied by the oxygen atom of the ethyloxy group of 2-(3-(indolyl) ethyloxy) substituted analogues (e.g., 4, 16, 20, 22) was recognized as a disfavored region (x) for hydrophobic groups, while a favored region appeared near position 2 of PHPNECA and PHPAdo analogues (Figure 5B).
Novel A2B AR Agonists.
The analysis of the ligand binding modes obtained after the MCMM calculations were performed for the known A2B AR agonists indicated that the substituents at theN6- and 2 positions were located in two distinct pockets of the binding site. As already discussed, the groups at the N6 position were oriented toward the intracellular region. In contrast, the substituents at position 2 were oriented toward the extracellular loops of the receptor. At the same time, the adenosine moiety had almost the same position inside the receptor for all of the studied ligands. These observations made it possible to propose that the ligands containing both extended groups at the N6 position25,26 and a bulky substituent at position 2, namely, a 2-(3-(indolyl)ethyloxy) group as occurs in 4,16 could also fit the binding site well. The findings stand in contrast to previous models that suggest an overlay between bulky substituents at the 2 and N6 positions.27 We have found that in the present A2B AR model these groups occupy distinct regions inside the binding site.
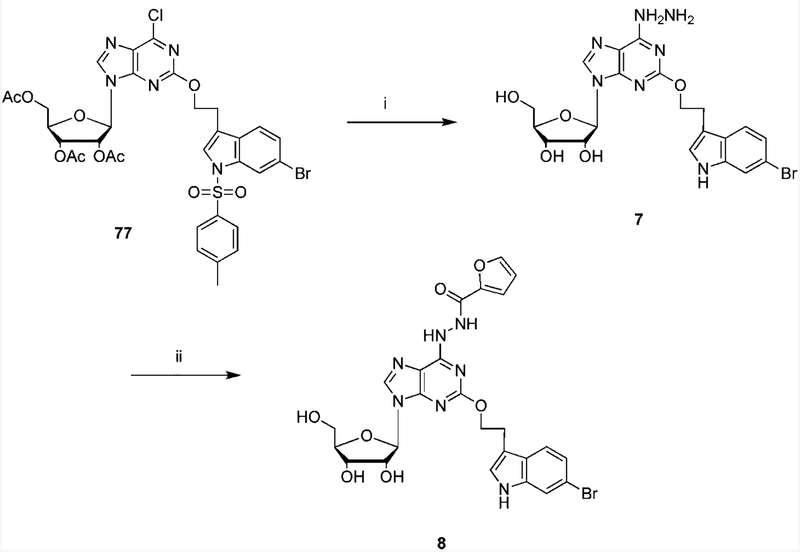
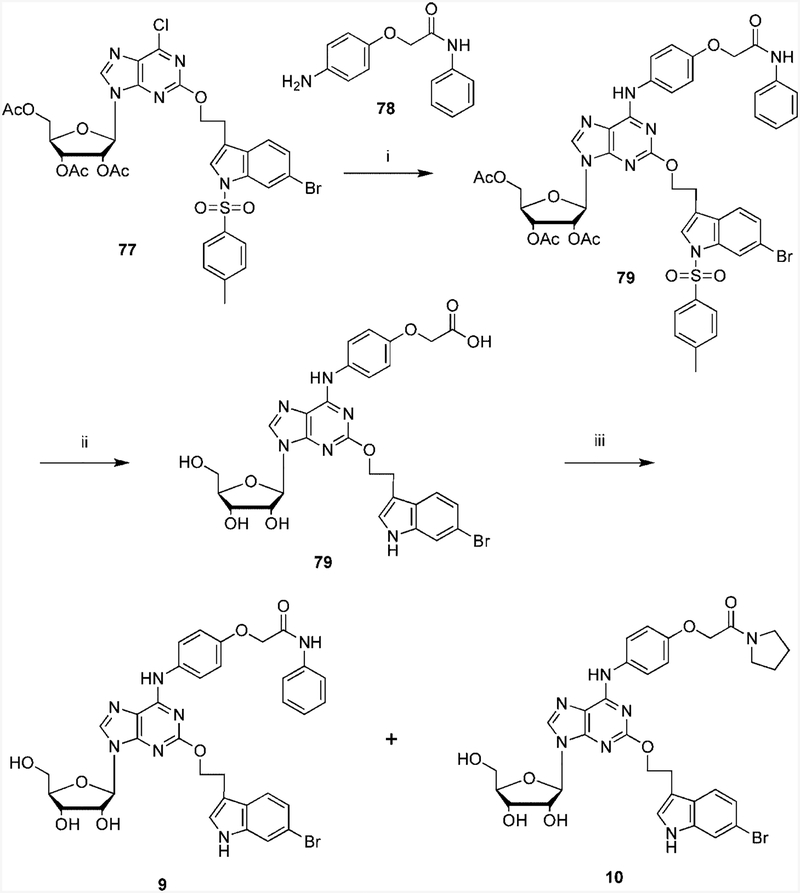
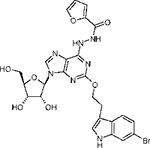
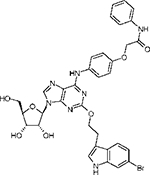
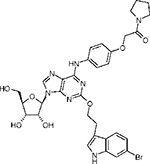
With the aim to test the above hypothesis, four novel adenosine derivatives 7–10 were designed and synthesized as potential agonists of the A2B AR (Table 2). The synthetic routes are shown in Schemes 1 and 2. These structures were first docked to the A2B AR model with the protocol used for all other studied ligands. All four compounds fit the binding site well and established similar ligand–receptor interactions as the corresponding individually substituted compounds (Figure 2).
Table 2.
Experimental and Predicted Potencies of the Novel Agonists in Activation of the Human A2B AR and Experimental Binding Affinities Measured at Two Other ARs (EC50 and Ki Values in nM)
| Compound: | 7 | 8 | 9 | 10 |
|---|---|---|---|---|
| Structure: | 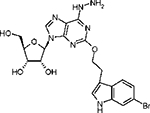 |
 |
 |
 |
|
Functional data |
||||
| EC50, A2Ba | 174 ± 71 | 289 ± 48 | 143 ± 26 | 965 ± 424 |
| RP (A2B)a | −0.0944 | −0.3148 | −0.0092 | −0.8384 |
| RP (A2B), Predictedb |
−0.5000 | −0.0828 | 0.8019 | −0.4224 |
| Binding datac | ||||
| Ki, A1 | 350 ± 65 | 29 ± 2%d | 370 ± 150 | 420 ± 135 |
| Ki, A2A | 2050 ± 600 | 40 ± 10%d | 1150 ± 25 | 46 ± 7%d |
Stimulation of adenylate cyclase measured in CHO cells stably expressing the human A2B AR. RP: NECA 1 related potency. Compounds 7–10 appear to be full agonists compared to 1 at the A2B AR (Supporting Information).
Using model 3 (Table 1).
Radioligand binding determined in CHO cell membranes (human A1 AR) or in HEK293 cell membranes (human A2AAR), as described in Experimental Section. Ki ± SEM values unless otherwise noted.
Percent displacement at 10 μM.
Scheme 1.
Synthetic Routes to the Novel 6-Hydrazinopurine-9-riboside Derivativesa a Reagents: (i) hydrazine; (ii) furoic acid, PyBop, DIPEA, DMF.
Scheme 2.
Synthetic Routes to the Novel 6-Arylaminopurine-9-riboside Derivativesa a Reagents and conditions: (i) EtOH, TEA, 110°, 18 h; (ii) KOH; (iii) aniline, PyBop, DIPEA, DMF.
The RP of these four novel agonists was predicted using the CoMFA/CoMSIA model 3. The results obtained are summarized in Table 2. In general, all compounds were predicted to be potent. As expected, compound 9, the combination of the two most potent ligands 6 and 4, was predicted as the most potent agonist. For similar reasons, a high potency was predicted for 10.
The experimental values of EC50 demonstrated that in agreement with the docking studies all compounds bound to the A2B receptor. Also, the experimentally measured potency of these ligands indicated that all of them are potent agonists of the A2B AR. Ligand 10 was found to be weaker than the other three novel compounds (EC50) 965 nM). However, the selectivity of compounds 7–10 for the A2B AR was low incomparison to the human A1 and A2A ARs (Table 2).
Thus, in the present study, the computational design of four novel agonists of the A2B receptor was performed on the basis of the molecular and statistical modeling of the A2B AR and itsknown ligands. These compounds were successfully synthesized and biologically evaluated at the human A2B AR. The results revealed that all of the proposed compounds are moderately potent but nonselective agonists of the A2B AR.
Conclusions
We utilized a molecular modeling approach to study putative binding modes of various N6- and 2-substituted derivatives of adenosine and its 5’-N-methyluronamide 1 at the human A2B AR. The modeling results suggest that bulky substituents at the 2 and N6 positions occupy distinct and nonoverlapping subregions within the putative A2B AR binding site. Furthermore, these groups were oriented in opposite directions inside the binding pocket. The similarity and differences in the binding modes of the studied compounds were analyzed on the basis of the ligand–receptor models obtained.
A successful statistical CoMFA/CoMSIA model was derived for the NECA-related potency of the studied A2B receptor agonists based on their receptor-docked conformation. The distribution of steric, electrostatic, H-bond donor and acceptor, and hydrophobic contours around the ligands was analyzed. The best statistical parameters were obtained with a joint CoMFA and CoMSIA model, which displayed an R2 of 0.960. On the basis of the modeling results, four novel adenosine analogues having elongated substitutions at the N6 and/or 2 positions were synthesized and evaluated biologically. All of proposed compounds were shown to be moderately potent, full agonists of the A2B AR in adenylate cyclase studies. Thus, as predicted by the QSAR modeling in conjunction with receptor docking, combinations of elongated and bulky substituents in adenosine analogues are tolerated for recognition by the A2B AR. Thesesubstituents bind to distinct pockets in the putative binding site for nucleosides in the TM region of the receptor. The QSAR models were consistent with the orientation of the N6-amino group toward TM V and the substituent at the adenine 2 position toward EL2.
Experimental Section
Data Set of Compounds.
The structures and experimental values of EC50 of 72 known agonists of the adenosine A2B AR were collected from the literature.16,25,26,46–48 The 2- and N6-substituted derivatives of adenosine and NECA 1 were included in the DS. Since the EC50 values were measured with different protocols in various publications, the RP of compounds was calculated as RP) =pEC50(comp)i – pEC50(NECA)i, where i represents the same reference publication. The entire DS was randomly divided into the test set of 54 compounds and training set of 18 compounds (25% of the total number of compounds). All types of compounds included in the entire DS were also included in both training and test sets of compounds.
The entire DS of compounds with their RP values are shown in the Supporting Information (Table S1).
Molecular Docking.
Throughout this paper we used the Ballesteros-Weinstein GPCR residue indexing system.49 The molecular model of the A2B AR15,16 was used in the ligand docking studies. All 72 compounds included in the DS, as well as compounds 7–10 synthesized in the present study, were docked to the A2B AR and subjected to the MCMM conformational search analysis as recently described.16 MacroModel software was used in the automated docking studies.33 The initial position of the receptor was the same for each compound.
CoMFA and CoMSIA Models.
The CoMFA and CoMSIA models were built using the Sybyl 7.3 software.43 The Gasteiger-Hückel charges were assigned to each compound. In addition, the AM1, PM3, and MNDO partial atomic charges were calculated for each compound in the DS using MOE software.52 The conformations of the A2B AR agonists obtained after molecular docking were used. Since during the molecular docking studies the receptor position was the same for each compound, additional alignment of the structures was not performed. The individualCoMFA and CoMSIA models, as well as combined CoMFA/CoMSIA models, were built. The both steric and electrostatic contours were calculated for CoMFA and the steric, electrostatic, H-bond donor and acceptor, and hydrophobic contours for CoMSIA were used. The four types of atomic charges mentioned above and the lattice space of 2 or 1 Å were examined in each model. All other parameters were set to their default values. The final model 3 was derived with the attenuation factor of α=0.5 instead of its default value of R) 0.3. The Use SAMPLS option was deselected, and the value of the column filtering option was set to 2.0. The automatically determined optimal number of PLS components was used.
Chemical Synthesis. Materials and Instrumentation.
Anhydrous hydrazine, 2-furoic acid, benzotriazol-1-yloxytripyrrolidinophosphonium hexafluorophosphate (PyBop), diisopropylethylamine (DIPEA), and other reagents and solvents were purchased from Sigma-Aldrich (St. Louis, MO). 2-(4-Aminophenoxy)-N-phenylacetamide 78 was prepared as reported.26
1H NMR spectra were obtained with a Varian Gemini 300 spectrometer using CDCl3 and CD3OD as solvents. Chemical shifts are expressed in δ values (ppm) with tetramethylsilane (δ0.00) for CDCl3 and water (δ3.30) for CD3OD.
TLC analysis was carried out on aluminum sheets precoated with silica gel F254 (0.2 mm) from Aldrich. Low-resolution mass spectrometry was performed with a JEOL SX102 spectrometer with 6 kV Xe atoms following desorption from a glycerol matrix or on an Agilent LC/MS 1100 MSD, with a Waters (Milford, MA) Atlantis C18 column. High-resolution mass spectroscopic (HRMS) measurements were performed on a proteomics optimized Q-TOF-2 (Micromass-Waters) using external calibration with polyalanine. Observed mass accuracies are those expected on the basis of the known performance of the instrument as well as trends in masses of standard compounds observed at intervals during the series of measurements. Reported masses are observed masses uncorrected for this time-dependent drift in mass accuracy.
2-(3”-(6”-Bromoindolyl)ethyloxy)-6-hydrazinoadenosine (7).
A solution of 2-(3”-(5”-(bromo-1”-(p-toluenesulfonyl)indolyl)ethyloxy)-6-chloro-3’,4’,5’-triacetyladenosine, 77 (24.0 mg, 0.030 mmol)16 was stirred with 0.50 mL of anhydrous hydrazine in a sealed flask. The reaction mixture was stirred at room temperature for 48 h. The solvent was evaporated under a vacuum, and the crude residue was subjected to preparative TLC developed with a mixture of chloroform and methanol (8:2) to give 7(7 mg, 43% yield). 1H NMR (CD3OD) δ8.15 (1H, s), 7.50 (1H, d, J) 8.5 Hz), 7.46 (1H, d, J) 1.5 Hz), 7.18 (1H, S), 7.14 (1H, dd, J) 1.5 and 8.5 Hz), 5.90 (1H, d, J) 5.7 Hz),4.70 (1H, t, J) 5.0 Hz), 4.65 (2H, t, J) 7.0 Hz), 4.35 (1H, dd, J)3.1 Hz and 5.2 Hz), 4.11 (1H, q, J) 3.0), 3.85 (1H, dd, J) 3.1 Hz and 12.5 Hz), 3.75 (1H, dd, J) 3.1 Hz and 12.5 Hz). 3.21 (2H, t, J) 7.0 Hz); HRMS (ESI MS m/z) calcd for C H −20 21BrN7O5 (M - H) 518.0788, found 518.0794.
2-(3”-(6”-Bromoindolyl)ethyloxy)-6-(N-furan-2-carbonyl)hydrazinoadenosine (8).
A solution of 2-furoic acid (11.2 mg, 0.10 mmol), PyBop (104 mg, 0.20 mmol), DIPEA (70.0 μL, 0.4 mmol) and 2.50 mL of anhydrous DMF was stirred at room temperature under N2 for 30 min. Then 250 μL of the mixture was added to a stirring solution of 7 (3.0 mg, 0.005 mmol) and 250 μL of anhydrous DMF. The reaction mixture was stirred at room temperature for 18 h. The solvent was evaporated under vacuum, and the crude residue was subjected to preparative TLC developed with a mixture of chloroform and methanol (8:2) to give 8 (2 mg, 60% yield). 1H NMR (CD3OD) δ 8.20 (1H, s), 7.47 (1H, d, J) 1.5 Hz), 7.42 (1H, d, J) 8.5 Hz), 7.18 (1H, S), 7.06 (1H, dd, J=)1.5 and 8.5 Hz)=7.01 (1H, m), 6.54 (1H, m), 6.32 (1H. m), 5.90 (1H, d, J) =5.7 Hz), 4.70 (1H, t, J) 5.0 Hz), 4.65 (2H, t, J) 7.0 Hz), 4.35 (1H, dd, J) 3.1 Hz and 5.2 Hz), 4.11 (1H, q, J) 3.0),3.85 (1H, dd, J) 3.1 Hz and 12.5 Hz), 3.75 (1H, dd, J) 3.1 Hz and 12.5 Hz). 3.21 (2H, t, J) 7.0 Hz); HRMS (ESI MS m/z) calcd for C25H25 BrN7O7 (M+H) 614.0999, found 614.0981.
2-(3”-(6”-Bromo-1”-(p-toluenesulfonyl)indolyl)ethyloxy)-6-(4-((phenylcarbamoyl)methoxy)phenylamino)-3’,4’,5’-triacetyladenosine (79).
A solution of 2-(3”-(5”-(bromo-1”-(p-toluenesulfonyl)indolyl)ethyloxy)-6-chloro-3’, 4’, 5’-triacetyladenosine, 77 (24.0 mg, 0.030 mmol), was dissolved in 1.0 mL of anhydrous ethanol. 2-(4-Aminophenoxy)-N-phenylacetamide 78 (8.0 mg, 0.033 mmol) and 5.0 μL of triethylamine (TEA) were added. The flask was then sealed and heated to 110°C for 18 h. The solvent was evaporated under a vacuum, and the crude residue was subjected to preparative TLC developed with a mixture of toluene and acetone (1:1) to give 79(16 mg, 50% yield). 1H NMR (CDCl3) δ 7.81 (1H, s), 7.72 (2H, d, J) 8.2 Hz),=7.69(2H, d, J)=8.2 Hz), 7.60 (2H, d, J) 9.0 Hz)7.45 (2H, d, J) 9.0 Hz), 7.35 (1H, t, 8.2 Hz), 7.12 (1H, s), 7.08 (1H, dd, J) 1.5 and 8.5 Hz), 7.02(d, 2H, J) 9.0 Hz), 6.11 (1H, d, J) 5.7 Hz), 5.96 (1H, t, J) 5.0 Hz), 5.52 (1H, t, J) 7.0 Hz),4.62, (2H, S), 4.33 (1H, dd, J) 3.1 Hz and 5.2 Hz), 3.20 (2H, t, J) 7.0 Hz), 2.31 (3H, s), 2.13 (3H, s), 2.08 (3H, s), 2.06 (3H, s). HRMS (ESI MS m/z) calcd for C47H44BrN7O12S (M + H)+ 1010.8609, found 1010.8622.
2-(3”-(6”-Bromo-1”-N-indolyl)ethyloxy)-6-(4-carboxylmethoxy)phenylamino)-3’,4’,5’-triacetyladenosine (80).
Compound 79 (16 mg, 0.015 mmol) was stirred with 1.0 mL of 0.25 M KOH in MeOH. The reaction mixture was stirred under N2 at room temperature for 18 h. The solvent was evaporated under a vacuum, and the crude residue was subjected to preparative TLC developed with a mixture of chloroform and methanol (4:1) to give 80 (7 mg, 51% yield). 1H NMR (CD3OD) δ 7.78 (2H, d, J) 8.2 Hz), 7.72 (2H, d, J) 8.2 Hz), 7.68 (2H, d, J) 9.0 Hz), 7.62 (2H, d, J) 9.0 Hz), 7.35 (1H, t, 8.2 Hz), 7.12 (1H, s), 7.08 (1H, dd, J) 1.5 and 8.5 Hz), 6.95(d, 2H, J) 9.0 Hz), 5.90 (1H, d, J) 5.7 Hz), 4.74 (1H, t, J) 5.0 Hz), 4.65, (1H, S), 4.60 (2H, t, J) 7.0 Hz), 4.33 (1H, dd, J) 3.1 and 5.2 Hz), 4.15 (1H, q, J) 3.0), 3.85 (1H, dd, J) 3.1 and 12.5 Hz), 3.75 (1H, dd, J) 3.1 and 12.5 Hz), 3.65 (1H, s), 3.20 (2H, t, J) 7.0 Hz); LRMS (ESI MS m/z) calcd for C28H26BrN6O8 (M - H)− 653.1, found 653.1.
2-(3”-(6”-Bromo-1”-N-indolyl)ethyloxy)-6-(4-((phenylcarbamoyl)methoxy)phenylamino)adenosine (9) and 2-(3”-(6”-Bromo-1”-N-indolyl)ethyloxy)-6-(4-((N-pyrrolidinecarbamoyl)methoxy) phenylamino)adenosine (10).
A solution of 80 (5.0 mg, 0.007 mmol), PyBop (8.0 mg, 0.015 mmol), and DIPEA (5.4 μL, 0.030 mmol) in 0.500 mL of anhydrous DMF was stirred at room temperature under N2 for 30 min. Aniline (5.0 μL, 0.050 mmol) was added to the reaction mixture, and stirring continued at room temperature for 18 h. The solvent was evaporated under a vacuum, and the crude residue was subjected to preparative TLC developed with a mixture of chloroform and methanol (9:1) to give 9 (2 mg, 40% yield). 1H NMR (CD3OD) δ 8.16 (1H, s), 7.82 (2H, d, J) 8.2 Hz), 7.72(2H, d, J) 8.2 Hz), 7.68 (2H, d, J) 9.0 Hz), 7.62 (2H, d, J) 9.0 Hz), 7.35 (1H, t, 8.2 Hz), 7.12 (1H, s), 7.08 (1H, dd, J) 1.5 and 8.5 Hz), 6.95(d, 2H, J) 9.0 Hz), 5.90 (1H, d, J) 5.7 Hz), 4.74 (1H, t, J) 5.0 Hz), 4.65, (1H, S), 4.60 (2H, t, J) 7.0 Hz), 4.33 (1H, dd, J) 3.1 and 5.2 Hz), 4.15 (1H, q, J)3.0), 3.85 (1H, dd, J) 3.1 and 12.5 Hz), 3.75 (1H, dd, J) 3.1 and 12.5 Hz), 3.65 (1H, s), 3.20 (2H, t, J) 7.0 Hz); HRMS (ESI MS m/z) calcd for C34H32BrN7O7 (M + H)+ 730.1625, found 730.1663.
Compound 10 was also isolated from the preparative TLC, (1.0 mg, 18% yield). 1H NMR (CD3OD) δ 8.16 (1H, s), 7.82 (2H, d, J) 8.2 Hz), 7.72(2H, d, J) 8.2 Hz), 7.68 (2H, d, J) 9.0 Hz), 7.62 (2H, d, J) 9.0 Hz), 7.35 (1H, t, 8.2 Hz), 7.12 (1H, s), 7.08 (1H, dd, J) 1.5 and 8.5 Hz), 6.95(d, 2H, J) 9.0 Hz), 5.90 (1H, d, J) 5.7 Hz), 4.74 (1H, t, J) 5.0 Hz), 4.65, (1H, S), 4.60 (2H, t, J) 7.0 Hz), 4.33 (1H, dd, J) 3.1 and 5.2 Hz), 4.15 (1H, q, J)3.0), 3.85 (1H, dd, J) 3.1 and 12.5 Hz), 3.75 (1H, dd, J) 3.1 and 12.5 Hz), 3.65 (1H, s), 3.52 (2H, m), 3.20 (2H, t, J) 7.0 Hz),2.02 (1H, m), 1.90 (1H, m); HRMS (ESI MS m/z) calcd for C32H35BrN7O7 (M + H)+ 708.1781, found 708.1775.
HPLC Analysis of Compounds 7–10.
The purity of the nucleoside products was demonstrated by HPLC as in our previous study,16 using an Agilent 1100 series HPLC (Santa Clara, CA) equipped with a Phenomenex Luna 5 μm C18(2) 100A analytical column (250 mm × 10 mm; Torrance, CA). All compounds weretested with a flow rate of 2 mL/min and the following acetonitrile/water linear gradient: 0 min, 20% acetonitrile; 20 min, 80% acetonitrile. Peaks were detected by UV absorption using a diode array detector. All compounds were found to be >98% pure by HPLC analysis. The compounds eluted at the following retention times: 7, 9.9 min; 8, 8.1 min; 9, 10.0 min; 10, 9.9 min.
Pharmacological Methods. Binding Assay.
Competitive radioligand binding assays were performed as described previously.50 [3H]CCPA (2-chloro-N6-cyclopentyladenosine, 42.6 Ci/mmol) and [3H]CGS21680 (2-[p-(2-carboxyethyl)phenylethylamino]-5’-N-ethylcarboxamidoadenosine, 40.5 Ci/mmol) were purchased from Perkin-Elmer (Waltham, MA). Human A1 ARs were stably expressed in Chinese hamster ovary (CHO) cells, while the human A2A AR was stably expressed in HEK293 cells. Cell membrane suspensions were prepared as described.51 For the binding determination, each tube contained 50 μL of the appropriate radioligand (A1[3H]CCPA, final concentration of 1.0 nM; A2A [3H]CGS21680, final concentration of 10 nM), 50 μL of increasing concentrations of the compounds, and 100 μL of cell membrane suspension expressing the appropriate receptor diluted with Tris-HCl buffer (50 mM, pH 7.4) containing 10 mM MgCl2. Nonspecific binding was determined using 10 μM NECA. The tubes were incubated at 25 °C for 1 h and then filtered through Whatman GF/B filters under reduced pressure using an MT-24 cell harvester (Brandell; Gaithersburg, MD). Filters were washed rapidly three times with ice-cold buffer. After the filters were washed, they were placed in scintillation vials containing 5 mL of Hydrofluor scintillation buffer and counted using a Perkin-Elmer liquid scintillation analyzer. The Ki values were determined using Prism (GraphPad, San Diego, CA)for all assays.
cAMP Assay.
cAMP was measured in CHO cells stablyexpressing the human A AR.512B cAMP accumulation was measured with cAMP enzyme immunoassay kit according to the instructions in the assay manual (Sigma; St. Louis, MO).
Supplementary Material
Acknowledgment.
We thank Dr. John Lloyd (NIDDK) for mass spectral determinations. This research was supported by the Intramural Research Program of the NIH, National Institute of Diabetes and Digestive and Kidney Diseases. We thank Dr. Stefano Costanzi (NIDDK) for helpful discussions.
Footnotes
Supporting Information Available: Table of A2B AR ligands in the training and test sets, adenylate cyclase concentration–response curves, and HPLC analysis results of the newly synthesized nucleosides 7-10. This material is available free of charge via the Internet at http://pubs.acs.org.
AR, adenosine receptor; CoMFA, comparative molecular field analysis; CoMSIA, comparative molecular similarity indices analysis; CPA, N6-cyclopentyladenosine; EL, extracellular loop; GPCR, G-protein-coupled receptor; HENECA, 2-(1-(E)-hexenyl)adenosine-5’-N-ethyluronamide; MCMM, Monte Carlo multiple minimum; NECA, 5’-N-ethylcarboxamidoadenosine; (S)-PHPAdo, (S)-2-[(3-hydroxy-3-phenyl)propyn-1-yl]adenosine; (S)-PHPNECA, (S)-2-[(3-hydroxy-3-phenyl)propyn-1-yl]-5’-N-ethylcarboxamidoadenosine; PLS, partial least squares; HBD, hydrogen bond donor; HBA hydrogen bond acceptor; RP, relative potency; DS, data set; QSAR; quantitative structure–activity relationship; TM, transmembrane helical domain; PyBop, benzotriazol-1-yloxytripyrrolidinophosphonium hexafluorophosphate; DIPEA, diisopropylethylamine; DMF, N,N-dimethylformamide; HRMS, high-resolution mass spectrometry; TEA, triethylamine; TLC, thin layer chromatography.
References
- (1).Jacobson KA; Gao Z-G Adenosine receptors as therapeutic targets. Nat. ReV. Drug. DiscoVery 2006, 5, 247–264. [DOI] [PMC free article] [PubMed] [Google Scholar]
- (2).Burnstock G Purine and pyrimidine receptors. Cell. Mol. Life Sci 2007, 64, 1471–1483. [DOI] [PMC free article] [PubMed] [Google Scholar]
- (3).Gao Z-G; Jacobson KA Emerging adenosine receptor agonists. Expert Opin. Emerging Drugs 2007, 12, 479–492. [DOI] [PubMed] [Google Scholar]
- (4).Eckle T; Krahn T; Grenz A; Köhler D; Mittelbronn M; Ledent C; Jacobson MA; Osswald H; Thompson LF; Unertl K; Eltzschig HK Cardioprotection by ecto-5’-nucleotidase (CD73) and A2B adenosine receptors. Circulation 2007, 115, 1581–1590. [DOI] [PubMed] [Google Scholar]
- (5).Németh ZH; Bleich D; Csóka B; Pacher P; Mabley JG; Himer L; Vizi ES; Deitch EA; Szabó C; Cronstein BN; Haskó G Adenosine receptor activation ameliorates type 1 diabetes. FASEB J. 2007, 10, 2379–2388. [DOI] [PMC free article] [PubMed] [Google Scholar]
- (6).Sum CS; Tikhonova IG; Neumann S; Engel S; Raaka BM; Costanzi S; Gershengorn MC Identification of residues important for agonist recognition and activation in GPR40. J. Biol. Chem 2007, 282, 29248–29255. [DOI] [PubMed] [Google Scholar]
- (7).Ivanov AA; Voronkov AE; Baskin II; Palyulin VA; Zefirov NS The study of the mechanism of binding of human ML1A melatonin receptor ligands using molecular modeling. Dokl. Biochem. Biophys 2004, 394, 49–52. [DOI] [PubMed] [Google Scholar]
- (8).Li JH; Han S-J; Hamdan FF; Kim S-K; Jacobson KA; Bloodworth LM; Zhang X; Wess J Distinct structural changes in a G protein-coupled receptor caused by different classes of agonist ligands. J. Biol. Chem 2007, 282, 26284–26293. [DOI] [PubMed] [Google Scholar]
- (9).Rodina EV; Vorobyeva NN; Kurilova SA; Belenikin MS; Fedorova NV; Nazarova TI ATP as effector of inorganic pyrophosphatase of Escherichia coli. Identification of the binding site for ATP. Biochemistry (Moscow) 2007, 72, 93–99. [DOI] [PubMed] [Google Scholar]
- (10).Ivanov AA; Baskin II; Palyulin VA; Piccagli L; Baraldi PG;Zefirov NS Molecular modeling and molecular dynamics simulation of the human A2B adenosine receptor. The study of the possible binding modes of the A2B receptor antagonists. J. Med. Chem 2005, 48, 6813–6820. [DOI] [PubMed] [Google Scholar]
- (11).Ferretti V; Bertoni E A preliminary docking study of a potent and selective xanthinic antagonist to the adenosinic A2B receptor. MinerVaBiotecnol. 2005, 16, 79–83. [Google Scholar]
- (12).Kim SK; Gao Z-G; Jeong LS; Jacobson KA Docking studies of agonists and antagonists suggest an activation pathway of the A3 adenosine receptor. J. Mol. Graphics Modell 2006, 25, 562–577. [DOI] [PMC free article] [PubMed] [Google Scholar]
- (13).Colotta V; Catarzi D; Varano F; Capelli F; Lenzi O; Filacchioni G; Martini C; Trincavelli L; Ciampi O; Pugliese AM; Pedata F; Schiesaro A; Morizzo E; Moro S New 2-arylpyrazolo[3,4-c]quinoline derivatives as potent and selectiv human A3 adenosine receptor antagonists. Synthesis, pharmacological evaluation, and ligand-receptor modeling studies. J. Med. Chem 2007, 50, 4061–4074. [DOI] [PubMed] [Google Scholar]
- (14).Palaniappan KK; Gao Z-G; Ivanov AA; Greaves R; Adachi H; Besada P; Kim HO; Kim AY; Choe AA; Jeong LS; Jacobson KA Probing the binding site of the A1adenosine receptor reengineered for orthogonal recognition by tailored nucleosides. Biochemistry 2007, 46, 7437–7448. [DOI] [PMC free article] [PubMed] [Google Scholar]
- (15).Ivanov AA; Palyulin VA; Zefirov NS Computer aided comparative analysis of the binding modes of the adenosine receptor agonists for all known subtypes of adenosine receptors. J. Mol. Graphics Modell 2007, 25, 740–754. [DOI] [PubMed] [Google Scholar]
- (16).Adachi H; Palaniappan KK; Ivanov AA; Bergman N; Gao Z-G; Jacobson KA Structure-activity relationships of 2, N6, 5’-substituted adenosine derivatives with potent activity at the A2B adenosine receptor. J. Med. Chem 2007, 50, 1810–1827. [DOI] [PMC free article] [PubMed] [Google Scholar]
- (17).Loging W; Harland L; Williams-Jones B High-throughput electronic biology: mining information for drug discovery. Nature ReV. Drug DiscoVery 2007, 6, 220–230. [DOI] [PubMed] [Google Scholar]
- (18).Muegge I; Oloff S Advances in virtual screening. Drug DiscoVery Today 2006, 3, 405–411. [DOI] [PMC free article] [PubMed] [Google Scholar]
- (19).Akamatsu M Current state and perspectives of 3D-QSAR. Curr. Top. Med. Chem 2002, 2, 1381–1394. [DOI] [PubMed] [Google Scholar]
- (20).Tchilibon S; Kim SK; Gao ZG; Harris BA; Blaustein J; Gross AS; Melman N; Jacobson KA Exploring distal regions of the A3 adenosine receptor binding site: sterically-constrained N6-(2-phenylethyl)adenosine derivatives as potent ligands. Bioorg. Med. Chem 2004, 12, 2021–2034. [DOI] [PMC free article] [PubMed] [Google Scholar]
- (21).Li A-H; Moro S; Melman N; Ji X.-d.; Jacobson KA Structure activity relationships and molecular modeling of 3,5-diacyl-2,4-dialkylpyridine derivatives as selective A3 adenosine receptor antagonists. J. Med. Chem 1998, 41, 3186–3201. [DOI] [PMC free article] [PubMed] [Google Scholar]
- (22).Moro S; Braiuca P; Deflorian F; Ferrari C; Pastorin G; Cacciari B; Baraldi PG; Varani K; Borea PA; Spalluto G Combined target-based and ligand-based drug design approach as a tool to define a novel 3D-pharmacophore model of human A3 adenosine receptor antagonists: pyrazolo[4,3-e]1,2,4-triazolo[1,5-c]pyrimidine derivatives as a key study. J. Med. Chem 2005, 48, 152–162. [DOI] [PubMed] [Google Scholar]
- (23).Rieger JM; Brown ML; Sullivan GW; Linden J; Macdonald TL Design, synthesis, and evaluation of novel A2A adenosine receptor agonists. J. Med. Chem 2001, 44, 531–539. [DOI] [PubMed] [Google Scholar]
- (24).Fossa P; Pestarino M; Menozzi G; Mosti L; Schenone S; Ranise A; Bondavalli F; Trincavelli ML; Lucacchini A; Martini C New pyrazolo[3,4-b]pyridones as selective A1 adenosine receptor antagonists: synthesis, biological evaluation and molecular modelling studies. Org. Biomol. Chem 2005, 3, 2262–2270. [DOI] [PubMed] [Google Scholar]
- (25).Baraldi PG; Preti D; Tabrizi MA; Fruttarolo F; Romagnoli R; Carrion MD; Cara LCL; Moorman AR; Varani K; Borea PA Synthesis and biological evaluation of novel 1-deoxy-1-[6-[((hetero)arylcarbonyl)hydrazine]-9H-purin-9-yl]-N-ethyl--D-ribofuranuronamide derivatives as useful templates for the development of A2B adenosine receptor agonists. J. Med. Chem 2007, 50, 374–380. [DOI] [PubMed] [Google Scholar]
- (26).Baraldi PG; Preti D; Tabrizi MA; Fruttarolo F; Saponaro G; Baraldi S; Romagnoli R; Moorman AR; Gessi S; Varani K; Borea PA N6-[(Hetero)aryl/(cyclo)alkyl-carbamoyl-methoxy-phenyl]-(2-chloro)-5’-N-ethylcarboxamido-adenosines: the first example of adenosine-related structures with potent agonist activity at the human A2B adenosine receptor. Bioorg. Med. Chem 2007, 15, 2514–2527. [DOI] [PubMed] [Google Scholar]
- (27).Dooley MJ; Quinn RJ The three binding domain model of adenosine receptors: molecular modeling aspects. J. Med. Chem 1992, 35, 211–216. [DOI] [PubMed] [Google Scholar]
- (28).Elzein E; Palle V; Wu Y; Maa T; Zeng D; Zablocki J 2-Pyrazolyl-N6-substituted adenosine derivatives as high affinity and selective adenosine A3 receptor agonists. J. Med. Chem 2004, 47, 4766–4773. [DOI] [PubMed] [Google Scholar]
- (29).Okada T; Sugihara M; Bondar A-N; Elstner M; Entel P; Buss V The retinal conformation and its environment in rhodopsin in light of new 2.2 Å crystal structure. J. Mol. Biol 2004, 342, 571–583. [DOI] [PubMed] [Google Scholar]
- (30).Lodowski DT; Salom D; Le Trong I; Teller DC; Ballesteros JA; Palczewski K; Stenkamp RE Crystal packing analysis of rhodopsin crystals. J. Struct. Biol 2007, 158, 455–462. [DOI] [PMC free article] [PubMed] [Google Scholar]
- (31).Schueler-Furman O; Wang C; Bradley P; Misura K; Baker D Progress in modeling of protein structures and interactions. Science 2005, 310, 638–642. [DOI] [PubMed] [Google Scholar]
- (32).Fanelli F; De Benedetti PG Computational modeling approaches to structure-function analysis of G protein-coupled receptors. Chem. ReV 2005, 105, 3297–3351. [DOI] [PubMed] [Google Scholar]
- (33).Mohamadi FN; Richards GJ; Guida WC; Liskamp R; Lipton M; Caufield C; Chang G; Hendrickson T; Still WC Macro-Models an integrated software system for modeling organic and bioorganic molecules using molecular mechanics. J. Comput. Chem 1990, 11, 440–467. [Google Scholar]
- (34).Costanzi S; Ivanov AA; Tikhonova IG; Jacobson KA Structure and function of G protein-coupled receptors studied using sequence analysis molecular modeling and receptor engineering: adenosine receptors. Front. Drug Des. DiscoVery 2007, 3, 63–79. [Google Scholar]
- (35).Ivanova AA; Ivanov AA; Oliferenko AA; Palyulin VA; Zefirov NS Highly diverse, massive organic data as explored by a composite QSPR strategy: an advanced study of boiling point. SAR QSAR EnViron. Res 2005, 16, 231–246. [DOI] [PubMed] [Google Scholar]
- (36).Kim SK; Jacobson KA Three-dimensional quantitative structure-activity relationship of nucleosides acting at the A3 adenosine receptor: analysis of binding and relative efficacy. J. Chem. Inf. Model 2007, 47, 1225–1233. [DOI] [PMC free article] [PubMed] [Google Scholar]
- (37).Moro S; Bacilieri M; Ferrari C; Spalluto G Autocorrelation of molecular electrostatic potential surface properties combined with partial least squares analysis as alternative attractive tool to generate ligand-based 3D QSARs. Curr. Drug DiscoVery Technol 2005, 2, 13–21. [DOI] [PubMed] [Google Scholar]
- (38).Li A-H; Moro S; Forsyth N; Melman N; Ji X; Jacobson KA Synthesis, CoMFA analysis, and receptor docking of 3,5-diacyl-2,4-dialkylpyridine derivatives as selective A3 adenosine receptor antagonists. J. Med. Chem 1999, 42, 706–721. [DOI] [PMC free article] [PubMed] [Google Scholar]
- (39).Palyulin VA; Radchenko VA; Zefirov NS Molecular field topology analysis method in QSAR studies of organic compounds.J. Chem. Inf. Comput. Sci 2000, 40, 659–667. [DOI] [PubMed] [Google Scholar]
- (40).Costanzi S; Tikhonova IG; Ohno M; Joshi BV; Colson AO; Houston D; Maddileti S; Harden TK; Jacobson KA P2Y1 antagonists: combining receptor-based modeling and QSAR for a quantitative prediction of the biological activity based on consensus scoring. J. Med. Chem 2007, 50, 3229–3241. [DOI] [PubMed] [Google Scholar]
- (41).Drabczyńska A; Müller CE; Schiedel A; Schumacher B; Karolak-Wojciechowska J; Fruziński A; Zobnina W; Yuzlenko O; Kieć-Kononowicz K Phenylethyl-substituted pyrimido[2,1-f]purinediones and related compounds: structure-activity relationships as adenosine A1 and A2A receptor ligands. Bioorg. Med. Chem 2007, 15, 6956–6974. [DOI] [PubMed] [Google Scholar]
- (42).Tikhonova IG; Baskin II; Palyulin VA; Zefirov NS CoMFA and homology-based models of the glycine binding site of N-methyl-D-aspartate receptor. J. Med. Chem 2003, 46, 1609–1616. [DOI] [PubMed] [Google Scholar]
- (43).SYBYL, version 7.3; Tripos Inc. (1699. South Hanley Road, St. Louis, MO 63144). [Google Scholar]
- (44).Klebe G; Abraham U; Mietzner T Molecular similarity indices in a comparative analysis (CoMSIA) of drug molecules to correlate and predict their biological activity. J. Med. Chem 1994, 37, 4130–4146. [DOI] [PubMed] [Google Scholar]
- (45).San Juan AA Structural investigation of PAP derivatives by CoMFA and CoMSIA reveals novel insight towards inhibition of Bcr-Abl oncoprotein. J. Mol. Graphics Modell 2007, 26, 482–493. [DOI] [PubMed] [Google Scholar]
- (46).de Zwart M; Link R; von Frijtag Drabbe Künzel JK; Cristalli G; Jacobson KA; Townsend-Nicholson A; IJzerman AP Nucleosides Nucleotides 1998, 17, 969–985. [DOI] [PMC free article] [PubMed] [Google Scholar]
- (47).Vittori S; Costanzi S; Lambertucci C; Portino FR; Taffi S; Volpini R; Klotz K-N; Cristalli G A2B adenosine receptor agonists: synthesis and biological evaluation of 2-phenylhydroxypropynyl adenosine and NECA derivatives. Nucleosides, Nucleotides Nucleic Acids 2004, 23, 471–481. [DOI] [PubMed] [Google Scholar]
- (48).Volpini R; Costanzi S; Lambertucci C; Taffi S; Vittori S; Klotz K-N; Cristalli G N6-Alkyl-2-alkynyl derivatives of adenosine as potent and selective agonists at the human adenosine A3 receptor and a starting point for searching A2B ligands. J. Med. Chem 2002, 45, 3271–3279. [DOI] [PubMed] [Google Scholar]
- (49).Ballesteros J; Weinstein H Integrated methods for the construction of three-dimensional models of structure-function relations in G protein-coupled receptors. Methods Neurosci. 1995, 25, 366–428. [Google Scholar]
- (50).Perreira M; Jiang JK; Klutz AM; Gao ZG; Shainberg A; Lu C; Thomas CJ; Jacobson KA “Reversine” and its 2-substituted adenine derivatives as potent and selective A3 adenosine receptor antagonists. J. Med. Chem 2005, 48, 4910–4918. [DOI] [PMC free article] [PubMed] [Google Scholar]
- (51).Gao ZG; Mamedova LM; Chen P; Jacobson KA 2-Substituted adenosine derivatives: affinity and efficacy at four subtypes of human adenosine receptors. Biochem. Pharmacol 2004, 68, 1985–1993. [DOI] [PMC free article] [PubMed] [Google Scholar]
- (52).Molecular Operating EnVironment, version 2008.05; Chemical Computing Group: Montreal, Canada. [Google Scholar]
- (53).Rosenbaum DM; Cherezov V; Hanson MA; Rasmussen SGF; Thian FS; Kobilka TS; Choi HJ; Yao XJ; Weis WI; Stevens RC; Kobilka BK GPCR engineering yields high-resolution structural insights into 2 adrenergic receptor function. Science 2007, 318, 1266–1273. [DOI] [PubMed] [Google Scholar]
Associated Data
This section collects any data citations, data availability statements, or supplementary materials included in this article.


