

Summary
In vitro experiments demonstrated that stimulation of Toll‐like receptor 9 (TLR‐9) by synthetic TLR‐9 ligands induces the invasion of TLR‐9‐expressing prostate cancer cells through matrix metalloproteinase 13 (MMP‐13). However, the clinical value of TLR‐9 and MMP‐13 co‐expression in the pathophysiology of the prostate is unknown. In the study, we evaluated the expression levels and clinical significance of the TLR‐9 and MMP‐13 in a series of prostate tissues. One hundred and eighty prostate tissues including prostate cancer (PCa) (n = 137), high‐grade prostatic intraepithelial neoplasia (HPIN) (n = 18) and benign prostatic hyperplasia (BPH) (n = 25) were immunostained for the TLR‐9 and MMP‐13 markers. Subsequently, the correlation between the TLR‐9 and MMP‐13 staining scores and clinicopathological parameters was obtained. Higher expressions of TLR‐9 and MMP‐13 were found in PCa and high‐grade prostatic intraepithelial neoplasia compared to benign prostatic hyperplasia tissues. Among PCa samples, a positive relationship was revealed between the MMP‐13 expression and Gleason score (P < 0.001). There was a significant correlation between TLR‐9 expression and regional lymph node involvement (P = 0.04). The expression patterns of TLR‐9 and MMP‐13 markers demonstrated a reciprocal significant correlation between the two markers in the same series of prostate samples (P < 0.001). Furthermore, the Gleason score of TLR‐9high/MMP‐13high and TLR‐9low/MMP‐13low phenotypes showed a significant difference (P = 0.002). Higher expressions of TLR‐9 and MMP‐13 can confer aggressive behaviour to PCa. Therefore, these markers may be used as a valuable target for tailored therapy of PCa.
Keywords: benign prostatic hyperplasia, high‐grade prostatic intraepithelial neoplasia, TLR‐9, MMP‐13, prostate cancer
1. INTRODUCTION
Prostate cancer (PCa) is one of the most common glandular tissue malignancies affecting men worldwide. Chemotherapy, radiotherapy and hormone therapy are the standard treatment for PCa and could relatively improve the survival. However, when the tumour becomes resistant to therapy and/or invades into other tissue, these treatments fail.1, 2, 3 Due to the anatomical location and possibly tissue structure of prostate gland, it is prone to infection and this can cause failure in function of immune system, and subsequently lead to chronic inflammation that can promote the tumour development. However, the detailed mechanism in initiation and progression of PCa is unknown.4, 5, 6, 7
In humans thirteen members of the Toll‐like receptors (TLR), family have been described. These are conserved membrane proteins which bind to components of bacteria, fungi and viruses as well as the damage‐associated molecular patterns (DAMPs).8, 9, 10, 11 Among TLRs, TLR‐9 recognizes unmethylated CpG dinucleotides expressed in bacteria and viruses and also vertebrate DNA. The TLRs are presented in different locations of the cells; for example, TLR‐1, TLR‐2, TLR‐4 and TLR‐5 are represented on the cell membrane surface, while TLR‐9 is intracellular and is located on the endosomal membrane for binding to its ligand.12 Many studies have shown that TLR‐9 expression is not limited to immune system cells. Expression of TLR‐9 was found in various types of normal epithelial cells and also tumour cells such as gastric, brain, lung, and breast.13, 14, 15, 16 Expression of TLR‐9 has been reported in PCa, and its overexpression in PCa patients is associated with higher Gleason grade and poor prognosis.17
Matrix metalloproteinases (MMPs), a family of zinc‐dependent proteinases, are involved in migration and invasion of tumour cells using degradation of basement membrane components and stromal connective tissues. In addition, MMPs affect some tumour cell behaviours, including enhancement of cellular proliferation and motility, as well as angiogenesis and the resistance to apoptosis.18 Among MMPs (MMP‐1 to MMP‐23), MMP‐13 (collagenase‐3) degrades type I, type II and type III collagens, but degrades soluble type II collagen more efficiently. MMP‐13 has been detected on tumour cells and correlates with invasion, metastasis and poor prognosis.19, 20 Overexpression of MMP‐13 has been shown in various cancers, including colorectal, breast, gastric, head and neck, chondrosarcoma and cutaneous malignant lymphoma.19, 20, 21, 22, 23 An in vitro study showed that TLR‐9 ligands strongly induced invasive properties in TLR‐9+ PCa cells via MMP‐13 production.24
The above‐mentioned lines of evidence indicated that TLR‐9 may be responsible for tumour progression in part through the production of MMP‐13; however, the clinical value of the TLR‐9 expression in association with MMP‐13 expression has not been fully elucidated. Given the importance of the TLR‐9 in tumour invasion via MMP‐13 expression and inflammatory conditions in PCa,24 the present study was conducted to evaluate the relationship between TLR‐9 and MMP‐13 in a large series of PCa patients, high‐grade prostatic intraepithelial neoplasia (HPIN) and benign prostatic hyperplasia (BPH) after prostatectomy.
2. METHODS
2.1. Patient characteristics
A total of 180 prostate tissue samples, including PCa (n = 137), BPH (n = 25) and HPIN (n = 18), with completely available histopathological data were collected as paraffin‐embedded blocks from Hasheminejad Kidney Center, a major university‐based referral urology centre in Tehran, Iran, between 2006 and 2011. The tissue samples, surgically obtained (radical or simple prostatectomy) and biopsy specimens, were taken before systemic treatment, including hormone therapy and radiotherapy. Paraffin‐embedded sections were stained with haematoxylin and eosin (H&E) according to routine diagnostic procedures. Medical and pathological reports, including age, tumour volume, serum PSA level, tumour type, Gleason score, pathologic tumour stage (pTNM staging), tumour involvement to the bladder neck, seminal vesicles and vasa deferentia, and regional lymph node as well as vascular invasion, perineural invasion and surgical margins were reviewed to confirm the diagnosis. The AJCC/UICC TNM staging system was applied for the determination of tumour stage,25 and International Society of Urological Pathology (ISUP) Consensus in 2014 was used to define tumour grade with the Gs system.26 All H&E‐stained slides were observed to determine the best area for preparing tissue microarray (TMA) of each prostatectomy specimen. The patient information was collected completely anonymously to preserve patient confidentiality. Tumour samples were obtained from radical prostatectomy and needle biopsy specimens after obtaining informed consent from patients.
2.2. Ethical approval
This research was conducted according to ethical guidelines approved by the Research Ethics Committee of Iran University of Medical Sciences.
2.3. Immunohistochemistry
Immunohistochemical staining procedures for TLR‐9 and MMP‐13 detection were carried out on TMA slides related to prostatectomy and needle biopsy samples as described previously.27 In TMA which was used for prostatectomy samples, three cores were included for each sample to increase the accuracy and validity of evaluations and decrease variability of antigen expression. Previous studies demonstrated that despite the heterogeneity of antigen expression between cores, each core may exhibit more than 90% of the staining pattern of a whole tissue section, while analysis of the two readable cores was accomplished greater than 95% accuracy.28
For qualitative staining of the antigens, standard chain polymer‐conjugated (EnVision) technique was used for paraffin‐embedded tissues. 5‐μm sections were cut and mounted on to charged slides (Superfrost Plus, Thermo Scientific, Germany). Deparaffination was performed at 60°C and xylene, followed by rehydration via reducing the ethanol grades. Tissue endogenous peroxidase activity was inhibited by placing the slides in methanol containing 0.3% hydrogen peroxide (H2O2) for 20 minutes at room temperature (RT). Tissue slides were retrieved via heating by autoclaving for 10 minutes in citrate buffer (pH 6). Afterwards, the slides were treated with the primary antibodies, the mouse monoclonal anti‐TLR‐9 antibody (Clone 26C593.2, Novus Biological, Littleton, CO, USA) and rabbit polyclonal anti‐MMP‐13 antibody (Abcam, Inc., Cambridge, MA), at 4°C overnight. Serial dilutions (1:200, 1:400 and 1:600 for anti‐TLR‐9 antibody; 1:200, 1:400, 1:600, 1:800 and 1:1000 for anti‐MMP‐13 antibody) were prepared and the optimal dilution for subsequent use was determined as 1:200 for the anti‐TLR‐9 antibody and 1:1000 for anti‐MMP‐13 antibody. After the primary antibody step the slodes incubated with the secondary antibody (EnVision™+/HRP, Dual Link Rabbit/Mouse, Dako, Denmark) for 60 minutes at RT followed by the addition of 3,3′‐diaminobenzidine (DAB; Dako) to visualize the antigen ‐ bound antibody. Finally, slides were lightly counterstained with haematoxylin (Dako) and dehydrated with increasing grades of ethanol, immersed in xylene (Dako) for clearing and mounted for visualization. As the positive control, the whole tissue section of spleen and liver specimens was used for TLR‐9 and MMP‐13 detection respectively. The PBS buffer was used instead of the primary antibodies as negative control to confirm the specificity of the staining.
2.4. Scoring system of TMA and biopsy slides
The TLR‐9 and MMP‐13 expression levels were evaluated using a semi‐quantitative scoring system after a series was observed on the microscope by two expert pathologists in a blinded manner without previous awareness of clinical and pathological parameters of patients. The final scoring assessment was performed with a re‐evaluation of the distribution of TLR‐9 and MMP‐13 on the prostate tissues at 10X, and higher magnifications and final scores were given in agreement.
Intensity of staining was categorized into 0 (no expression), 1+ (weak), 2+ (moderate) and 3+ (high). The percentage of TLR‐9‐ and MMP‐13‐positive cells was classified as: 0 (no staining), 1 (<50% positive cells), 2 (50%‐80% positive cells) and 3 (>80% positive cells). Histochemical score (H‐score) for each sample was obtained by multiplying the staining intensity in the percentage of stained cells, and a final score of 0‐300 was given. The mean of H‐score was considered as the cut‐off point (for TLR‐9, H‐score = 212 and for MMP‐13, H‐score = 191), and the samples were classified into two groups according to high and low expressions based on cut‐off point as previously described.29
It is necessary to mention that TMA blocks were constructed in three copies for each specimen; the mean scoring of three cores was then calculated as the final score.
2.5. Statistical analysis
SPSS statistical software package version 20 (SPSS, Chicago, IL, USA) was used to analyse the data, and Prism™ version 6.0 software (GraphPad Inc., San Diego, CA, USA) was used for diagram depiction. In immunohistochemistry, receiver operating characteristic (ROC) curves and the area under the curve (AUC) were used to discriminate the TLR‐9 and MMP‐13 expressions in studied groups. Pearson's chi‐square test, one‐way ANOVA and R tests were used to analyse the significance of the correlation between TLR‐9 and MMP‐13 expressions and clinicopathological parameters. Another analysis was performed for the association of TLR‐9 and MMP‐13 expressions in PCa, BPH and HPIN samples using independent sample t test. A P‐value of <0.05 was considered to be statistically significant.
3. RESULTS
3.1. Study population
To evaluate the TLR‐9 and MMP‐13 expressions and their clinical relevance, the expression of these markers was determined in a series of prostate tissues, including 137 (76%) PCa cases, 18 (10%) HGPIN and 25 (14%) BPH. The total mean age of studied groups was 66 years (ranged 39‐90). In PCa cases, the mean age was 66 years (ranged 48‐90 years), in BPH, the mean age was 70 years (56‐89), and in HPIN, the mean age was 65 years (49‐79). Tumour volume percentage was classified into two groups based on the mean of tumour volume percentage: <36 and > 36 (ranged 5‐100%), and among 116 PCa samples, 68 (58.6%) had < 36 and 48(41.4%) > 36. The serum PSA levels were grouped as < 4, 4‐10 and > 10 ng/mL (ranged 1.3‐352, median 9.35 ng/mL). Of the 76 PCa cases, 3 (3.9%) had a PSA level of < 4 ng/mL, 40 (52.6%) 4‐10 and 33 (43.4%) > 10.
The pathological PCa grade was characterized by the Gleason scores (Gs), which are categorized as Gs 6, indicating well‐differentiated, 7 (3 + 4) moderately differentiated, 7 (4 + 3) moderately‐poorly differentiated, 8 poorly differentiated and 9‐10 undifferentiated tumours.30 Of the 137 PCa cases, 50 (36.5%) showed Gs 6, 40 (29.2%) Gs 7 (3 + 4), 21 (15.3%) Gs 7 (4 + 3), 13 (9.5%) Gs 8 and 13 (9.5%) Gs 9‐10. In terms of pTNM staging data out of 107 PCa cases, 62 (57.9%) were classified as pT2, 44 (41.1%) as pT3 and 1 (0.9%) as pT4. All the clinical characteristics of the PCa patients and tumour involvement into adjacent tissues as well as surgical margins, perineural and vascular invasion data are shown in Tables 1 and 2.
Table 1.
Association between MMP‐13 and TLR‐9 expressions (intensity, percentage of positive cells and H‐score) and clinicopathological parameters of PCa cases (P‐value, Pearson's chi‐square test)
| Patient and tumour characteristics | No (%) | MMP‐13 expression | TLR‐9 expression | ||||
|---|---|---|---|---|---|---|---|
| Intensity | % of positive cells | H‐score (cut‐off = 191) | Intensity | % of positive cells | H‐score (cut‐off = 212) | ||
| Age | |||||||
| <66 | 76 (55.5) | 0.57 | 0.68 | 0.22 | 0.56 | 0.62 | 0.52 |
| >66 | 61 (44.5) | ||||||
| Total | 137 | ||||||
| Tumour volume (%) | |||||||
| <36 | 68 (58.6) | 0.44 | 0.87 | 0.56 | 0.37 | 0.58 | 0.31 |
| >36 | 48 (41.4) | ||||||
| Total | 116 | ||||||
| Unknown | 21 | ||||||
| PSA (ng/mL) | |||||||
| <4 | 3(3.9) | ||||||
| 4‐10 | 40(52.6) | 0.26 | 0.55 | 0.64 | 0.88 | 0.83 | 0.95 |
| >10 | 33(43.4) | ||||||
| Total | 76 | ||||||
| Unknown | 61 | ||||||
| Gleason scores | |||||||
| Gs 6 | 50 (36.5) | ||||||
| Gs 7(3 + 4) | 40 (29.2) | <0.001 | 0.87 | 0.002 | 0.45 | 0.46 | 0.14 |
| Gs7(4 + 3) | 21 (15.3) | ||||||
| Gs 8 | 13 (9.5) | ||||||
| Gs 9‐10 | 13 (9.5) | ||||||
| Total | 137 | ||||||
| pTNM system | |||||||
| pT2 | 62 (57.9) | ||||||
| pT3 | 44 (41.1) | 0.15 | 0.96 | 0.4 | 0.54 | 0.91 | 0.34 |
| pT4 | 1 (0.9) | ||||||
| Total | 107 | ||||||
| Unknown | 30 | ||||||
Values in bold are significant
Table 2.
Association between MMP‐13 and TLR‐9 expressions (intensity of staining, percentage of positive cells and H‐score) with surgical margin, regional lymph node, perineural invasion, seminal vesicles and vasa deferentia, and vascular invasion (P‐value, Pearson's chi‐square test)
| Patient and tumour characteristics | N(%) | MMP‐13 expression | TLR‐9 expression | ||||
|---|---|---|---|---|---|---|---|
| Intensity | % of positive cells | H‐score (cut‐off = 191) | Intensity | % of positive cells | H‐score (cut‐off = 212) | ||
| Surgical margin | |||||||
| Presence | 66 (65.3) | ||||||
| Absence | 35 (34.7) | 0.87 | 0.46 | 0.17 | 0.83 | 0.46 | 0.39 |
| Total | 101 | ||||||
| Unknown | 36 | ||||||
| Regional lymph node involvement | |||||||
| Presence | 7 (6.7) | 0.2 | 0.77 | 0.13 | 0.13 | 0.86 | 0.04 |
| Absence | 98 (93.3) | ||||||
| Total | 105 | ||||||
| Unknown | 32 | ||||||
| Perineural invasion | |||||||
| Presence | 115 (93.5) | ||||||
| Absence | 8 (6.5) | ||||||
| Total | 123 | ||||||
| Unknown | 14 | 0.53 | 0.38 | 0.34 | 0.07 | 0.83 | 0.17 |
| Seminal vesicles and vasa deferentia involvement | |||||||
| Presence | 20 (19.6) | 0.73 | 0.56 | 0.4 | |||
| Absence | 82 (80.4) | 0.25 | 0.61 | 0.16 | |||
| Total | 102 | ||||||
| Unknown | 35 | ||||||
| Vascular invasion | |||||||
| Presence | 5 (5.7) | ||||||
| Absence | 83 (94.3) | 0.1 | 0.007 | 0.67 | 0.42 | 0.98 | 0.21 |
| Total | 88 | ||||||
| Unknown | 49 | ||||||
Values in bold are significant
3.2. TLR‐9 expression in the studied groups and association with clinicopathological parameters
Immunostaining for TLR‐9 expression was predominantly localized in the cytoplasm of tumour cells. Of 137 PCa samples, 19 (13.9%) cases showed a weak intensity of staining, 68 (49.6%) moderate and 50 (36.5%) strong (Figure 1A‐D). Of the 18 HPIN tissues, 4 (22.2%) cases showed weak intensity, 12 (66.7%) moderate and 2 (11.1%) strong (Figure 1F). Of the 25 BPH samples, weak, moderate and high intensities were shown in 13 (52%), 12 (48%) and no cases respectively (Figùre 1E). Based on the independent sample t test, a significant difference was observed between the TLR‐9 expressions in PCa and BPH groups (P < 0.001) as well as in BPH and HPIN groups (P = 0.001; Figure 2A). Further analysis based on ROC curve analysis showed an AUC of 0.8 for TLR‐9 expression in PCa vs BPH (Figure 2C), and 0.76 in HPIN vs BPH (Figure 2E).
Figure 1.
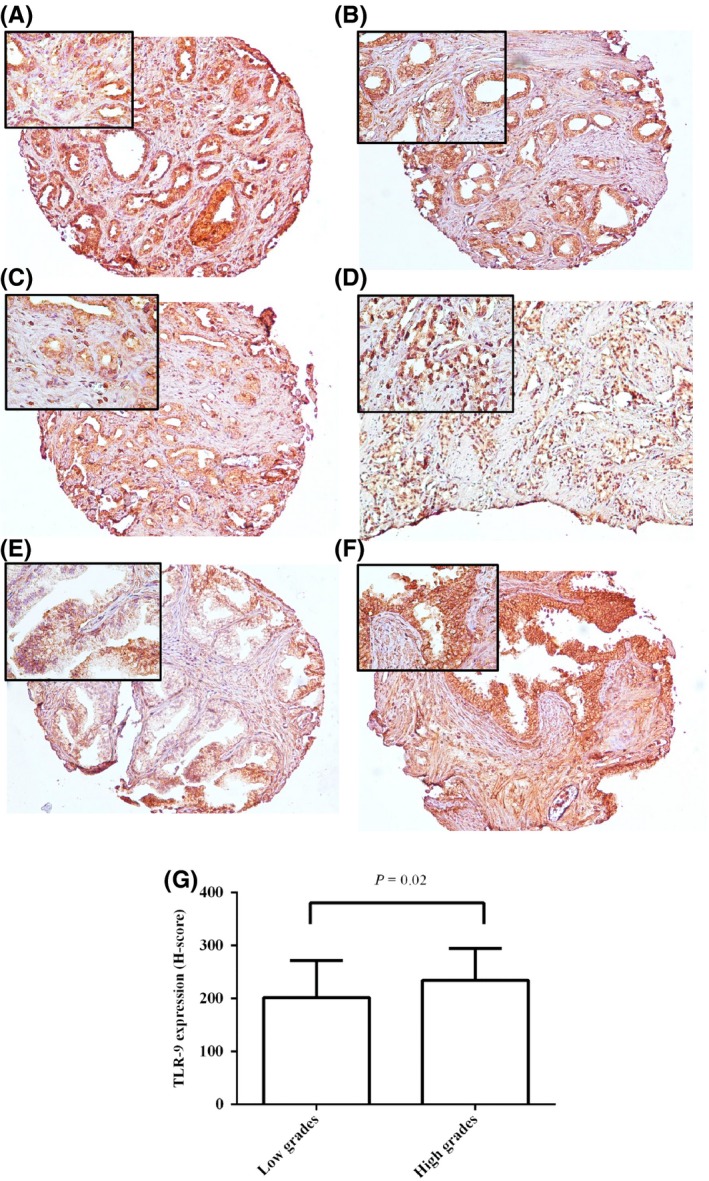
Staining pattern of TLR‐9 expression in cores (A, B and C) and needle biopsy (D) of PCa tissues with pathological different grades of tumour, BPH core (E) and HPIN (F). A, high intensity (low grade, Gs 3 + 4); B, moderate (low grade, Gs 3 + 4); C, weak (high grade, Gs 4 + 3), D, high (high grade, Gs 5 + 5); E, weak and F, moderate. Left upper corner of each image is same figure with higher magnification (original magnification × 100). G, Immunohistochemical analysis of TLR‐9 expression with pathological grade of tumour (Gs) (Pearson's chi‐square test) [Colour figure can be viewed at wileyonlinelibrary.com]
Figure 2.
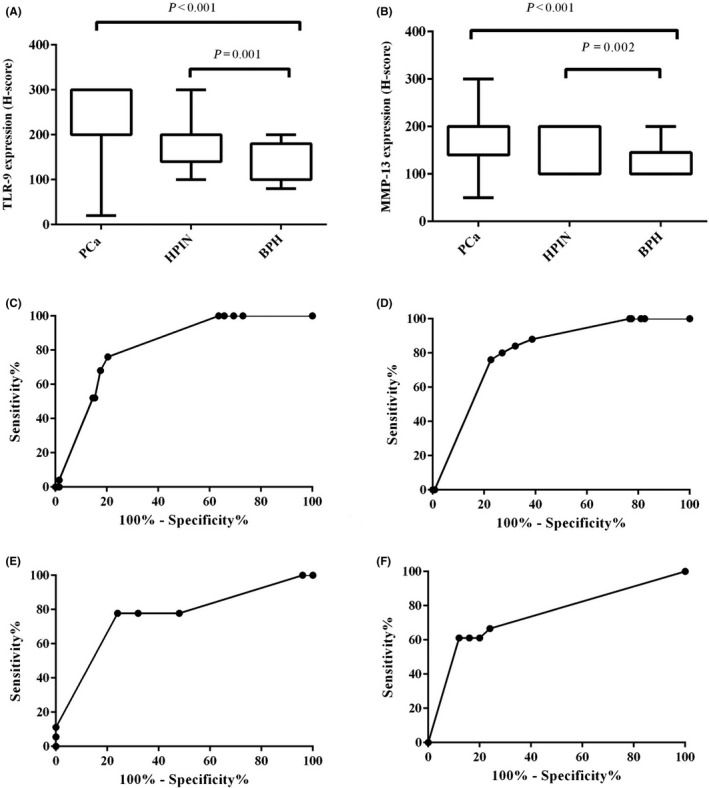
Immunohistochemical analysis of MMP‐13 expression (A) and TLR‐9 expression (B) in studied groups, including PCa, HPIN and BPH (independent sample t test). ROC curve analysis represent TLR‐9 expression in PCa vs BPH (C, AUC = 0.8, 95% CI: 0.7‐0.8), MMP‐13 expression in PCa vs BPH (D, AUC = 0.8, 95% CI:0.7‐0.8), TLR‐9 expression in HPIN vs BPH (E, AUC = 0.76, 95% CI :0.6‐0.9) and MMP‐13 expression in HPIN vs BPH (F, AUC = 0.74, 95% CI: 0.5‐0.9). CI: confidence interval
Univariate analysis showed a significant correlation between TLR‐9 expression and regional lymph node involvement (P = 0.04). However, TLR‐9 expression was not correlated with the level of serum PSA in PCa cases and also other tumour characteristics, including Gs, pTNM stage, vascular invasion and tumour invasion to adjacent tissues (Tables 1 and 2). On the other hand, when we classified the tumours according to low (Gs 6, 7(3 + 4)) and high (Gs 7(4 + 3)‐10) grades into two groups, a higher expression of TLR‐9 was significantly detected in high grades than in low grades (P = 0.02; Figure 1G).
3.3. MMP‐13 expression in the studied groups and association with clinicopathological parameters
Immunostaining for MMP‐13 expression was predominantly localized in the cytoplasm of tumour cells. Of 137 PCa samples, weak, moderate and high intensities of staining were shown in 31 (22.6%), 74 (54%) and 32 (23.4%) cases respectively (Figure 3A‐D). Of the 18 HPIN tissues, 6 (33.3%) had weak staining, 12 (66.7%) had moderate staining, and no case had high staining (Figure 3F). Of the 25 BPH samples, weak, moderate, and high intensities were shown in 19 (76%), 5 (20%) and 1(4%) cases respectively (Figure 3E). Based on the independent sample t test, a significant difference was observed between the MMP‐13 expressions in PCa and BPH groups (P < 0.001) as well as in BPH with HPIN groups (P = 0.002; Figure 2B). Further analysis based on ROC curve analysis showed an AUC of 0.8 for MMP‐13 expression in PCa vs BPH (Figure 2D), and 0.74 in HPIN vs BPH (Figure 2F). These data indicated that there were the difference and discrimination for TLR‐9 and MMP‐13 expressions between PCa patients and BPH as well as HPIN and BPH.
Figure 3.
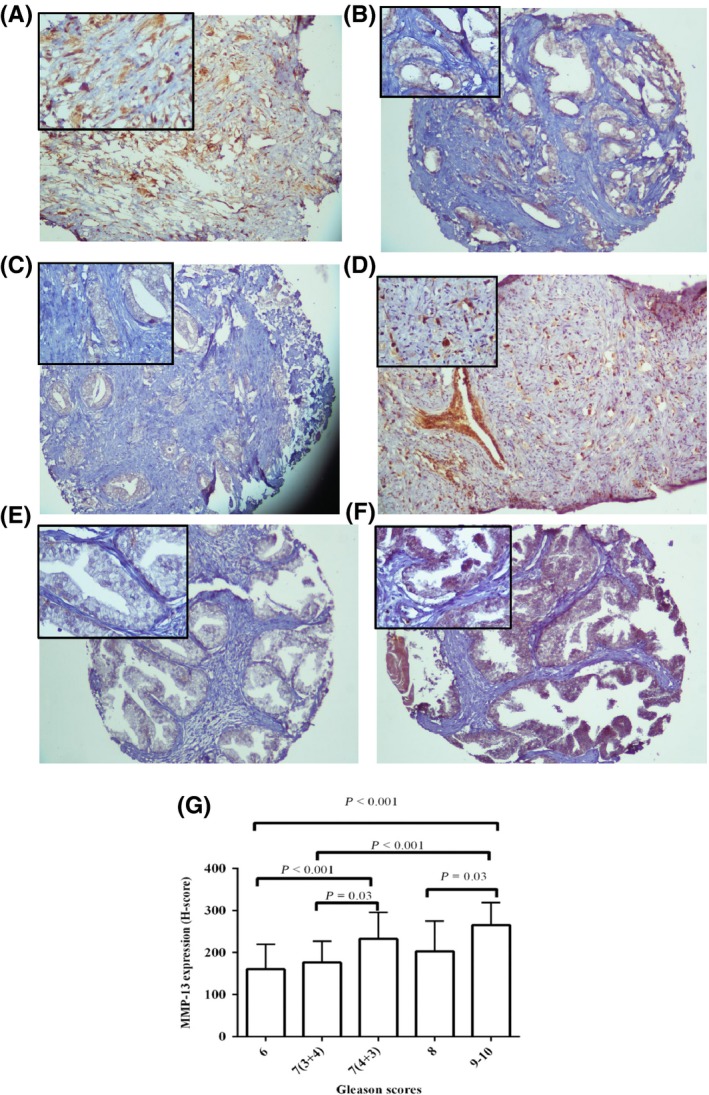
Staining pattern of MMP‐13 expression in cores (A, B and C) and needle biopsy (D) of PCa tissues with pathological different grades of tumour, BPH core (E) and HPIN (F). A, high intensity (high grade, Gs 4 + 4); B, moderate (low grade, Gs 3 + 4); C, weak (low grade, Gs 3 + 4); D, high (high grade, Gs 4 + 5); E, weak and F, moderate. Left upper corner of each image is same figure with higher magnification (original magnification × 100). G, Immunohistochemical analysis of MMP‐13 expression with pathological grade of tumour (Gs) (one‐way ANOVA; Scheffe's post hoc analysis) [Colour figure can be viewed at wileyonlinelibrary.com]
Univariate analysis showed a highly significant correlation between MMP‐13 expression and the Gs in PCa cases (P < 0.001; Figure 3G). In line with these data, there was a strong correlation between MMP‐13 expression with Gs classified into low‐grade Gs (6, 7 (3 + 4)) and high‐grade Gs (7 (4 + 3), 8‐10; P < 0.001). To compare differences between the MMP‐13 expression within the Gs subgroups (Gs 6, 7 (3 + 4), 7 (4 + 3) and 8‐10), we used the Scheffe post hoc comparisons, indicating a high significant difference between Gs 6 with 9‐10 and 7 (4 + 3) as well as Gs 7 (3 + 4) with 9‐10 (all, P < 0.001; Figure 3G).
However, MMP‐13 expression was not correlated with the level of serum PSA in PCa cases and also other tumour characteristics, including pTNM stage, lymph node involvement and tumour invasion to adjacent tissues (Tables 1 and 2).
3.4. Combined Analysis of TLR‐9/MMP‐13 Expressions
Comparing the expression patterns of TLR‐9 and MMP‐13 markers demonstrated a reciprocal significant correlation between the two markers in the same series of prostate samples (P < 0.001; Figure 4A). The expression of TLR‐9 and MMP‐13 phenotypes was classified into 4 subgroups; among 137 PCa cases, 41 (29.2%) showed TLR‐9 high(h)/MMP‐13 h phenotype, 5(3.6%) TLR‐9 h/MMP‐13 low (l), 45(32.8%) TLR‐9 l/MMP‐13 h and 46(33.6%) TLR‐9 l/MMP‐13 l. Of 25 BPH samples, 3(12%) cases showed TLR‐9 l/MMP‐13 h phenotype and 22(88%) TLR‐9 l/MMP‐13 l. Of 18 HPIN cases, 2(11.1%) showed TLR‐9 h/MMP‐13 h phenotype, 9(50%) TLR‐9 l/MMP‐13 h and 7 (38.9%) TLR‐9 l/MMP‐13 l (Figure 4B). The one‐way ANOVA and Scheffe's post hoc analysis were used to examine the correlation between expressions of TLR‐9/MMP‐13 phenotypes and clinicopathological parameters. The analysis showed a significant correlation between TLR‐9/MMP‐13 phenotypes (TLR‐9 h/MMP‐13 h and TLR‐9 h/MMP‐13 h) and Gs (P = 0.002). There was no significant association between the expression of TLR‐9/MMP‐13 phenotypes and other clinicopathological variables (Table 3).
Figure 4.
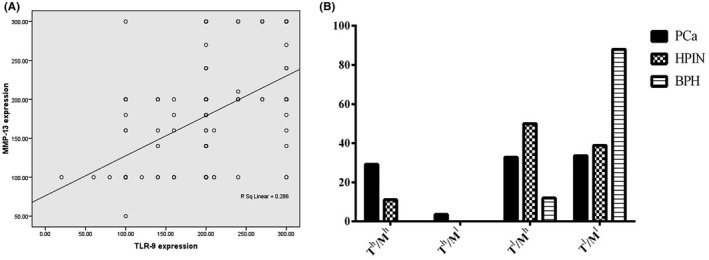
Correlation depicted as scatters between TLR‐9 and MMP‐13 expressions in PCa, HPIN and BPH cases (A). Distribution percentage of various TLR‐9/MMP‐13 phenotypes in different patient groups, including PCa, HPIN and BPH tissues (B). Th: TLR‐9 high, Tl: TLR‐9 low, Mh: MMP‐13 high and Ml: MMP‐13low
Table 3.
Association between TLR‐9 (T)/MMP‐13(M) phenotypes and clinicopathological parameters in PCa cases (P‐value, Pearson's chi‐square test)
| Tumour characteristic | Phenotypes of TLR‐9/MMP‐13 expression, N (%) | ||||
|---|---|---|---|---|---|
| Th/Mh | Th/Ml | Tl/Mh | Tl/Ml | P‐value | |
| Age | |||||
| <66 | 24 (17.5) | 1 (0.7) | 22 (16.1) | 28 (20.4) | 0.2 |
| >66 | 17 (12.4) | 4 (2.9) | 23 (16.8) | 18 (13.1) | |
| Gleason score | |||||
| 6 | 10 (7.3) | 2 (1.5) | 12 (8.8) | 26 (19) | 0.002 |
| 7(3 + 4) | 9 (6.6) | 3 (2.2) | 17 (12.4) | 11 (8) | |
| 7(4 + 3) | 9 (6.6) | 0 | 8 (5.8) | 4 (2.9) | |
| 8 | 5 (3.6) | 0 | 4 (2.9) | 4 (2.9) | |
| 9‐10 | 8 (5.8) | 0 | 4 (2.9) | 1 (0.7) | |
| PSA level (ng/mL) | |||||
| <4 | 1 (1.3) | 0 (0) | 0 (0) | 2 (2.6) | 0.93 |
| 4‐10 | 10 (13.2) | 2 (2.6) | 11 (14.5) | 17 (22.4) | |
| >10 | 3 (13.2) | 1 (1.3) | 9 (11.8) | 13 (17.1) | |
| pTNM staging | |||||
| pT2 | 15 (14) | 3 (2.8) | 20 (18.7) | 24 (22.4) | 0.7 |
| pT3 | 16 (15) | 1 (0.9) | 12 (11.2) | 15 (14) | |
| pT4 | 0 | 0 | 0 | 1 (0.9) | |
| Surgical margin | |||||
| Presence | 8 (8) | 3 (3) | 8 (8) | 14 (14) | 0.2 |
| Absence | 22 (22) | 1 (1) | 21 (2) | 23 (23) | |
| Regional lymph node involvement | |||||
| Presence | 5 (4.8) | 0 | 1(1) | 1 (1) | 0.09 |
| Absence | 26 (24.8) | 4 (3.8) | 32(30.5) | 36 (34) | |
| Perineural invasion | |||||
| Presence | 35 (28.5) | 5 (4.1) | 40 (32.5) | 35 (28.5) | 0.55 |
| Absence | 1 (0.8) | 0 | 3 (2.4) | 4 (3.3) | |
| Seminal vesicles and vasa deferentia involvement | |||||
| Presence | 8 (7.8) | 0 | 6 (5.9) | 6 (5.9) | 0.55 |
| Absence | 23 (22.5) | 4 (3.9) | 23 (22.5) | 32 (31.4) | |
Values in bold are significant
4. DISCUSSION
Our immunohistochemical analysis of TLR‐9 and MMP‐13 markers in a large series of prostate tissues, including PCa, HPIN and BPH tissues, showed different expression patterns, from weak to strong staining, so that there was the discrimination for TLR‐9 and MMP‐13 expressions between PCa patients and BPH as well as HPIN and BPH.
Most cases of carcinogenic tissues are characterized by increased expression of MMP‐13. MMP‐13 is expressed primarily by the tumour cells and is elevated in inflammatory conditions.31 Studies indicated that MMP‐13 expression is extensively related to the development and progression of colorectal cancer.32, 33 Escaff et al34 found that MMP‐13 was expressed by tumour cells in PCa and could strongly correlate with biochemical recurrence; however, its expression was weak in high‐grade PCa. This previous study did not directly investigate MMP‐13 expression with well‐ or poor‐differentiated feature of tumour in prostate tissues by immunohistochemical analysis via obtaining H‐score, while our results indicated that MMP‐13 was highly expressed in poorly and undifferentiated tumours, but well and moderately differentiated tumours showed a lower level of expression. Morgia et al35 demonstrated that a higher concentration of MMP‐13 was observed in plasma of metastatic PCa patients and was predominantly decreased after therapy. In line with these data, we investigated tumour invasion into adjacent areas of the prostate with MMP‐13 expression; however, no significant association was found between the spread of tumour and MMP‐13 expression. Nevertheless, one of the reasons might be that the data for all patients about tumour involvement into adjacent areas was not available and further investigations are required to investigate these factors. In general, the various patterns of MMP‐13 expression in PCa vs BPH, the significant association of its expression with tumour malignancy grade; and its relationship with biochemical recurrence 34 support the notion that there is a pattern of MMP‐13 expression that corrrelates with poor prognosis in PCa.
In another part of this study, our findings showed an overexpression of TLR‐9 in PCa tissues and HPIN compared with BPH samples. Interestingly, overexpression of TLR‐9 is associated with the spread of the tumour to the regional lymph node and immunohistochemical staining confirms it, suggesting TLR‐9 is involved in the PCa invasion and hence in prognosis. In line with these data, Luo et al36 reported that upregulation of TLR‐9 was associated with a higher probability of lymph node metastasis and poor prognosis. Our results did not distinguish the upregulation of TLR‐9 in well, moderately (Gs 6 and 7), poorly differentiated (Gs 8) and undifferentiated (Gs 9‐10) PCa patients, but when the tumours were classified into two groups according to low (Gs 6, 7(3 + 4)) and high (Gs 7(4 + 3)‐10) grades. However, higher expression of TLR‐9 was detected in poorly differentiated or undifferentiated than well or moderately differentiated PCa patients. Previously Va¨isa¨nen et al. reported that there was no significant correlation between TLR‐9 expression between well and poorly differentiated PCa.17, 37 Conversely, Gonzalez‐Reyes and Luo et al. found a significant association between the TLR‐9 expression and Gs and showed its expression was correlated significantly with a higher probability of biochemical recurrence.36, 38 The discrepancy found in these results could be due to the diversity of tumour histotypes and their heterogeneity and to selective of areas of tumour when taking core biopsies cores; however, various expression of TLR‐9 in PCa and HPIN in comparison with BPH, as well as its association with biochemical recurrence, could be considered as a prognostic factor.38
Our results did not show any significant difference in TLR‐9 and MMP‐13 expression between PCa and HPIN. These findings indicate that these two markers may not be suitable as markers for the differentiation of HPIN and PCa. However, there was a significant difference in both TLR‐9 and MMP‐13 expressions between BPH and HPIN. These results enhance the discriminatory role of TLR‐9 and MMP‐13 expressions between precancerous tissues and benign hyperplastic tissues as well as cancerous tissues and benign hyperplastic tissues.
Moreover, we attempted to identify different phenotypes of prostate tissues with regard to TLR‐9 and MMP‐13 expressions in PCa, HPIN and BPH groups. It has been shown that stimulation of PCa cells expressing TLR‐9 with synthetic TLR‐9 ligands (CpG sequence‐containing oligonucleotides) promotes migration and invasion of cells through MMP‐13 production, such that no an effect was found in PCa cells lacking TLR‐9 expression.24 In addition, in vitro studies demonstrated that silencing of TLR‐9 inhibited the migration and invasion of PC‐3 cells, indicating expression of TLR‐9 is involved in the migration and invasion of cancer cells.36 It has been also reported that TLR‐9 expression may regulate cancer cell invasion, even in the absence of ligands in breast cancer cells.39
Although previous immunopathological studies did not show the association between TLR‐9 and MMP‐13 in series of PCa tissues, in vitro study revealed that TLR‐9 may be involved in promoting the invasion of PCa cells through MMP‐13.24 In the present study, we compared the significance of TLR‐9 and MMP‐13 co‐expression in clinical samples in PCa, HPIN and BPH. The highest percentage among PCa samples was allocated to TLR‐9 l/MMP‐13 l phenotype with 33.6% cases, followed by TLR‐9 l/MMP‐13 h with 32.8% and TLR‐9 h/MMP‐13 h with 29.2%. In contrast, the lowest percentage was allocated to TLR‐9 h/MMP‐13 l phenotype with 3.6%. In addition, statistical analysis showed that there is a bivariate correlation between TLR‐9 and MMP‐13 expressions in prostate samples so that the expression of these two markers can have an interaction with each other. These immunopathological data were in line with the previous in vitro study that showed the stimulation of TLR‐9 could increase the invasion of PCa cells by upregulating MMP‐13 expression.24 However, 32% of PCa samples had TLR‐9 l/MMP‐13 h phenotype and 5% TLR‐9 h/MMP‐13 l. This contradiction may have different causes: (a) most of the samples were TMA cores, and thus, all of the tumour areas had not been selected; and (b) it other factors such as survival, metastasis, castration‐resistant PCa, biochemical recurrence need to be investigated and correlated in future studies.
TLR‐9 staining has been detected in the plasma membrane, cytoplasm and nucleus of various lung cells by immuno‐electron microscopy.38 MMP‐13 expression was found in the cytoplasm of tumour cells. In addition, its expression as nuclear staining was occasionally identified in normal epithelium adjacent to tumour cells.39 In the current study, the staining pattern of TLR‐9 and MMP‐13 in BPH, HPIN and PCa was cytoplasmic. Interestingly, in higher grades of malignancy (Gs 4 + 5 and 5 + 5), the tissues were mostly stained for both TLR‐9 and MMP‐13 expressions as nuclear staining with the highest intensity of colouring. It is suggested that intensity of staining and severe malignancy transformation can change the staining pattern and consider as a distinctive feature of the highest grades of Gs compared to other Gleason grades.
Taken together, the strength of the association between pathologic grade of tumour and immunoreactive MMP‐13 scoring as well as TLR‐9/MMP‐13 co‐expression can augment the competence of these markers for diagnostic and prognostic application in PCa. It is suggested that the changes in TLR‐9 expression can influence the MMP‐13 expression in PCa tissues and vice versa; however, there are still some ambiguities in clinical significance of TLR‐9 and MMP‐13 expression levels that require further studies.
5. CONCLUSION
It has been shown that TLR‐9 and MMP‐13 were highly expressed in PCa and HPIN compared to BPH. MMP‐13 was identified as an indirect prognostic marker for PCa; however, additional studies are required to evaluate MMP‐13 as poor prognostic factor for PCa. Furthermore, our data revealed here the clinical importance of TLR‐9 and MMP‐13 co‐expression in PCa and highlighted opportunities for the development of new diagnostic and therapeutic strategies in further investigations of the mechanisms that are implicated by this co‐expression.
CONFLICT OF INTEREST
The authors declare that they have no conflict of interest.
ACKNOWLEDGEMENTS
This study was conducted as a research project and supported by a grant from Iran University of Medical Sciences (grant number #31‐29737).
Kalantari E, Abolhasani M, Roudi R, et al. Co‐expression of TLR‐9 and MMP‐13 is associated with the degree of tumour differentiation in prostate cancer. Int. J. Exp. Path. 2019;100:123 132. 10.1111/iep.12314
References
- 1. Satkunasivam R, Kim AE, Desai M, Nguyen MM, Quinn DI, Ballas L, et al. Radical prostatectomy or external beam radiation therapy vs no local therapy for survival benefit in metastatic prostate cancer: a SEER‐Medicare analysis. J Urol. 2015;194(2):378‐385. [DOI] [PMC free article] [PubMed] [Google Scholar]
- 2. Mohsenzadegan M, Tajik N, Madjd Z, Shekarabi M, Farajollahi MM. Study of NGEP expression in androgen sensitive prostate cancer cells: a potential target for immunotherapy. Med J Islam Repub Iran. 2015a;29:159. [PMC free article] [PubMed] [Google Scholar]
- 3. Mohsenzadegan M, Seif F, Farajollahi MM, Khoshmirsafa M. Anti‐Oxidants as Chemopreventive Agents in Prostate Cancer: a Gap Between Preclinical and Clinical Studies. Recent Pat Anti‐Cancer Drug Discovery. 2018a;13(2):224‐239. [DOI] [PubMed] [Google Scholar]
- 4. Diakos CI, Charles KA, McMillan DC, Clarke SJ. Cancer‐related inflammation and treatment effectiveness. Lancet Oncol. 2014;15(11):e493‐e503. [DOI] [PubMed] [Google Scholar]
- 5. Francescone R, Hou V, Grivennikov SI. Microbiome, inflammation and cancer. Cancer J. 2014;20(3):181. [DOI] [PMC free article] [PubMed] [Google Scholar]
- 6. Payne JK, editor. State of the science: stress, inflammation, and cancer. Oncol Nurs Forum 2014;41:533‐540. [DOI] [PubMed] [Google Scholar]
- 7. Mohsenzadegan M, Saebi F, Yazdani M, Abolhasani M, Saemi N, Jahanbani F, et al. Autoantibody against new gene expressed in prostate protein is traceable in prostate cancer patients. Biomark Med. 2018b;12(10):1125‐1138. [DOI] [PubMed] [Google Scholar]
- 8. Liu S, Li X, Lu Y, Zhang Y, Zhang D. Toll‐like Receptors and Inflammatory Bowel Disease. Front Immunol. 2018;9:72. [DOI] [PMC free article] [PubMed] [Google Scholar]
- 9. Sharifi L, Mohsenzadegan M, Aghamohammadi A, Rezaei N, Tofighi FZ, Bokaie S, et al. Immunomodulatory effect of G2013 (aL‐Guluronic acid) on the TLR2 and TLR4 in human mononuclear cells. Curr Drug Discov Technol. 2017a;15(2):123‐131. [DOI] [PubMed] [Google Scholar]
- 10. Mahla RS, Reddy MC, Prasad DVR, Kumar H. Sweeten PAMPs: role of sugar complexed PAMPs in innate immunity and vaccine biology. Front Immunol. 2013;4:248. [DOI] [PMC free article] [PubMed] [Google Scholar]
- 11. Sharifi L, Tavakolinia N, Kiaee F, Rezaei N, Mohsenzadegan M, Azizi G, et al. A review on defects of dendritic cells in common variable immunodeficiency. Endocr Metab Immune Disord Drug Targets. 2017b;17(2):100‐113. [DOI] [PubMed] [Google Scholar]
- 12. Miyake K, Shibata T, Ohto U, Shimizu T, Saitoh S‐I, Fukui R, et al. Mechanisms controlling nucleic‐acid‐sensing Toll‐like receptors. Int Immunol. 2018;30:43‐51. [DOI] [PubMed] [Google Scholar]
- 13. Chang Y‐J, Wu M‐S, Lin J‐T, Chen C‐C. Helicobacter pylori‐induced invasion and angiogenesis of gastric cells is mediated by cyclooxygenase‐2 induction through TLR2/TLR9 and promoter regulation. J Immunol. 2005;175(12):8242‐8252. [DOI] [PubMed] [Google Scholar]
- 14. Schneberger D, Caldwell S, Kanthan R, Singh B. Expression of Toll‐like receptor 9 in mouse and human lungs. J Anat. 2013;222(5):495‐503. [DOI] [PMC free article] [PubMed] [Google Scholar]
- 15. Yu R, Yang B, Chi X, Cai L, Liu C, Yang L, et al. Efficacy of cytokine‐induced killer cell infusion as an adjuvant immunotherapy for hepatocellular carcinoma: a systematic review and meta‐analysis. Drug Des Devel Ther. 2017;11:851. [DOI] [PMC free article] [PubMed] [Google Scholar]
- 16. Karki K, Pande D, Negi R, Khanna S, Khanna RS, Khanna HD. Expression of serum toll‐like receptor 9 and oxidative damage markers in benign and malignant breast diseases. DNA Cell Biol. 2014;33(9):630‐636. [DOI] [PubMed] [Google Scholar]
- 17. Väisänen MR, Väisänen T, Jukkola‐Vuorinen A, Vuopala KS, Desmond R, Selander KS, et al. Expression of toll‐like receptor‐9 is increased in poorly differentiated prostate tumors. Prostate. 2010;70(8):817‐824. [DOI] [PubMed] [Google Scholar]
- 18. Alaseem A, Alhazzani K, Dondapati P, Alobid S, Bishayee A, Rathinavelu A, editors. Matrix metalloproteinases: a challenging paradigm of cancer management. Semin Cancer Biol 2017;16: S1044‐579X(17):30184‐0. [DOI] [PubMed] [Google Scholar]
- 19. Kudo Y, Iizuka S, Yoshida M, Tsunematsu T, Kondo T, Subarnbhesaj A, et al. Matrix metalloproteinase‐13 (MMP‐13) directly and indirectly promotes tumor angiogenesis. J Biol Chem. 2012;287(46):38716‐38728. [DOI] [PMC free article] [PubMed] [Google Scholar]
- 20. Luukkaa M, Vihinen P, Kronqvist P, Vahlberg T, Pyrhönen S, Kähäri VM, et al. Association between high collagenase‐3 expression levels and poor prognosis in patients with head and neck cancer. Head Neck. 2006;28(3):225‐234. [DOI] [PubMed] [Google Scholar]
- 21. Elnemr A, Yonemura Y, Bandou E, Kinoshita K, Kawamura T, Takahashi S, et al. Expression of collagenase‐3 (matrix metalloproteinase‐13) in human gastric cancer. Gastric Cancer. 2003;6(1):0030‐0038. [DOI] [PubMed] [Google Scholar]
- 22. Foda AA‐RM, El‐Hawary AK, Abdel‐Aziz A. Matrix metalloproteinase‐13 expression in the progression of colorectal adenoma to carcinoma. Tumor Biol 2014;35(6):5653‐5658. [DOI] [PubMed] [Google Scholar]
- 23. Kotepui M, Punsawad C, Chupeerach C, Songsri A, Charoenkijkajorn L, Petmitr S. Differential expression of matrix metalloproteinase‐13 in association with invasion of breast cancer. Contemp Oncol. 2016;20(3):225. [DOI] [PMC free article] [PubMed] [Google Scholar]
- 24. Ilvesaro JM, Merrell MA, Swain TM, Davidson J, Zayzafoon M, Harris KW, et al. Toll like receptor‐9 agonists stimulate prostate cancer invasion in vitro. Prostate. 2007;67(7):774‐781. [DOI] [PubMed] [Google Scholar]
- 25. Cheng L, Montironi R, Bostwick DG, Lopez‐Beltran A, Berney DM. Staging of prostate cancer. Histopathology. 2012;60(1):87‐117. [DOI] [PubMed] [Google Scholar]
- 26. Epstein JI, Egevad L, Amin MB, Delahunt B, Srigley JR, Humphrey PA, et al. The 2014 International Society of Urological Pathology (ISUP) consensus conference on Gleason grading of prostatic carcinoma: definition of grading patterns and proposal for a new grading system. Am J Surg Pathol. 2016;40(2):244‐252. [DOI] [PubMed] [Google Scholar]
- 27. Mohsenzadegan M, Madjd Z, Asgari M, Abolhasani M, Shekarabi M, Taeb J, et al. Reduced expression of NGEP is associated with high‐grade prostate cancers: a tissue microarray analysis. Cancer Immunol Immunother. 2013;62(10):1609‐1618. [DOI] [PMC free article] [PubMed] [Google Scholar]
- 28. Pierorazio PM, Walsh PC, Partin AW, Epstein JI. Prognostic Gleason grade grouping: data based on the modified Gleason scoring system. BJU Int. 2013;111(5):753‐760. [DOI] [PMC free article] [PubMed] [Google Scholar]
- 29. Mohsenzadegan M, Shekarabi M, Madjd Z, Asgari M, Abolhasani M, Tajik N, et al. Study of NGEP expression pattern in cancerous tissues provides novel insights into prognostic marker in prostate cancer. Biomark Med. 2015b;9(4):391‐401. [DOI] [PubMed] [Google Scholar]
- 30. Fine SW, Amin MB, Berney DM, Bjartell A, Egevad L, Epstein JI, et al. A contemporary update on pathology reporting for prostate cancer: biopsy and radical prostatectomy specimens. Eur Urol. 2012;62(1):20‐39. [DOI] [PubMed] [Google Scholar]
- 31. Rath T, Roderfeld M, Graf J, Wagner S, Vehr A‐K, Dietrich C, et al. Enhanced expression of MMP‐7 and MMP‐13 in inflammatory bowel disease: a precancerous potential? Inflamm Bowel Dis. 2006;12(11):1025‐1035. [DOI] [PubMed] [Google Scholar]
- 32. Wernicke A‐K, Churin Y, Sheridan D, Windhorst A, Tschuschner A, Gattenlöhner S, et al. Matrix metalloproteinase‐13 refines pathological staging of precancerous colorectal lesions. Oncotarget. 2016;7(45):73552. [DOI] [PMC free article] [PubMed] [Google Scholar]
- 33. Miao C, Ren Y, Chen M, Wang Z, Wang T. Microcystin‐LR promotes migration and invasion of colorectal cancer through matrix metalloproteinase‐13 up‐regulation. Mol Carcinog. 2016;55(5):514‐524. [DOI] [PubMed] [Google Scholar]
- 34. Escaff S, Fernández JM, González LO, Suárez A, González‐Reyes S, González JM, et al. Collagenase‐3 expression by tumor cells and gelatinase B expression by stromal fibroblast‐like cells are associated with biochemical recurrence after radical prostatectomy in patients with prostate cancer. World J Urol. 2011;29(5):657‐663. [DOI] [PubMed] [Google Scholar]
- 35. Morgia G, Falsaperla M, Malaponte G, Madonia M, Indelicato M, Travali S, et al. Matrix metalloproteinases as diagnostic (MMP‐13) and prognostic (MMP‐2, MMP‐9) markers of prostate cancer. Urol Res. 2005;33(1):44‐50. [DOI] [PubMed] [Google Scholar]
- 36. Luo Y, Jiang Q‐W, Wu J‐Y, Qiu J‐G, Zhang W‐J, Mei X‐L, et al. Regulation of migration and invasion by Toll‐like receptor‐9 signaling network in prostate cancer. Oncotarget. 2015;6(26):22564. [DOI] [PMC free article] [PubMed] [Google Scholar]
- 37. Va¨isa¨nen M‐R, Jukkola‐Vuorinen A, Vuopala KS, Selander KS, Vaarala MH. Expression of Toll‐like receptor‐9 is associated with poor progression‐free survival in prostate cancer. Oncol Lett 2013;5(5):1659‐1663. [DOI] [PMC free article] [PubMed] [Google Scholar]
- 38. González‐Reyes S, Fernández JM, González LO, Aguirre A, Suárez A, González JM, et al. Study of TLR3, TLR4, and TLR9 in prostate carcinomas and their association with biochemical recurrence. Cancer Immunol Immunother. 2011;60(2):217‐226. [DOI] [PMC free article] [PubMed] [Google Scholar]
- 39. Tuomela J, Sandholm J, Karihtala P, Ilvesaro J, Vuopala KS, Kauppila JH, et al. Low TLR9 expression defines an aggressive subtype of triple‐negative breast cancer. Breast Cancer Res Treat. 2012;135(2):481‐493. [DOI] [PubMed] [Google Scholar]