



Abstract
Objective:
Early changes in tumour behaviour following stereotactic radiosurgery) are potential biomarkers of response. To-date quantitative model-based measures of dynamic contrast-enhanced (DCE) and diffusion-weighted (DW) MRI parameters have shown widely variable findings, which may be attributable to variability in image acquisition, post-processing and analysis. Big data analytic approaches are needed for the automation of computationally intensive modelling calculations for every voxel, independent of observer interpretation.
Methods:
This unified platform is a voxel-based, multimodality architecture that brings complimentary solute transport processes such as perfusion and diffusion into a common framework. The methodology was tested on synthetic data and digital reference objects and consequently evaluated in patients who underwent volumetric DCE-CT, DCE-MRI and DWI-MRI scans before and after treatment. Three-dimensional pharmacokinetic parameter maps from both modalities were compared as well as the correlation between apparent diffusion coefficient (ADC) values and the extravascular, extracellular volume (Ve). Comparison of histogram parameters was done via Bland–Altman analysis, as well as Student’s t-test and Pearson’s correlation using two-sided analysis.
Results:
System testing on synthetic Tofts model data and digital reference objects recovered the ground truth parameters with mean relative percent error of 1.07 × 10⁻⁷ and 5.60 × 10⁻⁴ respectively. Direct voxel-to-voxel Pearson’s analysis showed statistically significant correlations between CT and MR which peaked at Day 7 for Ktrans (R = 0.74, p <= 0.0001). Statistically significant correlations were also present between ADC and Ve derived from both DCE-MRI and DCE-CT with highest median correlations found at Day 3 between median ADC and Ve,MRI values (R = 0.6, p < 0.01) The strongest correlation to DCE-CT measurements was found with DCE-MRI analysis using voxelwise T10 maps (R = 0.575, p < 0.001) instead of assigning a fixed T10 value.
Conclusion:
The unified implementation of multiparametric transport modelling allowed for more robust and timely observer-independent data analytics. Utility of a common analysis platform has shown higher correlations between pharmacokinetic parameters obtained from different modalities than has previously been reported.
Advances in knowledge:
Utility of a common analysis platform has shown statistically higher correlations between pharmacokinetic parameters obtained from different modalities than has previously been reported.
Introduction
Functional dynamic contrast-enhanced (DCE) and diffusion-weighted imaging (DWI) MRI techniques have seen a rapid growth in translation into radiation therapy clinical trials.1,2 However, both DWI and DCE-MRI measures of tumour physiology have shown heterogeneous results across studies.3 This in part reflects variability in MR acquisition across vendors, institutions and even individual acquisition time points but also variability in analysis approaches across institutions and across specific imaging studies (e.g. DWI vs DCE) within a single instituion.4–8 Given the potential for multimodal MRI imaging metrics to provide early indicators of therapy-induced changes in the tumour microenvironment, it is imperative to obtain a better understanding of these imaging biomarkers to guide adaptive and potentially individualized therapy approaches in the future. Considerable progress is also being made in terms of parameter standardization through phantom validation studies and DICOM standards across vendors through the Quantitative Imaging Network and Quantitative Imaging Biomarker Alliance (QIBA).9
For perfusion imaging applications specifically, reproducibility of either DCE-CT or DCE-MRI alone has been low and output parameters from either imaging technique have not correlated well.10,11 This has been the case even in direct comparisons of the same tumour, and in these situations, the variability in kinetic parameters has been attributed mostly to differences in contrast agents and tumour dynamics between DCE-CT and MRI.12,13 However, it can be argued that two other factors are perhaps equally important and have been overlooked to date: (1) Often, different kinetic models or model implementations are used for DCE-CT and MRI analysis despite both using low-molecular weight contrast agents; (2) notwithstanding advances in voxel-based DCE image acquisitions, analysis results are mostly reported and/or analysed as median values, hence losing the opportunity to investigate tumour heterogeneity and masking any correlations.
A four-dimensional temporal dynamic analysis (TDA) method, which enables voxel-based, parametric analysis based on patient-specific dynamic behaviour of contrast flow, might provide a standardizable approach for DCE-MRI analysis, and its validation against DCE-CT.14 It was shown that a TDA approach to DCE-CT pharmacokinetic modelling provides more robust measures of change in perfusion following stereotactic radiosurgery (SRS) for brain as well as liver lesions.15 Furthermore, enabling the use of this analysis method for describing the flow of low molecular weight contrast agents from both CT and MRI modalities has shown to be beneficial especially when done in the same patient.16
Now, given that both DCE and DWI modelling approaches probe the tumour microenvironment on a similar scale (3) and are clearly linked in its biomechanical description, we designed a multi-modal TDA-based architecture to analyse various complimentary solute transport processes in a common framework. The aim here was to allow for a direct, voxel-to-voxel comparison of tumour perfusion, permeability and diffusion parameters from registered DCECT, DCE-MRI and DWI-MRI data applying a shared pharmacokinetic perfusion model. The automatic calculation of quantitative parameters based on volumetric data facilitated voxel-based co-registration over multiple time points prior to image processing thereby allowing for the first time the generation of early voxel-based response maps following treatment in this group of brain metastases patients.
This differs from previous reports in breast and glioblastoma cancer patients which reported low correlations between ADC and Ve (ranging between 0.2 and 0.4 depending on the ADC model used) measured at baseline, i.e. without treatment interventions.17,18 The premise of anticipated correlation between ADC and Ve heavily relies on the accurate derivation of the extravascular extracellular space. It was hypothesized that (a) this unified approach would result in better correlations between parametric maps from DCE-CT and MRI than previously reported in other disease sites; and that (b) a high correlation would exist between the apparent diffusion coefficient (ADC) and extravascular extracellular volume fractions (Ve), given their physiological connection describing the diffusion of water molecules inside the extravascular extracellular space19 within the validated and co-registered voxel-based approach.
Methods and materials
Multifunctional parametric analysis framework
Functional imaging requires advanced data transfer and calculation speeds to enable reliable and practical integration into the clinical decision making process. A single perfusion CT scan can be approximately 10 GB, therefore big data analytic approaches are needed for the automation of computationally intensive modelling calculations for every voxel, independent of observer interpretation.
An overview of the platform pipeline is shown in a schematic in Figure 1. The TDA method for voxel-based pharmacokinetic perfusion analysis16,19 was remodelled to enable graphics processing unit (GPU)-based multiparameter optimization.20 Briefly, this method applies a classification scheme to each voxel, based on the temporal characteristics of the voxel’s contrast enhancement over time and then iteratively improves the pharmacokinetic modelling based on this classification and its resulting parameter sensitivity. The Modified Tofts model21 is commonly used in brain perfusion, based on the hypothesis of leaky neoangiogenic vascularization and increased permeability in tumours22,23 and this is what was used in the following evaluation in brain metastases producing kinetic parameters Ktrans, Kep, Ve and Vb. Semi-quantitative parameters including the integrated Area Under the enhancement Curve in 90s (iAUC90), maximum slope, peak enhancement were also obtained per voxel.
Figure 1.

Schematic overview of the workflow of the standardized analysis platform. ADC, apparent diffusion coefficient; TDA, temporal dynamic analysis.
Additional image registration between DCE-MRI and DWI-MRI modalities allowed ADC and DCE parameter values to be calculated on the same voxels (see section below). The directional DWI were averaged on a voxel-by-voxel basis to non-directional diffusion images within the TDA framework and then ADC values were calculated for each voxel by fitting the monoexponential model equation to 4-point plots of the logarithmically transformed signal intensities and their respective b-values, by using a linear least square fit algorithm.24
The TDA output for each modality consisted of three-dimensional (3D) Voxel Masks for every functional parameter associated with that modality (Ktrans, Ve, ADC, etc…) as well as separate sum of squared errors masks to show the transport model quality-of-fit. Within the confines of the tumour region, a histogram analysis was run for every functional parameter available, hence evaluation the standard deviation, skew and kurtosis of the histogram distribution inside the tumour.
Numerical optimization algorithm verification using synthetic data
The implementation of the numerical optimization algorithm for Tofts parameter estimation was benchmarked on synthetic data. These data were created by randomly selecting Tofts model parameters from a reasonable physical range of parameter values to simulate tissue contrast enhancements curves. In combination with an appropriately shaped population-based input function, the numerical optimization routines should then be able to recover the originally selected functional parameters to within acceptable tolerance if a high enough sampling rate is used to avoid aliasing errors. The procedure is not specific to any modality such CT or MR, but simply software verification based on digital signal processing. The tolerance for error was chosen to be on the order of 10−7 and the sampling rate required for the chosen tolerance had be at least 700 Hz.20
The verification procedure was repeated 1280 times for random Tofts parameters and statistics on mean percent error between ground truth and recovered parameters was calculated. In addition, run-time performance benchmarks were collected for the CPU based implementation of the numerical optimization algorithm (composed largely of Matlab® routines), and GPU based implementation that was developed to ultimately replace the CPU version (but used here only in the synthetic data).
Numerical optimization algorithm verification on MR Digital Reference Objects (DRO)
Processing MR data sets requires an additional step of non-linear signal to concentration conversion. In order to further verify the numerical optimization implementation and perform integration testing of this conversion step, DROs were used for this purpose as per QIBA recommendations.25 Version 6 of GE and Siemens DRO data sets provided by QIBA were used for software testing. The DROs had known ground truth comprising of six Ktrans values ranging from 0.01 to 0.35 min–1 that were constant across the rows and five Ve values ranging from 0.01 to 0.5 that were constant down the columns. This resulted in 30 different Ktrans–Ve pairs, each encompassing 10 × 10 pixels. In addition, the data contains the arterial input function encoded in the lower 10 rows of pixels. The data had sampling rate of 2 Hz, and due to aliasing noise such a low sampling rate would introduce, it was not expected to be able to recover the ground truth parameters with the same accuracy as synthetic verification testing discussed earlier. In addition, run-time performance benchmarks were collected to compare GPU and CPU based implementations.
Patients and treatment
Serial volumetric DCE-CT, DCE-MRI and DWI-MRI data were acquired in patients enrolled in a REB-approved clinical trial evaluating multiparametric imaging biomarkers of response to single-fraction radiosurgery (SRS) for brain metastases in combination with anti-VEGF treatment with sunitinib. Consented patients had 1–3 brain metastases eligible for SRS based on clinical and tumour characteristics. Two dose levels of sunitinib, 25 and 37.5 mg po daily were evaluated in combination with standard dose single-fraction brain SRS. 9 patients with 14 brain metastases from various primary tumour sites underwent serial multiparametric imaging prior to starting sunitinib (baseline), after 7 days of sunitinib and 3 days after SRS and 21 days after SRS.26
Multimodal image registration
Tumour regions of interest for each time point were delineated using semi-automated segmentation on the T 1 weighted Gadolinium-enhanced MR image by an expert observer and registered to the baseline DCE-MRI and DCE-CT images in GammaPlan® v9 (Elekta, Sweden). This has previously been reported to provide submillimetre accuracy.27 Patients were immobilized in a thermoplastic S-frame mask (QFix) during DCE-CT to minimize motion. No immobilization was used for MR acquisition for patients included in this study. Varying degrees of motion were observed during the 3D-FLASH acquisitions, both across DCE-MRI frames and between the variable-flip-angle (VFA) images used for endogenous T 1 mapping. Compensatory image registration was performed with a custom script to register all DCE-MRI images to the baseline image and all VFA scans to the 20 degree scan. Although every voxel in the brain scan was analysed, clinical treatment contours were exported from GammaPlan® so that the analysis could be correlated to the corresponding radiation clinical target volume.
Volumetric DCE-CT image acquisition
DCE-CT data was acquired on a 320-slice CT scanner (Toshiba, Aquilion ONE) that has previously been extensively characterized for its use in radiation oncology as a radiotherapy simulator28,29 and DCE measurements.30 Scan parameters were: 80 kV, 100 mA, 1 s rotation and 0.468 × 0.468 × 1.0 mm reconstruction resolution. A total of 60 ml of iodixanol (Visipaque® 320) was injected intravenously at 5 ml s–1 synchronised with the start of scanning. The brain tumour DCE time sequence consisted of different sampling frequencies: every 1.5 s for the first 30 s, every 5 s for the next 90 s and every 10 s up to 180 s to allow for permeability modelling whilst balancing the scan dose with measurement sampling rate. A non-contrast volume was acquired prior to contrast injection for baseline corrections and image registration. The associated volumetric dose index was approximately 100 mGy, compared to the 60 mGy typically reported for a routine adult head scan in this scan mode.31 For pharmacokinetic analysis, the arterial input function (AIFCT) was chosen in the carotid artery for DCE-CT and compared against a vascular input function (VIFCT) in the sagittal sinus.
DCE and DWI-MRI acquisition
On the same day as the DCE-CT, each patient underwent MRI imaging on a 3 T Verio system (Siemens Medical Systems, Erlangen, DE) with VQ gradients (40 mT/m peak amplitude; 200 T/m/s peak slew rate) and a 12 channel head coil. MR scanning included, endogenous T 1 mapping using the VFA technique,32 DCE-MRI, as well as T 2 weighted FLAIR imaging (turbo spin echo acquisition with repetition time/echo time (TR/TE) 7253/96 ms; inversion time (TI) 2500 ms, field of view (FOV) 220 × 220 mm, matrix 320 × 320; in-plane resolution 0.7 mm; slice thickness 3 mm, 96 slices; 4 min 8 s) and contrast-enhanced T 1 weighted imaging (3D MP-Rage with TR/TE 1400/2.2 ms; TI 900 ms, FOV 200 × 200 mm; matrix size 320 × 320; in-plane resolution 0.6 mm; slice thickness 1.5 mm; 50 slices; 6 min 25 s).
VFA and DCE-MRI acquisitions used a 3D-FLASH pulse sequence with the following common parameters (TR/TE 4.8/1.86 ms; FOV 220 × 200 mm; matrix 174 × 192 × 40; in-plane resolution 1.1 mm; slice thickness 1.5 mm). VFA used flip angles of 2, 10, 20, and 30°, and the scan time was 50 s per flip angle. For DCE-MRI, the temporal resolution was more important than for VFA (needing better SNR) and was 5.8 s, and 45 repetitions were acquired (scan time 4 min 19 s). A weight-based bolus of Gadolinium contrast (Magnevist, Bayer AG, Leverkusen, DE) at 0.15 mmol kg–1 was injected intravenously at 4 ml s–1 after a 20 s delay from the start of scanning followed by a 20 ml saline injection. DCE-MRI analysis was done using both individual and population33-based vascular input functions though only the population-based results are reported here (AIFMRI). Individual endogenous T 1 (T10) maps were used when available; for patients who did not have available individual T10 maps, an assumed T10 value of 2000 ms was used, based on the median tumour T10 of all evaluable patients16
DWI-MRI was acquired using spin-echo echo-planar imaging with TR/TE of 7700/110 ms; diffusion gradient encoding in three orthogonal directions; b-values of 150, 1000, 1800 s mm– 2; FOV = 200 × 200 mm; matrix size = 128×128; slice thickness = 3 mm; number of signals acquired 3.
Statistical analysis
Statistical analysis was carried out using Anova2 in MATLAB® (The Mathworks). Comparison of the functional parameters estimated by volumetric DCE-CT, DCE-MRI and DWI was done via Student’s t-test and Pearson’s correlation, as well as Bland-Altman analysis between DCE-CT and DCE-MRI, where differences in perfusion parameter values between the modalities were plotted against the mean of the pair of values. All statistical analyses were two-sided and p-values less than 0.05 were deemed statistically significant. Direct voxel to voxel comparison was done in a similar way with the addition of variance component analysis to estimate inter (between) tumour variance and intra (same) tumour variance on the same days.12
Results
Numerical optimization algorithm verification and performance testing
When tested on synthetic data, the numerical optimization routines for Tofts model implementation in CUDA (GPU parallel processing, NVIDIA®) and the CPU implemented in Matlab®, were found to recover the ground truth parameters with mean relative percent error of 1.07 × 10⁻⁷ ± 1.27 × 10⁻⁸ (95% confidence interval) between all Tofts model parameters. The GPU-based implementation was found to execute at least two orders of magnitude faster than its CPU counterpart did.
When tested on QIBA’s DRO data, the mean relative percent error was found to be 5.60 × 10⁻⁴ ± 1.22 × 10⁻⁵ (95% confidence interval) between Ktrans and Ve parameters combined. The run-time for CPU implementation took an average of 6.56 s/voxel whereas the GPU implementation completed in 1.09 × 10⁻² (also two orders of magnitude faster, as with synthetic data).
Patient DCE-CT v s DCE-MRI
A comparison of median tumour perfusion parameters demonstrated moderate correlations between DCE-CT and DCE-MRI for Ktrans (R = 0.56, p = 0.01) and iAUC90 (R = 0.40, p = 0.01) but only when averaging over all imaging days and all tumours. This is illustrated in Figure 2 showing the mean tumour Ktrans value from DCE MRI and DCE CT per lesion (a), together with the histogram skewness and kurtosis. The correspondence is relatively scattered and indicates a slight bias towards higher Ktrans values from MRI. Statistical significance improved considerably when comparing the voxel wise correlations taking into account tumour heterogeneity. Direct voxel-voxel Pearson’s analysis showed statistically significant correlations between CT and MR at every imaging day with very little bias peaking at Day 7 for Ktrans (R = 0.74, p <= 0.0001). The strongest correlation to DCE-CT measurements was found with DCE-MRI analysis using voxelwise T10 maps (R = 0.575, p < 0.001, all cases) instead of assigning a fixed T10 value.14
Figure 2.
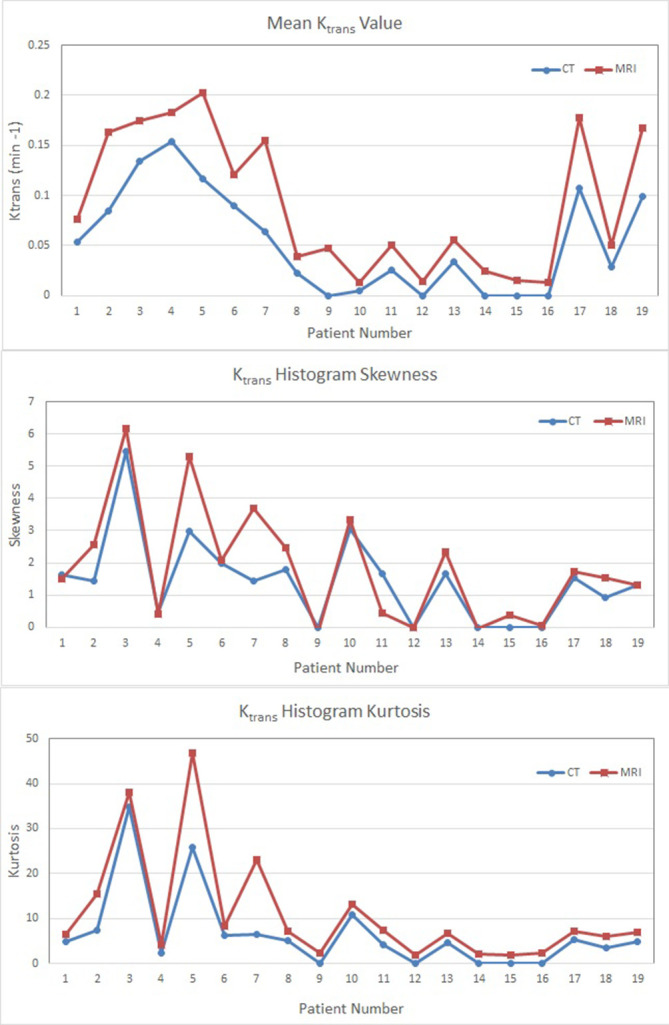
Comparison plots of (a) mean Ktrans values, (b) Ktrans histogram skewness and (c) Ktrans histogram kurtosis values obtained with DCE-CT and DCE-MRI per tumour.
Correlation between ADC and Ve
Statistically significant correlations were also present between ADC and Ve derived from both DCE-MRI and DCE-CT. Correlations between median ADC and Ve,MRI values are strong (R = 0.6, p < 0.01) but varied considerably with tumour size and imaging day ranging from R = 0.12–0.83 for statistically significant measurements and peaked 3 days after SRS (R = 0.75, p < 0.01) as shown in Table 1 and illustrated in Figure 3.
Table 1.
Pearson correlation and significance values comparing median ADC and Ve,MRI values over all patients
| Pre-drug | Post-drug/Pre-SRS | Day 3 post-SRS | Day 20 post-SRS | All days | |
| R | 0.57 | 0.64 | 0.75 | 0.33 | 0.61 |
| P | 0.066 | 0.026 | 0.008 | 0.389 | 0.000 |
SRS, stereotactic radio surgery;
It should be noted that by Day 20, many of the tumours weres ubstantially smaller and this likely contributes to lower correlation seen between ADC and Ve. On an individual patient basis,the number of voxels also reduces significantly resulting in poorer statistical power.
Figure 3.

(a) ADC, Ktrans, Ve, AUC and T1-Gad images Pre-SRS and Day 20 post-SRS for a typical tumour; (b) Histogram analysis for the same tumour and parameters. ADC, apparent diffusion coefficient; AUC, area under the curve; SRS, stereotactic radio surgery.
Discussion
This work describes the use of a voxel-based, multimodality architecture to include various complimentary solute transport processes such as perfusion and diffusion into a common framework. The reliable development and validation was in part possible due to the exclusive nature of patient data used where the same patients were scanned on the same day and even in the same scanner position (when it comes to DWI and DCE-MRI). Although the statistical significance of this analysis effect would be hard to demonstrate (given that it would require the same datasets to be analysed with different platforms (or approaches), using this architecture for analysis and comparison of contrast enhancement data from both DCE-CT and DCE-MRI, we found significantly higher correlation between their parametric output values than previously reported studies that either used separate analysis software for DCE-CT and DCE-MRI or did reproducibility testing (12). Ng et al (2012) compared DCE-MRI and DCE-CT parameters in a preclinical rat tumour model and noted that intrarat coefficients of variation for DCE-MRI parameters Ktrans, Kep and Ve were 23, 16 and 20%, respectively. MRI parameters were on average 44% higher than CT values where we noted very little bias as seen in Figure 3. Other variables that could contribute to the differences in correlations would be differences in disease site or tumour model, heterogeneities of the samples, acquisition platforms, acquisition methods etc.
Evaluation of our unified approach on DRO test objects gave a mean relative percent error around 5.60 × 10⁻⁴±1.22 × 10⁻⁵ (95% confidence interval) between Ktrans and Ve parameters combined. No test-retest data was allowed to be acquired in this patient cohort but reproducibility of the core TDA approach was previously shown to be on the order of 6% (range, 2–10%) using volumetric liver perfusion CT data.15 This further supports the strongly validated basis of the framework.
Although the strength of the correlations for Ktrans and iAUC90 values for individual imaging days was lower than for all imaging days together, this is most likely due to the smaller number of data points to provide statistical significance. The high level of correlation between CT and MRI pharmacokinetic parameters over all imaging days supports the concept that low molecular weight contrast agents can indeed help derive tumour permeability and perfusion heterogeneity independent of imaging modality, provided the image analysis methods are standardised.
With the ability to compare Ktrans between DCE-CT and DCE-MRI, we were able to evaluate components of the modified Tofts model-based analysis. Using DCE-CT data for comparison, AIF and VIF appeared to be interchangeable in generating similar Ktrans values.16 This provides supportive evidence that the use of individual VIF in DCE-MRI analysis is a reasonable approach if it can be measured consistently across time points. In contrast, the application of different T10 values affected the Ktrans value more dramatically and the inclusion of individualized voxelwise pre-contrast relaxation times in the pharmacokinetic analysis is essential when evaluating parametric tumour heterogeneity.16,34
Taking the comparison one step further, we then were able to evaluate ADC against Ve values from both DCE-CT and DCE-MRI. Despite the challenges in image acquisition and various other factors that can affect the ADC measurement (e.g. cell membrane permeability35 , we also found significantly higher correlations between ADC values and Ve parameters when analysed using the TDA platform at certain times during treatment than previously reported.17,18 The systematic validation of all process components (i.e. DCE-MRI to DCE-CT to phantoms to DROs) supports this interpretation. Although the optimal method for deriving ADC values is a topic of debate, and the lower b-values can be more susceptible to convection and perfusion, the automated process developed here creates the possibility to use this platform for further exploration into biophysical properties of different tumours and their microenvironments using multiparametric imaging data. It is not immediately clear what the clinical significance would be behind the higher correlation at a particular imaging time point. One could speculate as to the biophysical explanation but it should be noted that it could also be a reflection of the data quality if there is less motion and/or distortion in the MRI data (hence resulting in better image registration) or the volume of the brain metastases was much smaller at later time points. This highlights the value of ‘early biomarkers’ before substantial tumour volume changes—both for the ability to adapt therapy in a timely manner and to minimize the impact of tumour volume change on biomarker evaluation. Similarly, a highly heterogenous range of primary tumour sites was present in this data set which could impact the imaging biomarkers given their individual sensitivity to sunitinib as an anti-angiogenic drug.26
By moving across modalities (e.g. CT vs MRI) and across different imaging acquisitions (e.g. DWI vs DCE), we can start to interrogate the complimentary solute transport processes using this unified approach. Historically, these imaging modalities and measures have been treated as individual tools that involved unique image acquisition and image analysis approaches. However, this partitioned approach can encumber meaningful cross-talk to help recognize and overcome limitations of each of these imaging measures.
A unified pipeline could streamline and perhaps even improve the reproducibility of individual functional imaging techniques as well as enable cross-validation of physiological response measures across imaging techniques and modalities. Once a shared pharmacokinetic platform is established, other voxel-based features of the tumour—such as cell density, or lipid and metabolites as obtained from MRI spectroscopy—could be incorporated in order to provide complementary information so that together a more comprehensive description of the tumour microenvironment can be evaluated.
Conclusions
Being able to non-invasively interrogate the tumour microenvironment in a reliable way using a common multimodality and multiparametric transport-modelling platform, finally opens the possibility of using these imaging techniques to guide precision cancer medicine by directing care and adapting treatment based quantitative imaging measures of tumour response. Utility of a common analysis platform has shown higher correlations between pharmacokinetic parameters obtained from different modalities than has previously been reported. This research demonstrates that such a unified modality agnostic approach to uniformly interrogate solute transport processes within tissue and tumours may help move the field forward through better standardization and national/international collaboration with larger sample sizes can help confirm or negate these findings.
Contributor Information
Catherine Coolens, Email: catherine.coolens@rmp.uhn.ca.
Brandon Driscoll, Email: brandon.driscoll@rmp.uhn.ca.
Warren Foltz, Email: warrren.foltz@rmp.uhn.ca.
REFERENCES
- 1. Kang TW , Kim ST , Byun HS , Jeon P , Kim K , Kim H , et al. . Morphological and functional MRI, MRS, perfusion and diffusion changes after radiosurgery of brain metastasis . Eur J Radiol 2009. ; 72 : 370 – 80 . doi: 10.1016/j.ejrad.2008.08.009 [DOI] [PubMed] [Google Scholar]
- 2. Kim HR , Kim SH , Lee JI , Seol HJ , Nam DH , Kim ST , et al. . Outcome of radiosurgery for recurrent malignant gliomas: assessment of treatment response using relative cerebral blood volume . J Neurooncol 2015. ; 121 : 311 – 8 . doi: 10.1007/s11060-014-1634-8 [DOI] [PubMed] [Google Scholar]
- 3. Padhani AR , Liu G , Koh DM , Chenevert TL , Thoeny HC , Takahara T , et al. . Diffusion-weighted magnetic resonance imaging as a cancer biomarker: consensus and recommendations . Neoplasia 2009. ; 11 : 102 – 25 . doi: 10.1593/neo.81328 [DOI] [PMC free article] [PubMed] [Google Scholar]
- 4. Goh V , Schaeffter T , Leach M . Reproducibility of dynamic contrast-enhanced MR imaging: why we should care . Radiology 2013. ; 266 : 698 – 700 . doi: 10.1148/radiol.12122447 [DOI] [PubMed] [Google Scholar]
- 5. Heye T , Davenport MS , Horvath JJ , Feuerlein S , Breault SR , Bashir MR , et al. . Reproducibility of dynamic contrast-enhanced MR imaging. Part I. Perfusion characteristics in the female pelvis by using multiple computer-aided diagnosis perfusion analysis solutions . Radiology 2013. ; 266 : 801 – 11 . doi: 10.1148/radiol.12120278 [DOI] [PubMed] [Google Scholar]
- 6. Heye T , Merkle EM , Reiner CS , Davenport MS , Horvath JJ , Feuerlein S , et al. . Reproducibility of dynamic contrast-enhanced MR imaging. Part II. Comparison of intra- and interobserver variability with manual region of interest placement versus semiautomatic lesion segmentation and histogram analysis . Radiology 2013. ; 266 : 812 – 21 . doi: 10.1148/radiol.12120255 [DOI] [PubMed] [Google Scholar]
- 7. Orton MR , Messiou C , Collins D , Morgan VA , Tessier J , Young H , et al. . Diffusion-weighted MR imaging of metastatic abdominal and pelvic tumours is sensitive to early changes induced by a VEGF inhibitor using alternative diffusion attenuation models . Eur Radiol 2016. ; 26 : 1412 – 9 . doi: 10.1007/s00330-015-3933-7 [DOI] [PMC free article] [PubMed] [Google Scholar]
- 8. Malyarenko DI , Newitt D , J Wilmes L , Tudorica A , Helmer KG , Arlinghaus LR , et al. . Demonstration of nonlinearity bias in the measurement of the apparent diffusion coefficient in multicenter trials . Magn Reson Med 2016. ; 75 : 1312 – 23 . doi: 10.1002/mrm.25754 [DOI] [PMC free article] [PubMed] [Google Scholar]
- 9. Keenan KE , Peskin AP , Wilmes LJ , Aliu SO , Jones EF , Li W , et al. . Variability and bias assessment in breast ADC measurement across multiple systems . J Magn Reson Imaging 2016. ; 44 : 846 – 55 . doi: 10.1002/jmri.25237 [DOI] [PMC free article] [PubMed] [Google Scholar]
- 10. Checkley D , Tessier JJ , Kendrew J , Waterton JC , Wedge SR . Use of dynamic contrast-enhanced MRI to evaluate acute treatment with ZD6474, a VEGF signalling inhibitor, in PC-3 prostate tumours . Br J Cancer 2003. ; 89 : 1889 – 95 . doi: 10.1038/sj.bjc.6601386 [DOI] [PMC free article] [PubMed] [Google Scholar]
- 11. Cenic A , Nabavi DG , Craen RA , Gelb AW , Lee TY . Dynamic CT measurement of cerebral blood flow: a validation study . AJNR Am J Neuroradiol 1999. ; 20 : 63 – 73 . [PubMed] [Google Scholar]
- 12. Ng CS , Waterton JC , Kundra V , Brammer D , Ravoori M , Han L , et al. . Reproducibility and comparison of DCE-MRI and DCE-CT perfusion parameters in a rat tumor model . Technol Cancer Res Treat 2012. ; 11 : 279 – 88 . doi: 10.7785/tcrt.2012.500296 [DOI] [PubMed] [Google Scholar]
- 13. Kallehauge J , Nielsen T , Haack S , Peters DA , Mohamed S , Fokdal L , et al. . Voxelwise comparison of perfusion parameters estimated using dynamic contrast enhanced (DCE) computed tomography and DCE-magnetic resonance imaging in locally advanced cervical cancer . Acta Oncol 2013. ; 52 : 1360 – 8 . doi: 10.3109/0284186X.2013.813637 [DOI] [PubMed] [Google Scholar]
- 14. Merali Z , Wong T , Leung J , Gao MM , Mikulis D , Kassner A . Dynamic contrast-enhanced MRI and CT provide comparable measurement of blood-brain barrier permeability in a rodent stroke model . Magn Reson Imaging 2015. ; 33 : 1007 – 12 . doi: 10.1016/j.mri.2015.06.021 [DOI] [PubMed] [Google Scholar]
- 15. Coolens C , Driscoll B , Moseley J , Brock KK , Dawson LA . Feasibility of 4D perfusion CT imaging for the assessment of liver treatment response following SBRT and sorafenib . Adv Radiat Oncol 2016. ; 1 : 194 – 203 . doi: 10.1016/j.adro.2016.06.004 [DOI] [PMC free article] [PubMed] [Google Scholar]
- 16. Coolens C , Driscoll B , Foltz W , Pellow C , Menard C , Chung C . Comparison of voxel-wise tumor perfusion changes measured with dynamic contrast-enhanced (DCE) MRI and volumetric DCE CT in patients with metastatic brain cancer treated with radiosurgery . Tomography 2016. ; 2 : 325 – 33 . doi: 10.18383/j.tom.2016.00178 [DOI] [PMC free article] [PubMed] [Google Scholar]
- 17. Arlinghaus LR , Li X , Rahman AR , Welch EB , Xu L , Gore JC , et al. . On the relationship between the apparent diffusion coefficient and extravascular extracellular volume fraction in human breast cancer . Magn Reson Imaging 2011. ; 29 : 630 – 8 . doi: 10.1016/j.mri.2011.02.004 [DOI] [PMC free article] [PubMed] [Google Scholar]
- 18. Mills SJ , Soh C , Rose CJ , Cheung S , Zhao S , Parker GJ , et al. . Candidate biomarkers of extravascular extracellular space: a direct comparison of apparent diffusion coefficient and dynamic contrast-enhanced MR imaging--derived measurement of the volume of the extravascular extracellular space in glioblastoma multiforme . AJNR Am J Neuroradiol 2010. ; 31 : 549 – 53 . doi: 10.3174/ajnr.A1844 [DOI] [PMC free article] [PubMed] [Google Scholar]
- 19. Coolens C , Driscoll B , Chung C , Shek T , Gorjizadeh A , Ménard C , et al. . Automated voxel-based analysis of volumetric dynamic contrast-enhanced CT data improves measurement of serial changes in tumor vascular biomarkers . Int J Radiat Oncol Biol Phys 2015. ; 91 : 48 – 57 . doi: 10.1016/j.ijrobp.2014.09.028 [DOI] [PubMed] [Google Scholar]
- 20. Svistoun I , Coolens C . Numerical optimization performance of a perfusion kinetic modelling algorithm using volumetric DCE CT . : Jaffray D. A , IFMBE Proceedings, World Congres on Medical Physics and Biomedical Engineering . 51 . United States of America: : The British Institute of Radiology. ; 2015. . [Google Scholar]
- 21. Tofts PS , Brix G , Buckley DL , Evelhoch JL , Henderson E , Knopp MV , et al. . Estimating kinetic parameters from dynamic contrast-enhanced T(1)-weighted MRI of a diffusable tracer: standardized quantities and symbols . J Magn Reson Imaging 1999. ; 10 : 223 – 32 . doi: 10.1002/(SICI)1522-2586(199909)10:3<223::AID-JMRI2>3.0.CO;2-S [DOI] [PubMed] [Google Scholar]
- 22. Sourbron SP , Buckley DL . On the scope and interpretation of the Tofts models for DCE-MRI . Magn Reson Med 2011. ; 66 : 735 – 45 . doi: 10.1002/mrm.22861 [DOI] [PubMed] [Google Scholar]
- 23. Fidler IJ , Yano S , Zhang RD , Fujimaki T , Bucana CD . The seed and soil hypothesis: vascularisation and brain metastases . Lancet Oncol 2002. ; 3 : 53 – 7 . doi: 10.1016/S1470-2045(01)00622-2 [DOI] [PubMed] [Google Scholar]
- 24. Chung EJ , Kim EG , Bae JS , Eun CK , Lee KS , Oh M , et al. . Usefulness of diffusion-weighted MRI for differentiation between Parkinson's disease and Parkinson variant of multiple system atrophy . J Mov Disord 2009. ; 2 : 64 – 8 . doi: 10.14802/jmd.09017 [DOI] [PMC free article] [PubMed] [Google Scholar]
- 25. Barboriak D . QIBA_v6_Tofts_revB. Daniel P Barboriak Lab . 2016. . Available from: https://sites.duke.edu/dblab/qibacontent/ [ March 25 ].
- 26. Chung C , Menard C , Mason W , Foltz W , Coolens C , Driscoll B . Phase I dose-escalation study of Sunitinib concurrent with radiosurgery in patients with brain metastases with serial imaging biomarker evaluation . Radiother Oncol 2017. . [Google Scholar]
- 27. Nakazawa H , Mori Y , Komori M , Shibamoto Y , Tsugawa T , Kobayashi T , et al. . Validation of accuracy in image co-registration with computed tomography and magnetic resonance imaging in Gamma Knife radiosurgery . J Radiat Res 2014. ; 55 : 924 – 33 . doi: 10.1093/jrr/rru027 [DOI] [PMC free article] [PubMed] [Google Scholar]
- 28. Coolens C , Breen S , Purdie TG , Owrangi A , Publicover J , Bartolac S , et al. . Implementation and characterization of a 320-slice volumetric CT scanner for simulation in radiation oncology . Med Phys 2009. ; 36 : 5120 – 7 . doi: 10.1118/1.3246352 [DOI] [PubMed] [Google Scholar]
- 29. Coolens C , Bracken J , Driscoll B , Hope A , Jaffray D . Dynamic volume vs respiratory correlated 4DCT for motion assessment in radiation therapy simulation . Med Phys 2012. ; 39 : 2669 – 81 . doi: 10.1118/1.4704498 [DOI] [PubMed] [Google Scholar]
- 30. Driscoll B , Keller H , Jaffray D , Coolens C . Development of a dynamic quality assurance testing protocol for multisite clinical trial DCE-CT accreditation . Med Phys 2013. ; 40 : 081906 . doi: 10.1118/1.4812429 [DOI] [PubMed] [Google Scholar]
- 31. American Association of Physics in Medicine (AAPM). Task Group CT Scan Protocols . 2012. .
- 32. Cheng HL , Wright GA . Rapid high-resolution T(1) mapping by variable flip angles: accurate and precise measurements in the presence of radiofrequency field inhomogeneity . Magn Reson Med 2006. ; 55 : 566 – 74 . doi: 10.1002/mrm.20791 [DOI] [PubMed] [Google Scholar]
- 33. Parker GJ , Roberts C , Macdonald A , Buonaccorsi GA , Cheung S , Buckley DL , et al. . Experimentally-derived functional form for a population-averaged high-temporal-resolution arterial input function for dynamic contrast-enhanced MRI . Magn Reson Med 2006. ; 56 : 993 – 1000 . doi: 10.1002/mrm.21066 [DOI] [PubMed] [Google Scholar]
- 34. Coolens C , Driscoll B , Foltz W , Chung C . SU-D-303-02: impact of arterial input function selection and T10 correction on DCE-MRI tumour response prediction using compared to volumetric DCE CT . Med Phys 2015. ; 42 : 3215 . doi: 10.1118/1.4923889 [DOI] [Google Scholar]
- 35. Szafer A , Zhong J , Gore JC . Theoretical model for water diffusion in tissues . Magn Reson Med 1995. ; 33 : 697 – 712 . doi: 10.1002/mrm.1910330516 [DOI] [PubMed] [Google Scholar]