Abstract
Objective:
This work aims to analyse the effect of respiratory motion on optimal irradiation margins for murine lung tumour models.
Methods:
Four-dimensional mathematical phantoms with different lung tumour locations affected by respiratory motion were created. Two extreme breathing curves were adopted and divided into time-points. Each time-point was loaded in a treatment planning system and Monte Carlo (MC) dose calculations were performed for a 360° arc plan. A time-resolved dose was derived, considering the gantry rotation and the breathing motion. Radiotherapy metrics were derived to assess the final treatment plans. An interpolation function was investigated to reduce calculation cost.
Results:
The effect of respiratory motion on the treatment plan quality is strongly dependent on the breathing pattern and the tumour position. Tumours located closer to the diaphragm required a compromise between tumour conformity and healthy tissue damage. A recipe, which considers collimator size, was proposed to derive tumour margins and spare the organs at risk (OARs) by respecting constraints on user-defined metrics.
Conclusion:
It is recommended to add a target margin, especially on sites where movement is substantial. A simple recipe to derive tumour margins was developed.
Advances in knowledge:
This work is a first step towards a standard planning target volume concept in pre-clinical radiotherapy.
Introduction
Recent developments in technology and tumour models have produced unprecedented opportunities for pre-clinical translational and radiobiological research. It is currently becoming possible to mimic complex radiotherapy treatments in an experimental pre-clinical setting. For accurate research translation to clinical practice, and ultimate patient benefit, a number of challenges have yet to be overcome. A recent recommendations report1 has raised several points that require further study, among which the optimal irradiation margins of tumour models.
The concept of treatment margins is fundamental in radiotherapy, the use of target volumes has long been recommended2–4 and is a premise for unambiguous prescription, recording and reporting of dose. Although the delineations of the gross and clinical target volumes (GTV and CTV) are purely based on anatomic and biological parameters, the planning target volume (PTV) consists of a geometrical margin to account for variation in size, shape and position relative to the treatment beam. The PTV considers the net effect of all the possible geometrical variations, to ensure that the prescribed dose is absorbed in the CTV.4 A number of clinical studies5–10 have explored this concept and proposed recipes to quantify the weight of systematic and random errors, or the effect of treatment execution and preparation, on the size of the PTV.
To adopt such concepts, it is important to consider the differences between clinical and pre-clinical irradiation. Small animals, such as mice, are imaged and irradiated under sedation, which promotes physical restraint and depresses respiratory and cardiovascular rate. The cardiac and breathing motions are thus affected and the specimen has to be constantly monitored to avoid, for instance, hypothermia.
In this context, a mathematical 4-dimensional (4D) phantom and two extreme breathing patterns have been explored to analyse the effect of respiratory motion on the dose distribution. A simple recipe, which takes into account the collimator size, is proposed to derive tumour margins and safeguard tolerable radiation levels to the organs at risk (OARs). Furthermore, an interpolation method, based on 4D dose accumulation with rigid progression, to decrease Monte Carlo calculation time is also discussed.
Methods and materials
4D digital mouse whole-body phantom (MOBY)
The mathematical mouse whole body phantom, MOBY,11 was used. This 4D phantom is capable of generating realistic anatomy models of breathing mice in two physical modes: attenuation or emission. For the former, it simulates a 3D distribution of attenuation coefficients for a given photon energy, and for the latter, it simulates a 3D distribution of emission radionuclide activity for the various organs. This study used MOBY in activity mode but instead of radionuclide activities, every organ listed in the activity mode was assigned a human tissue density value from the ICRU Report 44, 1988.12 Using human tissue density values is common practice in pre-clinical radiotherapy, due to the absence of small animal tissue density information in the literature.13 As a result of the assignment, each MOBY voxel represents a density value of a specific organ.
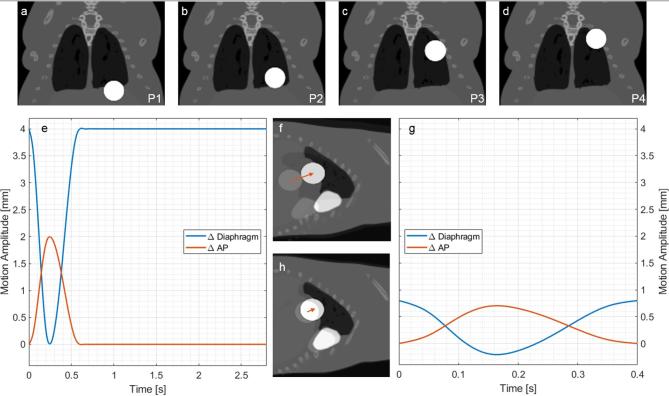
A spherical lesion was placed in the left lung, as it is more affected by the heart shape and movement. Different scenarios were generated with two possible lesion diameters and four positions. Figure 1a–d display the different positions; position 1 (P1, Figure 1a) has the tumour located along the diaphragm and is the most affected by motion. Table 1 enumerates all simulated MOBY scenarios.
Figure 1.
(a–d) Coronal representation of positions (P1, P2, P3 and P4) of a 4 mm tumour placed in the left lung of MOBY phantoms. (e, g) Diaphragm and anteroposterior motion amplitudes as a function of time. (e) Curve obtained by fluoroscopic X-ray imaging of a breathing mouse put under isoflurane anaesthesia. (f) Sagittal representation of the breathing motion of curve 1e, for a 4 mm tumour, at P1, at two instants: t = 0.0 s and t = 0.3 s. (g) Tidal breathing curve derived from a normal-breathing human, scaled to the dimensions of a mouse. (h) Sagittal representation of the breathing motion of the curve 1g, for the same conditions of (e). The arrow qualitatively shows the tumour displacement in this plane. The white colour of the tumour and heart is merely for visualisation purposes, the underlying density values are agreement with soft tissue and heart.
Table 1.
Characteristics of MOBY phantoms and SmART-Plan treatment plans. The prescription dose value of 8 Gy was arbitrarily chosen
| MOBY parameters | |||
| Organ | Left lung | ||
| Tumour diameter | [mm] | 3 or 4 | |
| Tumour position | 1, 2, 3, 4 | ||
| Breathing curve | Anaesthesia | Tidal | |
| Maximum diaphragm amplitude | [mm] | 4 | 1 |
| Maximum AP amplitude | [mm] | 2 | 0.7 |
| Total period | [s] | 2.8 | 0.4 |
| Respiration period | [s] | 0.6 | 0.4 |
| Rest period | [s] | 2.2 | 0 |
| Time interval | [s] | 0.05 | |
| Number of time-points | 56 | 8 | |
| SmART-Plan irradiations | |||
| Irradiation plan | 360° Arc | ||
| Collimator diameter (C#) | [mm] | 3, 4, 5, 6, 7 or 4, 5, 6, 7, 8 | |
| Irradiation dose | [Gy] | 8 Gy (arbitrary value) | |
| Simulated photons | 108/time-point | ||
AP, anteroposterior
Figure 1e,g show the two breathing curves employed in this study, their characteristics are summarised in Table 1. The anaesthesia curve, Figure 1e, proposed by van der Heyden et al14 was derived from fluoroscopy imaging of a mouse under the influence of isoflurane; commonly used in murine in vivo non-invasive imaging and irradiation. As an effect of the anaesthetic, the breathing is deep and slow, the full breathing cycle has a long period, of which nearly 80% is represented by the rest phase. Although the breathing phase is relatively short, the diaphragm and anteroposterior (AP) motions are pronounced.
The tidal curve, Figure 1g, proposed by Segars et al11 was derived from a normal-breathing human, scaled to the dimensions of a mouse. In comparison to the anaesthesia curve, it has a shorter period and reduced diaphragm and AP motions. The movement is continuous, as there is no rest phase. Figure 1f,g reveal the instants when the motion amplitudes are maximal and minimal, for anaesthesia and tidal, respectively.
Both curves were converted into 4D non-uniform rational basis splines (NURBS) for MOBY implementation. NURBS were adopted to model respiratory motion so the breathing curve parameters could be spline-interpolated in time and 4D phantoms generated for any time interval. MOBY software subsequently sampled the NURBS’s phantom lung volume in time points.
Treatment planning system
Treatment plans were generated using the small animal treatment planning system (TPS) SmART-Plan15 (Research v. 1.5, PXi, North Branford, CT). As this version does not handle moving geometries, the breathing curves were divided into time-points (or frames) with a period of 5 ms each. The anaesthesia and tidal curves yielded 56 and 8 time-points, respectively. Each frame was loaded into SmART-Plan as a static voxelised geometry. Automatic structure delineation, based on previously assigned tissue densities and known organ positions, and material allocation for every organ were performed for each frame. Full treatments were automatically generated using MATLAB® v. R2014a/R2018a (The MathWorks Inc., Natrick, MA) scripts.
Figure 2 shows the treatment plan, a dynamic 360o arc. Table 1 presents a summary of the TPS simulation protocols. The geometry consisted of 256 × 256 × 101 voxels with 0.2 × 0.2 × 0.2 mm3 voxel sizes. The prescription dose to the target volume was set to 8 Gy. This value was achieved considering the normal irradiation conditions for the X-RAD 225Cx irradiator (PXi, North Branford, CT) at our institute: energy of 225kVp, 13 mAs, filter cassette made of copper with nominal thickness of 0.32 mm, source to isocentre distance fixed at 303.6 mm, dose rate of 0.41 cGy/mAs and different beam-on times. The absorbed dose to water is periodically verified at a solid water phantom surface using a TN30012 Farmer ionisation chamber (PTW, Freiburg, Germany) according to the AAPM TG-61 protocol for 40–300 kV X-ray beam dosimetry (in-air calibration method).16
Figure 2.
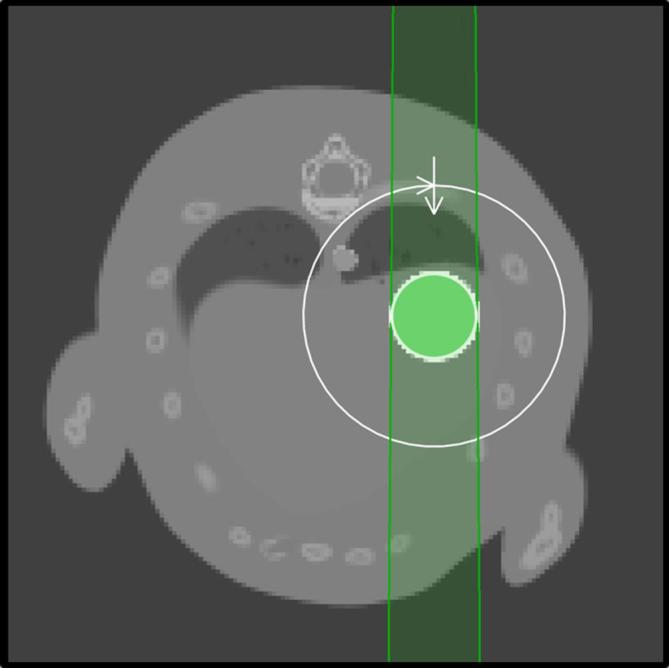
Axial view of the treatment plan. The beam, indicated by the green-shaded region, is shaped here by a 4 mm circular collimator and it rotates 360° in the plane of the figure around the target, which is located at the isocentre of the irradiator.
Circular brass collimators with diameters ranging from 3 to 7 mm (C3–C7) for the 3-mm tumour and 4–8 mm (C4-C8) for the 4 mm tumour were used. The beam was invariably centred in the tumour position at the first time-point (maximum exhale, where breathing speed is zero), as shown on Figure 2. The target coordinates were kept unchanged for the following time-points even though the tumour coordinates followed the curves presented on Figure 1e,g. In other words, the irradiation assumed the tumour was not moving.
The EGSnrc-based Monte Carlo (MC) simulation code DOSXYZnrc17, 18 was used as the dose engine of the TPS. For each time-point, 100 million photons were generated, and transported down to an energy cutoff (PCUT) of 10 keV and the electron energy cutoff (ECUT) was set to a total energy value of 736 keV (225 kV kinetic energy, meaning no secondary electrons were transported). The calculation time was around 30 min per time-point for a full arc in a machine with 12 processors (Intel® Xeon® CPU-X5660 2.8 GHz) and 16 GB of RAM. To avoid redundant calculations, only the breathing phase time-points of the anaesthesia curve were simulated; as of time-point 12 on (or as of time 0.6 s in Figure 1e), the geometry remains static. For the tidal breathing, the full curve was simulated due to the absence of a rest phase.
For each time-point, masks of the tumour and OARs were extracted from the TPS. Additionally, the 3D dose-map, and beam-on time were obtained from the MC calculation. A time-resolved dose was hence derived from the dose distributions in combination with the correlation of organ displacement, the beam and the time-point at a specific time interval, as described at Supplementary material of van der Heyden et al.14 Therefore, the influence of the beam on space and time, considering gantry rotation and breathing motion was taken into account.
Metrics and cost function
The full treatment plan, or the treatment plan to a complete breathing curve, was assessed through cumulative dose-volume histograms (DVHs) of the tumour and OARs time-resolved dose. Additional radiotherapy dose reporting parameters were considered, such as the metrics D90, V90 and mean dose to the OARs. The D90 is defined as the dose to the 90% of the tumour volume; V90 is the percentage of tumour volume which receives a dose equal or higher than 90% of the prescription dose; and the mean dose to selected OARs is the average dose value in a determined organ volume.
Considering the minimum acceptable D90, V90 and the maximum acceptable mean dose to the OARs, for a lung tumour with a specific size and position, a simple cost function (Eq1) was derived. The metrics were employed as constraints (Eq2) to an interactive optimisation problem to derive tumour margins, considering breathing motion. The objective was to minimise the cost function tumour-margin by maximising D90, V90 and minimising the mean dose to the OARs. The collimator diameter is the parameter that was optimised through this procedure.
Where M is the margin, dc is the collimator diameter, dT, the tumour diameter, D90T and V90T, D90 and V90 of the tumour and OARn, the mean dose to each OARn, respectively. (D90T)ct, (V90T)ct and (OARn)ct are the constraints applied to each of these quantities.
Four-dimensional dose prediction with rigid projection of the first frame
Additional irradiation parameters, other than the field diameter, could be optimised at the same time, but due to the high computational cost that each simulation requires, this becomes impractical. Thus the need of a fast tool to assess the effect of breathing motion on treatment quality and to generate relevant metrics.
An interpolating function was fitted to the 3D dose map of the first time point given by MC calculations (this was done by using the MATLAB function scattered Interpolant() with the linear method option on the dataset available: the result is a 3D interpolant that describes the dose of the first time-point as a function of x, y and z). This function was then projected onto the moving geometry/structures (their movement determined by NURBS) and the accumulated dose was determined.
This approach was intended as a tool to drive the selection of irradiation parameters through an optimisation routine, but it must not lead to absolute results: the accuracy of the estimated doses must be assessed using systematic calculations of the selected configuration.
CT blurring
The standard cone-beam CT (CBCT) scanning protocol at our institution uses a gantry speed of 0.5 rpm, which yields a CT scan beam-on time of 120 s. In this period, 60 to 300 breathing cycles would occur. To analyse the effect of the long scan period on the tumour shape and the CT blurring, the software VOXelised CT SImulator (VOXSI)19 was used. Further information on this method is in Supplementary Material.
results
Full-treatment quality
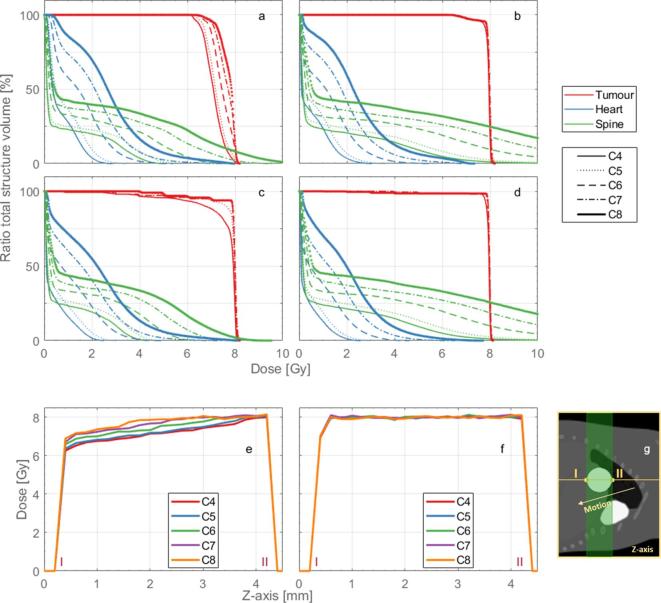
Figure 3a–d present the DVHs for the full treatment plans of the contrasting positions P1 and P4, respectively. Although the coverage of the tumour (and the OAR) increases with the increasing collimator diameter, a homogeneous dose distribution is never achieved for the totality of the volume. This effect is explicit in Figure 3e,f; the tumour dose profiles show the dose gradient in agreement with the motion illustrated in Figure 3g. Additionally, the DVHs of the OARs become unacceptable for larger collimator diameters. As expected, the respiratory motion affects treatment quality; the anaesthesia curve cases at P1 present the worst overall results.
Figure 3.
Full treatment dose-volume histograms of the 4-mm tumour for the anaesthesia curve (a) at position 1, (b) at position 4; for the tidal curve (c) at position 1, (d) at position 4. The different shades (or colours for the online publication) represent the different structures and the line styles the different collimator diameter sizes, 4–8 mm (C4, C5, C6, C6, C7 and C8). Tumour dose profiles for the 4 mm tumour at position 1 for the (e) anaesthesia and the (f) tidal curve. (g) Representation of the location where the dose profiles were drawn, the roman numerals are displayed in (e)–(g) and the arrow indicates the motion direction.
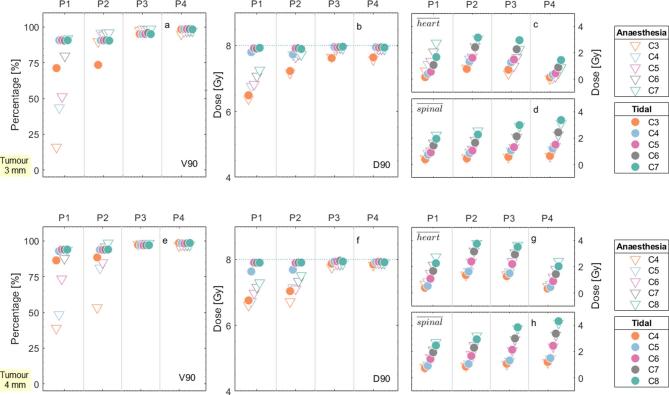
The results for the parameters V90 and D90, Figure 4a,e,b,f, were in agreement with the DVH results: they are increasingly lower for sites where motion plays a large role. Additionally, for the cases in which the diameter of the collimator was identical to the diameter of the tumour, both V90 and D90 presented lower values of coverage and dose. Anaesthesia patterns with higher respiratory frequency but the same duration of the breathing phase, are expected to present worse results in terms of tumour coverage for similar diaphragm and AP displacement amplitudes as the motion phase would relatively be more important.
Figure 4.
DVH metrics for the four different tumour positions, represented by P1, P2, P3 and P4 at the abscissa axis, for the (a, b, c and d) 3 mm tumour and the e, f, g and h) 4-mm tumour. The circles and the triangles depict the anaesthesia and the tidal curves, respectively. The shades (or colours for the online publication) illustrate the different collimator sizes, ranging from 3 mm (C3) to 8 mm (C8). (a) and (e) show the V90 of the tumour, (b, f) the D90 of the tumour, (c, g) the mean dose to the heart and d,h) the mean dose to the spinal cord. The dotted line on (b, f) indicate the prescription dose of 8 Gy. DVH, dose-volume histogram.
The mean doses to the OARs (Figure 4c,d,g,h) increase with the collimator size and vary with the tumour position, as their location can be more or less susceptible to the diameter of the treatment beam.
Margin function
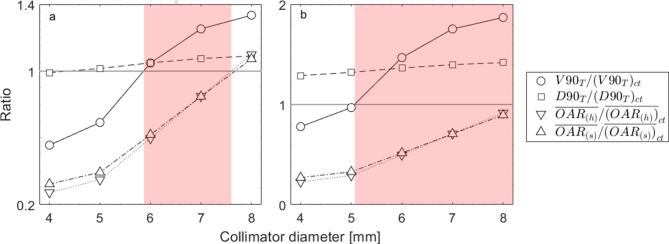
The cost function (Equations 1 and 2) was applied to the previously presented metrics. In Figure 5a, a generic case with the somewhat arbitrarily selected constraint values for V90, D90 and mean dose to each OAR of 70%, 6.5 Gy and 2.5 Gy, is described. The solution domain is represented by the shaded region, where the ratio value of the first pair of tumour constraints is maximised and the value of the remaining OAR constraints is minimised, which yields a minimum collimator size of 5.8 mm and maximum of 7.6 mm. For a more lenient case with V90 of 50%, D90 of 5 Gy and mean dose to each OAR of 3 Gy, depicted in Figure 5b, the solution is domain broader, a collimator diameter of 5.1 mm would suffice. For extreme cases of tolerance or rigorousness, the solution can be the entire domain or the function may present no solution.
Figure 5.
Graphical representation of the cost function constraint ratios and solution domains (represented by the shaded region), with (a) a generic and (b) a more lenient case. The circles and the squares illustrate the V90 and D90 constraint ratio to the tumour, respectively. The downward and the upward-pointing triangles illustrate the mean dose constraint ratio to the heart and the spinal cord, respectively. The grey line crossing the ordinate axis at value one represents the boundary, to which the constraints are maximised or minimised. The data for the 4 mm tumour, P1, anaesthesia curve case were used here.
Dose interpolation
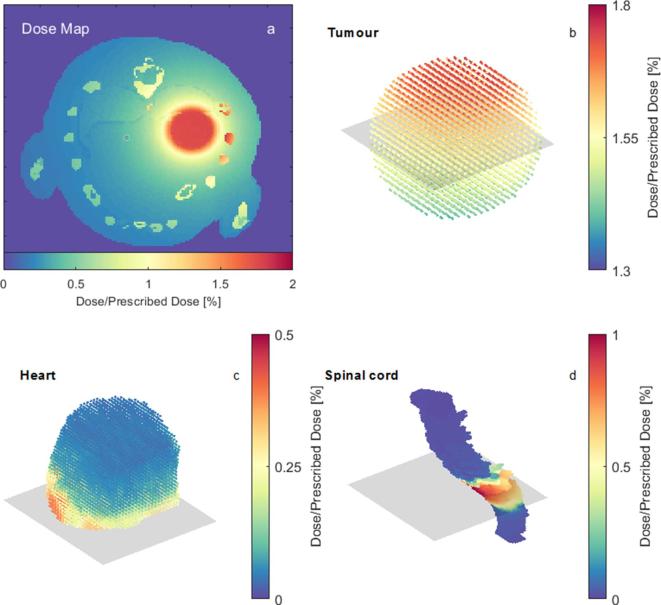
The interpolation function was fitted onto the MC 3D dose map of the first time point, illustrated by Figure 6a, and projected upon the moving structures, for which the dose distributions are represented by Figure 6b–d.
Figure 6.
(a) Axial view of the 3D dose-map of the first time-point. (b–d) Dose distributions at the structures tumour, heart and spinal cord, respectively, at the first time-point. The rectangular shaded region in 6b-d represents the slice of the dose-map shown in b–d represent a case with the tumour located at P1 and anaesthetised breathing.
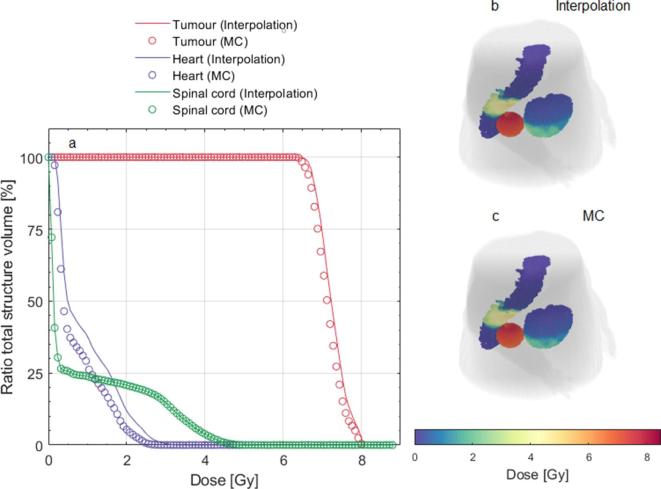
Figure 7a–c present a comparison between the dose interpolation from a single dose calculation and the full MC results. For the spinal cord, which is less affected by movement, the interpolation showed excellent results, with no relative difference in respect to the MC results. For the tumour and the heart, average DVH differences of 1.5 and 28.9% were found, respectively. Figure 7a show an overestimation of the heart and tumour DVHs using the interpolation method. The computational time to run the interpolation function on a laptop (Intel® Core™ i7-5600-CPU 2.6 GHz, 16 GB of RAM) was 10 min in contrast to the 4–6 h for the full MC.
Figure 7.
Comparison between the dose interpolation and full MC methods. (a) DVHs of the structures tumour, heart and spinal cord for both methods. (b, c) Interpolation and MC dose at the end of the treatment represented by the dose map of the 3D structures.
Discussion
The effect of the respiratory motion on the treatment plan quality is strongly dependent on the breathing pattern and the tumour position. Both breathing curves explored in this study on mathematical phantoms represent real, but somewhat extreme scenarios. It is reasonable to assume that the actual breathing curve of a mouse undergoing CT imaging or irradiation would lie somewhere between these two curves and would vary according to the anaesthesia protocol and the respiratory and cardiac rates the animal would exhibit, as the recommendations for anaesthesia methods vary among institutions.20–23 A sedation scenario with minimal motion while physically restraining the specimen would be ideal.
For pulmonary sites, where substantial influence of anatomical movement is expected, the tumour position itself had an extensive effect on the quality of the treatment plan. Differences of 82 and 29% were found in the values of V90 and D90, respectively, for plans with the same tumour size (3 mm), breathing curve (anaesthesia) and collimator (C3) but different tumour positions (P1 and P4), Figure 4a,b. The plans for P3 and P4 presented the best overall results, while P1 and P2 had invariably a compromise between tumour conformity and health tissue dose. For tumours located at the diaphragm (P1), a PTV margin delineation is strongly recommended to avoid target dose gradients in the tumour itself.
The margin function presented can be a useful tool to ensure treatment conformity and OAR sparing for the various tumour positions. The constraints are adjustable, more sensitive parameters such as D95 and V95 could be employed or other constraints added. Different weights can be applied to the mean dose to the OARs and their values could be based on radiobiological information. This function is independent of the breathing curve; it could be applied for other curves and irradiation regimens. It is also suitable for irradiators with variable collimator sizes. Although only results for circular collimators were presented, it is possible to expand the function to other shapes.
Additional parameters should also be taken into account when establishing the concept of PTV. This study showed a first step towards establishing a margin recipe, which comprises respiratory motion. Setup and fractionation errors should also be estimated and considered. For example, accurate collimator positioning and quality assurance are of paramount importance for proper dose reporting.
Furthermore, cardio-thoracic sites could benefit from the use of motion tracking and gating techniques for imaging24 and irradiation.25 Selective acquisition during the rest phase of the breathing cycle, and choosing these intervals for radiation delivery, can be effective in reducing respiratory artefacts and ensure optimal dose delivery to the target and minimal dose to surrounding tissues, especially for orthotopic tumours.
Independently of the margin function, the investigation of an interpolation function for dose accumulation from different anatomic phases to a reference phase using a rigid grid had the purpose of speeding up the dose calculation process. The method, also called direct dose mapping,26 is a first approximation as it does not account for tissue deformation and the cardiac motion was not modelled. The results, an average difference of 0, 1.5 and 28.9% for the structures spinal cord, tumour and heart, between the interpolated and the full MC dose, and calculation time at least 10 times faster, are promising for further development of the technique. Results may depend on the targeted site and surrounding anatomy. As this method employs the first frame as the reference phase, in reality, the dose map derived from the CBCT scan would be subject to noise and blurring. This matter was investigated in the supplementary materials, and the effect was found to be minimal, although further assessment would be ideal. The presented technique could potentially be used for adaptive radiotherapy, which requires the daily delivered dose to be accumulated.
Conclusion
Respiratory motion plays an important role in dose conformity when targeting thoracic tumours. It is recommended to add a target margin, especially for tumours on sites where movement is substantial, such as the diaphragm. A simple method was developed to derive tumour margins based on a number of initial user inputs avoiding the need of extensive MC calculations. It is a first step towards a standard PTV concept in pre-clinical radiotherapy. The use of direct dose mapping yielded an acceptable approximation for the cases presented, with decreased calculation cost.
In future work, different tumour sites and the influence of other parameters (e.g. collimator shape) could be similarly investigated and a series of visual tools like the one depicted in Figure 5 could be generated: these would represent a quick aid, available to the end-user for selecting treatment features by simply imposing dose/volume constraints on the tumour or OARs.
Footnotes
Acknowledgement: The authors would like to thank Dr Gabriel P Fonseca for useful discussions.
Competing interest: FV and SvH are the founders of SmART Scientific Solutions (Maastricht, Netherlands). In addition, FV and SvH declare that they have received research funding from Precision X-ray (North Branford, CT) and have commercial interests with this company.
Funding: AV acknowledges financial support from CAPES Scholarship and Science without Borders program from Brazil (BEX 12030/13–9).
Contributor Information
Ana Vaniqui, Email: ana.vaniqui@maastro.nl;anavaniqui@gmail.com.
Brent van der Heyden, Email: brent.vanderheyden@maastro.nl.
Isabel P Almeida, Email: isabel.dealmeida@maastro.nl.
Lotte EJR Schyns, Email: lotte.schyns@maastro.nl.
Stefan J van Hoof, Email: stefan.vanhoof@smartscientific.nl.
Frank Verhaegen, Email: frank.verhaegen@maastro.nl.
REFERENCES
- 1.Verhaegen F, Dubois L, Gianolini S, Hill MA, Karger CP, Lauber K, et al. . ESTRO ACROP: technology for precision small animal radiotherapy research: Optimal use and challenges. Radiother Oncol 2018; 126: 471–8. doi: 10.1016/j.radonc.2017.11.016 [DOI] [PubMed] [Google Scholar]
- 2.Landberg T, Almond P, Burgers JMV, Busch M, Joslin CA, Paunier JP. Report 29. J ICRU 1978; os15: NP–NP. doi: 10.1093/jicru/os15.2.Report29 [DOI] [Google Scholar]
- 3.Landberg T, Chavaudra J, Dobbs J, Gerard J-P, Hanks G, Horiot J-C, et al. . Report 62. J ICRU 1999; os32: NP–NP. doi: 10.1093/jicru/os32.1.Report62 [DOI] [Google Scholar]
- 4.Landberg T, Chavaudra J, Dobbs J, Hanks G, Johansson K-A, Möller T, et al. . Report 50. J ICRU 1993; os26: NP–NP. doi: 10.1093/jicru/os26.1.Report50 [DOI] [Google Scholar]
- 5.van Herk M, Remeijer P, Rasch C, Lebesque JV. The probability of correct target dosage: dose-population histograms for deriving treatment margins in radiotherapy. Int J Radiat Oncol Biol Phys 2000; 47: 1121–35. doi: 10.1016/S0360-3016(00)00518-6 [DOI] [PubMed] [Google Scholar]
- 6.McKenzie AL, van Herk M, Mijnheer B. The width of margins in radiotherapy treatment plans. Phys Med Biol 2000; 45: 3331–42. doi: 10.1088/0031-9155/45/11/315 [DOI] [PubMed] [Google Scholar]
- 7.Stroom JC, de Boer HC, Huizenga H, Visser AG. Inclusion of geometrical uncertainties in radiotherapy treatment planning by means of coverage probability. Int J Radiat Oncol Biol Phys 1999; 43: 905–19. doi: 10.1016/S0360-3016(98)00468-4 [DOI] [PubMed] [Google Scholar]
- 8.Stroom J, Gilhuijs K, Vieira S, Chen W, Salguero J, Moser E, et al. . Combined recipe for clinical target volume and planning target volume margins. Int J Radiat Oncol Biol Phys 2014; 88: 708–14. doi: 10.1016/j.ijrobp.2013.08.028 [DOI] [PubMed] [Google Scholar]
- 9.Gordon JJ, Siebers JV. Convolution method and CTV-to-PTV margins for finite fractions and small systematic errors. Phys Med Biol 2007; 52: 1967–90. doi: 10.1088/0031-9155/52/7/013 [DOI] [PubMed] [Google Scholar]
- 10.van Herk M. Errors and margins in radiotherapy. Semin Radiat Oncol 2004; 14: 52–64. doi: 10.1053/j.semradonc.2003.10.003 [DOI] [PubMed] [Google Scholar]
- 11.Segars WP, Tsui BM, Frey EC, Johnson GA, Berr SS. Development of a 4-D digital mouse phantom for molecular imaging research. Mol Imaging Biol 2004; 6: 149–59. doi: 10.1016/j.mibio.2004.03.002 [DOI] [PubMed] [Google Scholar]
- 12.White DR, Booz J, Griffith RV, Spokas JJ, Wilson IJ. Report 44. J ICRU 1989; os23: NP. doi: 10.1093/jicru/os23.1.Report44 [DOI] [Google Scholar]
- 13.Vaniqui A, Schyns L, Almeida IP, van der Heyden B, van Hoof SJ, Verhaegen F. The impact of dual energy CT imaging on dose calculations for pre-clinical studies. Radiat Oncol 2017; 12: 181. doi: 10.1186/s13014-017-0922-9 [DOI] [PMC free article] [PubMed] [Google Scholar]
- 14.van der Heyden B, van Hoof SJ, Schyns LE, Verhaegen F. The influence of respiratory motion on dose delivery in a mouse lung tumour irradiation using the 4D MOBY phantom. Br J Radiol 2017; 90: 20160419. doi: 10.1259/bjr.20160419 [DOI] [PMC free article] [PubMed] [Google Scholar]
- 15.van Hoof SJ, Granton PV, Verhaegen F. Development and validation of a treatment planning system for small animal radiotherapy: SmART-Plan. Radiother Oncol 2013; 109: 361–6. doi: 10.1016/j.radonc.2013.10.003 [DOI] [PubMed] [Google Scholar]
- 16.Ma CM, Coffey CW, DeWerd LA, Liu C, Nath R, Seltzer SM, et al. . AAPM protocol for 40-300 kV x-ray beam dosimetry in radiotherapy and radiobiology. Med Phys 2001; 28: 868–93. doi: 10.1118/1.1374247 [DOI] [PubMed] [Google Scholar]
- 17.Ma C, Reckwerdt P, Holmes M, Rogers D, Geiser B. DOSXYZ users manual; 1995. [Google Scholar]
- 18.Kawrakow I, Rogers D. The EGSnrc code system: Monte Carlo simulation of electron and photon transport; 2000. [Google Scholar]
- 19.van der Heyden B, Schyns LEJR, Podesta M, Vaniqui A, Almeida IP, Landry G, et al. . VOXSI: a voxelized single- and dual-energy CT scenario generator for quantitative imaging. Phys Imaging Radiat Oncol 2018; 6: 47–52. doi: 10.1016/j.phro.2018.05.004 [DOI] [PMC free article] [PubMed] [Google Scholar]
- 20.Tremoleda JL, Kerton A, Gsell W. Anaesthesia and physiological monitoring during in vivo imaging of laboratory rodents: considerations on experimental outcomes and animal welfare. EJNMMI Res 2012; 2: 44. doi: 10.1186/2191-219X-2-44 [DOI] [PMC free article] [PubMed] [Google Scholar]
- 21.Tsukamoto A, Serizawa K, Sato R, Yamazaki J, Inomata T. Vital signs monitoring during injectable and inhalant anesthesia in mice. Exp Anim 2015; 64: 57–64. doi: 10.1538/expanim.14-0050 [DOI] [PMC free article] [PubMed] [Google Scholar]
- 22. University of Minnesota. Anesthesia Guidelines: Mice; 2018. [Google Scholar]
- 23. Michigan Medicine Confluence. Guidelines on Anesthesia and Analgesia in Rats; 2013. [Google Scholar]
- 24.Bartling SH, Kuntz J, Semmler W. Gating in small-animal cardio-thoracic CT. Methods 2010; 50: 42–9. doi: 10.1016/j.ymeth.2009.07.006 [DOI] [PubMed] [Google Scholar]
- 25.Hill MA, Thompson JM, Kavanagh A, Tullis IDC, Newman RG, Prentice J, et al. . The development of technology for effective respiratory-gated irradiation using an image-guided small animal irradiator. Radiat Res 2017; 188: 247–63. doi: 10.1667/RR14753.1 [DOI] [PubMed] [Google Scholar]
- 26.Li HS, Zhong H, Kim J, Glide-Hurst C, Gulam M, Nurushev TS, et al. . Direct dose mapping versus energy/mass transfer mapping for 4D dose accumulation: fundamental differences and dosimetric consequences. Phys Med Biol 2014; 59: 173–88. doi: 10.1088/0031-9155/59/1/173 [DOI] [PMC free article] [PubMed] [Google Scholar]


