Abstract
Difficulty in visualizing glioma margins intraoperatively remains a major issue in the achievement of gross total tumor resection and, thus, better clinical outcome of glioblastoma (GBM) patients. Here we investigated the potential of a new combined optical + optoacoustic imaging method for intraoperative brain tumor delineation. We devised a strategy using our newly developed gold nanostar synthesis method, Raman reporter chemistry, and silication method to produce dual-modality contrast agents for combined surface-enhanced resonance Raman scattering (SERRS)- and multispectral optoacoustic tomography (MSOT) imaging. Following intravenously injection of the SERRS-MSOT-nanostars in brain tumor bearing Nestin-tv-a;Ink4a/Arf−/−;Ptenfl/fl mice, sequential cross-sectional MSOT imaging was performed in vivo and followed by ex vivo Raman imaging for analysis of signal congruency.
MSOT was able to accurately depict GBMs up to a depth of several millimeters three-dimensionally with high specificity. The MSOT signal was found to correlate well with the SERRS images. Because SERRS enables uniquely sensitive high resolution surface detection, it could represent an ideal complementary imaging modality to MSOT, which enables real-time, deep tissue imaging in 3D. This dual-modality SERRS-MSOT-nanostar contrast agent reported here was shown to enable high precision depiction of the extent of infiltrating GBMs by Raman- and MSOT imaging in a clinically relevant murine GBM model and could pave new ways for improved image-guided resection of brain tumors.
Keywords: Multispectral optoacoustic tomography (MSOT), photoacoustic imaging, surface-enhanced resonance Raman spectroscopy (SERRS), nanomedicine, glioblastoma, neurooncology
Graphical Abstract
1. Introduction
Survival in glioblastoma (GBM), the deadliest and most common primary brain cancer, is independently linked to the completeness of surgical resection in primary and recurrent disease.[1–3] Due to its invasive growth, defining the tumor border intraoperatively remains the crucial issue that surgeon face in achieving a gross total tumor resection while preserving neurological function.[4] In an effort to better visualize the glioma margins, to date a wide variety of techniques have been explored. One of the most significant developments is preoperative, contrast-enhanced magnetic resonance imaging (MRI) using small molecule agents, such as gadolinium, that visualize blood-brain-barrier (BBB) disruption within (parts of) the tumor to determine its macroscopic outline and guide the surgeon intraoperatively using neuronavigational devices. Unfortunately, this approach suffers from limited spatial resolution and incongruences between preoperative MRI and actual tumor borders during surgery due to brain shift.[5] Intraoperative MRI, on the other hand, is costly, time consuming, and requires repeated gadolinium injections due to the short blood half-life of its chelates leading to high dosages and inaccuracies due to surgically induced false-positive contrast-enhancement.[6–9]
To address these limitations, several intraoperative optical imaging methods have been explored, either based on the tissue’s intrinsic optical properties using spectroscopic approaches[10–13] or through application of exogenous contrast agents.[2, 9, 14, 15] In fact, 5-aminolevulinic acid (5-ALA) – a metabolic precursor of fluorescent porphyrin IX (PpIX) – that is administered to patients to enable fluorescence-guided resection of GBM has become the standard of care in Europe.[2, 4] However, due to the suboptimal optical properties of PpIX, the technique suffers from poor specificity due to autofluorescence of non-tumorous brain tissue and subjectivity in the interpretation of the signal intensity as well as the limited resolution of fluorescence imaging and its depth of penetration.[14, 16–18]
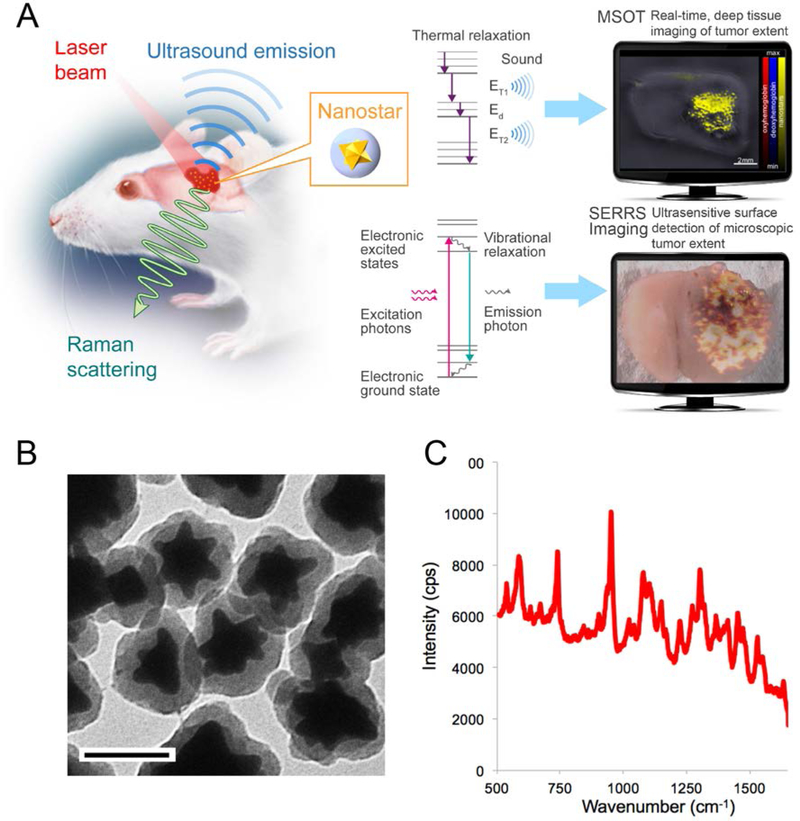
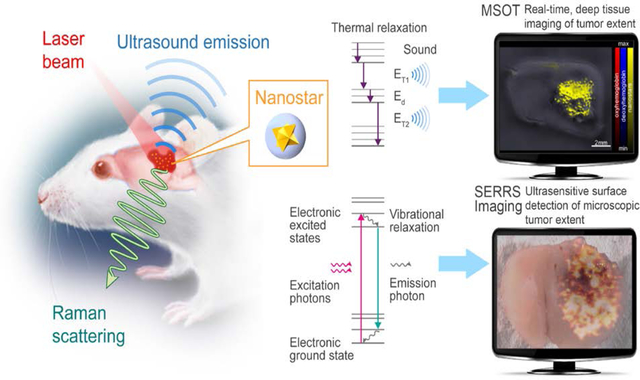
To overcome these impediments, we investigated a dual-modality contrast agent that combines the unprecedented signal sensitivity and specificity of Raman imaging with the deep-tissue imaging properties of optoacoustic imaging to maximize tumor detection and improve its delineation. Raman imaging is a well-established bioanalytical tool with several key advantages including excellent sensitivity, high resolution, photostability, and essentially absent autofluorescence issues. Development of surface-enhanced Raman Resonance scattering (SERRS) nanostars resonant in the near-infrared (NIR) wavelength range has recently been shown to enable precise tumor border delineation in experimental GBMs[19, 20] as well as various other cancer models.[21] However, since Raman imaging is depth limited, migrated tumor satellites frequently occurring in GBM may be overlooked during resection. The complementary use of multispectral optoacoustic tomography (MSOT) can mitigate this by providing real-time images from a depth of several centimeters in living tissues using a handheld approach, as previously shown in both small animal and clinical imaging studies in vivo.[22, 23] Therefore, in the current work we investigated whether SERRS-nanostars may provide additional advantageous MSOT contrast in the NIR, explored their limitations and tested whether the dual-modality approach was feasible for the complementary delineation of the tumor extent in a state-of-the-art transgenic mouse model of GBM (Figure 1).
Figure 1. Concept of dual-modal SERRS-MSOT-mediated detection of GBM.
A. SERRS-MSOT-nanostars for GBM detection concept. The nanostars home to the tumor after intravenous injection. The two methods MSOT and SERRS imaging detect the same dual-modal nanoparticle, but deliver different, highly complementary information. MSOT allows real-time, deep tissue and three-dimensional assessment of the macroscopic tumor extent, which can give a surgeon a fast overview of the overall tumor extent and guide the macroscopic resection steps. In contrast, SERRS imaging provides unparalleled sensitivity and signal specificity and reveals the true microscopic extent of the tumor. This method could enable the surgeon to resect the tumor completely without any otherwise invisible microscopic tumor being missed, while at the same time preventing any unnecessary resection of healthy neurological structures. B, Transmission electron micrograph of the SERRS-MSOT-nanostars (scale bar = 100 nm); C, SERRS spectrum of the SERRS-MSOT-nanostars.
2. Results and Discussion
Characterization of SERRS-MSOT-nanostars
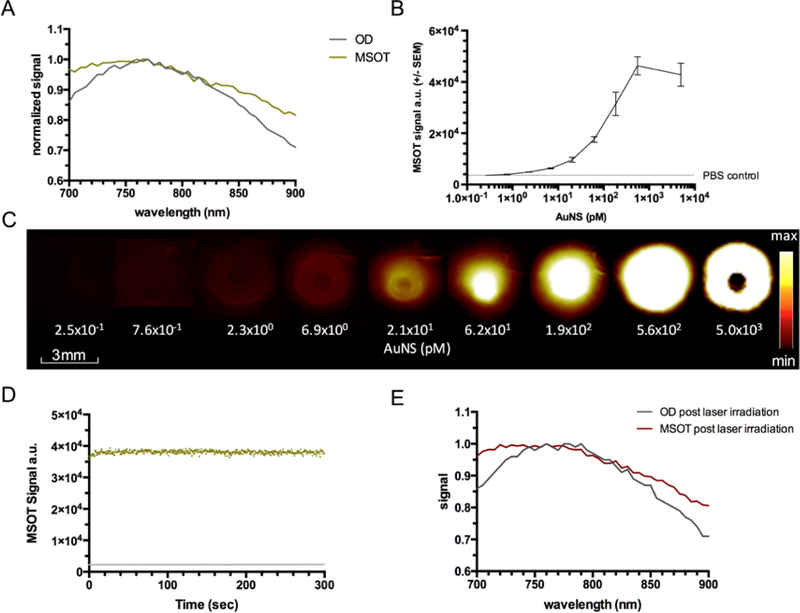
The SERRS-MSOT-nanostars are composed of a gold nanostar core that is encapsulated with an IR780-embedded silica layer functionalized with methoxy-terminated polyethyleneglycol (PEG; 2 kDa). They have a median size of ~100 nm (Figure 1) and have a maximum localized surface plasmon resonance (LSPR) wavelength of 770 nm as measured on a UV/VIS spectrometer (Figure 2A). The optical density spectrum of the SERRS-MSOT-nanostars, as measured by MSOT, matched this absorption spectrum, further underlining their suitability as a MSOT contrast agent (Figure 2A). Next, we established the limit of detection (LOD) of the SERRS-MSOT-nanostars by MSOT in a tissue mimicking phantom. The LOD was found to be in the low picomolar range with 0.76 pM being the lowest concentration tested that resulted in a mean unmixed MSOT signal of the nanostars to be significantly higher than the control solution (P < 0.001, n = 3, Figure 2B–C). This LODMSOT is already more sensitive than most other tomographic imaging modalities. However, the LODSERRS, previously reported as 1.5 fM[21], is even much more sensitive by nearly three orders of magnitude. This illustrates the complementary strengths of the two modalities (MSOT deeper tissue penetration and real-time, SERRS more sensitive). Lastly, we assessed the photostability of the SERRS-MSOT-nanostars (0.19 nM in PBS) for a loss of signal or spectral changes during continuous pulsed laser illumination. After 5 minutes of pulsed laser irradiation, no effects on the MSOT signal intensity was observed, and the spectral curves were essentially identical compared to the non-irradiated SERRS-MSOT-nanostars (Figure 2D–E).
Figure 2. Characterization of SERRS-MSOT-nanostars using MSOT.
A. The optical absorption and MSOT spectra of the SERRS-MSOT-nanostars in the NIR window grossly matched with a broad absorption peak around 770 nm. B, C. In a tissue mimicking phantom the limit of detection of the nanostars by MSOT was found to be in the low picomolar range when compared to PBS control. Image saturation was reached at around 0.6 nM (representative of triplicates). D, E. The SERRS-MSOT-nanostars were found to be photostable with regard to signal quantification as well as absorption and MSOT spectra in the NIR window despite continuous pulsed laser exposure over 5 minutes.
Pharmacokinetic assessment of SERRS-MSOT-nanostars by GBM using MSOT imaging.
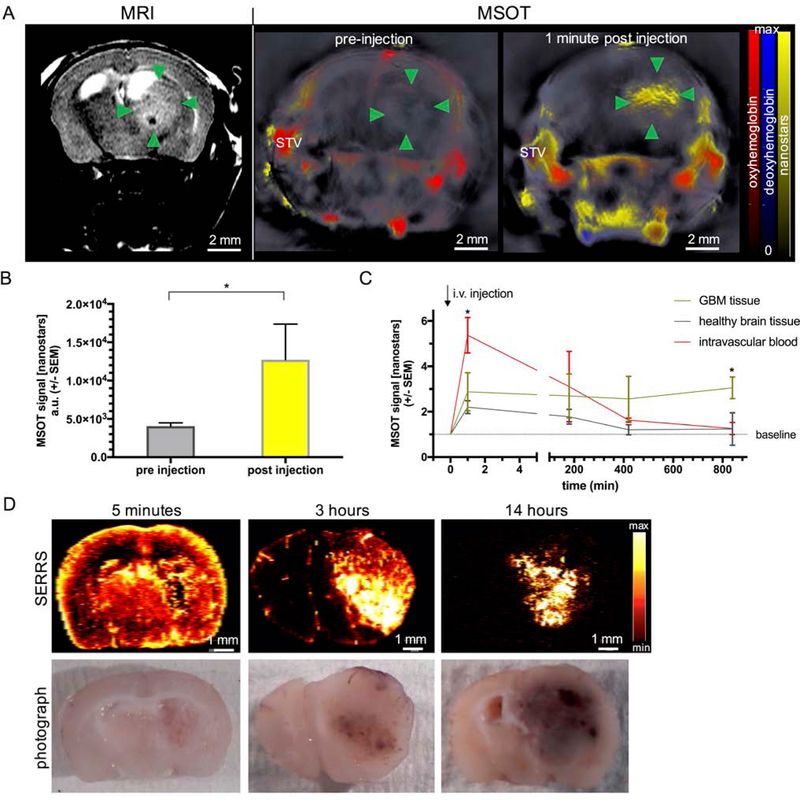
To monitor tumor growth, Nestin-tv-a;Ink4a/Arf−/−;Ptenfl/fl mice with RCAS-PDGFB virus transformation as well as Ink4a/Arf and Pten gene deletion were imaged by T2-weighted MRI on a weekly basis. When the tumors reached a size of ~2.5 mm as assessed by MRI, MSOT imaging was performed prior and immediately after intravenous injection of the SERRS-MSOT-nanostars (Figure 3A). Prior to the SERRS-MSOT-nanostar injection, a lesion is clearly visible on T2 weighted MRI (green arrow points) but not on the MSOT images. However, immediately after SERRS-MSOT-nanostar administration, the mean tumor MSOT signal (unmixed for SERRS-MSOT-nanostars) was significantly higher compared to the baseline signal 1 min post injection (P < 0.05, n = 3, Figure 3A–B). By assuming that no significant tumor accumulation of the SERRS-MSOT-nanostars at this very early time point should occur, while further observing that the unmixed SERRS-MSOT-nanostar signal overlapped with the unmixed oxyhemoglobin signal, one may conclude that tumor demarcation is perfusion-based. We determined the blood clearance of the SERRS-MSOT-nanostars intraindividually using in vivo MSOT and found no significant remnant SERRS-MSOT-nanostar signal at t=14 h post injection in the circulation nor in the contralateral healthy brain tissue relative to the baseline (Figure 3C). Furthermore, the tumor accumulation reached a maximum at this time point as well. The unmixed MSOT signal in the tumor ROI was found to be three times higher than the baseline values (P < 0.05, n = 2, two-way ANOVA, Figure 3C). Of note, control injection of PBS alone did not elicit detectable MSOT signal when unmixed for the SERRS-MSOT-nanostar spectrum (Figure 4).
Figure 3. Pharmacokinetic profile of SERRS-MSOT-nanostars in GBM-bearing mice.
A, B, Intravenous administration of the SERRS-MSOT-nanostars in GBM-bearing mice as monitored by T2 weighted MRI led to significantly increased MSOT signal unmixed for the nanostars (yellow) in the tumorous area (green arrowheads) as well as the blood circulation (STV = superficial temporal artery and vein, *P < 0.05, representative example of n = 3). C. The peak signal in the blood stream gradually declined over the course of hours post injection. No remnant signal deriving from the nanostars was detectable by MSOT in the blood or the healthy brain tissue area on the contralateral hemisphere compared to baseline at t=14 h (*P < 0.05). D. The pharmacokinetic profile of the nanostars over the course of 14 hours post intravenous injection is confirmed by ex vivo SERRS Raman imaging.
Figure 4. Signal specificity of contrast-enhanced MSOT.
In interindividual comparison, the intravenous injection of SERRS-MSOT-nanostars and subsequent accumulation (yellow) in the tumor of glioblastoma bearing mice (n = 7) led to significantly higher signal unmixed for the nanostars in the tumor ROI than the control tumor mice (n = 2) that were injected with an equal volume of PBS alone (*P < 0.05).
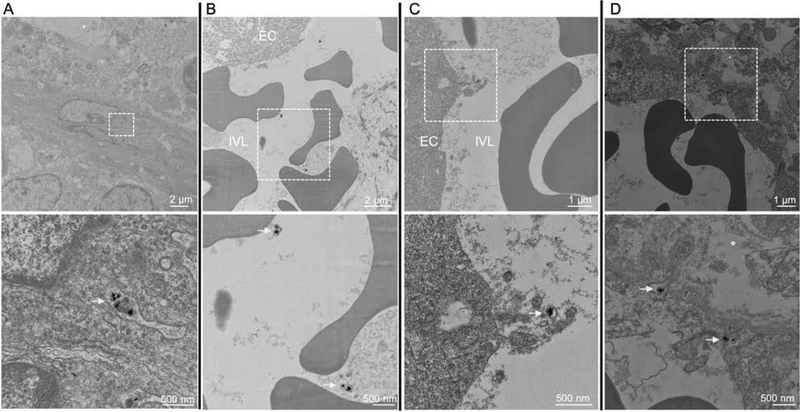
The pharmacokinetic profiles of the SERRS-MSOT-nanostars, as determined by MSOT, were corroborated interindividually using SERRS imaging. As shown in Figure 3D, the SERRS-MSOT-nanoparticles were found to be concentrated in highly perfused areas of the brain (i.e. cortex, GBM, basal ganglia) 5 minutes post injection. At t=3 h post injection, the SERRS-signal was mainly contained within the tumor area and, mostly, small vessels in the subarachnoid space along the sulci. This observation demonstrates the gradual clearance of the nanoparticles from the circulation and accumulation within the GBM over the course of several hours. At t=14 h, maximal tumor-to-background signal was observed. Transmission electron microscopy revealed that SERRS-MSOT-nanostars had specifically accumulated within the GBM relative to the healthy, SERRS signal-negative brain samples (Figure 5). Furthermore, no signs of particle aggregation, degradation, shape or structural conformity changes following MSOT and Raman imaging were observed on TEM (Figure 5).
Figure 5. TEM images of brain tumor tissue section following SERRS-MSOT-nanostar injection.
A, B. SERRS-MSOT-nanostars (yellow arrows) circulating in the blood stream with no signs of aggregation, degradation or change of shape and subsequent C, D being taken up from the lumen into the endothelium within the glioblastoma (dashed boxes in upper row indicate the regions that are shown magnified in the lower row). EC = endothelial cell; IVL = intravascular lumen. Of note, we did not observe any nanostars in the samples taken from the contralateral healthy hemisphere 14 hours post injection.
The pharmacokinetic profile of the SERRS-MSOT-nanostars has been shown to provide several advantages over the use of small molecule contrast agents like gadolinium routinely used in intraoperative MRI-based delineation of GBM.[6–8] Since it is widely established that GBM growth leads to significant disruption of the blood-brain barrier, the SERRS-MSOT-nanostars extravasate into perivascular niches of the highly vascularized tumor and, as a result of enhanced retention due to their size (~100 nm), retained within the tumor.[24] The prolonged retention of SERRS-MSOT-nanostars within the tumor therefore enables intraoperative image-guidance following a single intravenous SERRS-MSOT-nanostar injection, which obviates the need for repetitive administrations during surgery as is the case for gadolinium-based agents.
Signal specificity and intermodal congruency
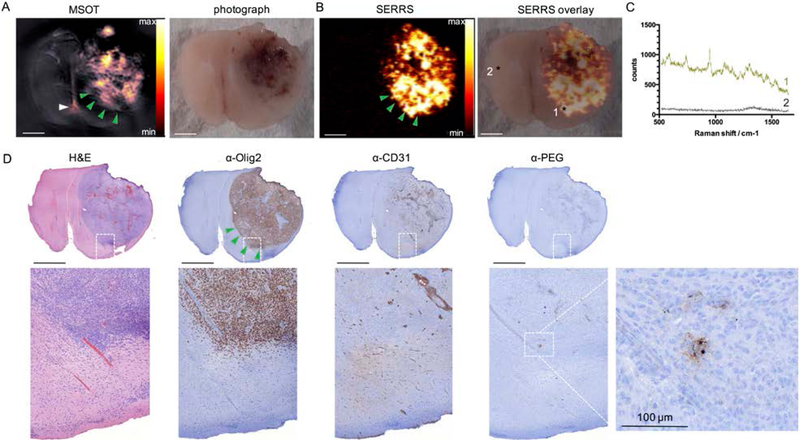
To assess the signal specificity and cross-validation between the modalities, we imaged the same GBM-containing brain section of a mouse that was sacrificed at t=14 h after intravenous injection of the SERRS-MSOT-nanostars. Using MSOT and illuminating transcortically from multiple directions rather than solely from the top (as with Raman), the gross tumor mass could be depicted by MSOT due to the nanostar-mediated optoacoustic contrast generated at several millimeters depth in tissue (Figure 6A; MSOT). This observation underscored the potential of MSOT as a powerful deep tissue screening tool that can give the surgeon a three-dimensional roadmap to plan the gross resection steps. As shown in Figure 6B, Raman imaging enabled highly sensitive detection of GBM. Analysis of the Raman spectroscopic data showed the typical Raman fingerprint of our nanoparticles in the tumor (*1), while the spectra taken from the contralateral healthy hemisphere confirmed the absence of the nanoparticles (*2) at t=14 h post injection (Figure 6C). In fact, upon careful correlation with histopathological and immunohistochemical (IHC) examinations, the specific signal from the SERRS-MSOT-nanostars (Figure 6C) was only observed in the tumor area (Figure 6B–D). We found that, in comparison with the MSOT signal, the SERRS signal of the nanostars was more sensitive in detecting the true microscopic extent of the tumor, especially at the tumor margins where GBMs are known to invade into the surrounding brain parenchyma in a diffuse fashion (green arrowheads, Figure 6A–B, D). These diffuse infiltrations of loosely scattered tumor cells cannot be detected by a surgeon with the naked eye, which is a major reason why GBMs recur after surgery.
Figure 6. Performance comparison between MSOT and SERRS imaging of SERRS-MSOT-nanoparticles in a GBM tissue section A, B.
Representative example of the excellent dual-modality capabilities of the SERRS-MSOT-nanostars which depict GBM in a mouse model that faithfully recapitulates human GBMs. C. Raman spectrum of tumor (1) and normal brain tissue (2). D. Tissue sections were stained with H&E and IHC staining for Olig-2 (tumor marker), CD31 (neovasulature), and PEG (nanoparticle stain). Scale bars, 2 mm (unless indicated otherwise).
The corresponding MSOT images of the same transverse brain tumor sections revealed to be less sensitive in the border areas of the tumor (green arrowheads upper left), again demonstrating how the two modalities complement each other. The MSOT signal unmixed for the particles was also found to be less specific than the SERRS signal as small areas containing neither tumorous tissue nor nanostars showed false-positive signal (white arrowhead). The signal interfered in this case with a small dark coagulated blood clot in the interhemispheric subarachnoid gap. On the other hand, MSOT was acquired by a transcortical illumination pattern from the sides depicting several millimeters of depths while the Raman signal is limited to the surface of the brain slice. The resolution of depth MSOT provides in comparison shows its excellent complimentary screening tool. While SERRS enables high sensitivity which reveals the microscopic spread of GBMs, the great strength of MSOT is its higher depth penetration. MSOT was able to detect the SERRS-MSOT-nanostars throughout the entire volume of a mouse brain transcortically and spatial resolution well in the submillimeter range, which is consistent with previous reports using other absorbers in the brain.[22, 25] Due to the limited size of a mouse brain, we were not able to confirm the maximum achievable MSOT penetration, as reported in previous studies.[22, 23] Nevertheless, in terms of depth-resolved imaging capacity, MSOT readily outperformed the current clinical optical standard used for malignant glioma surgery, 5-ALA. 5-ALA is only able to depict the approx. first 1 mm of the resection bed, thus potentially missing tumor lesions that have migrated deeper, as frequently observed in GBMs.[14, 17] One limitation we observed with MSOT were some instances of false-positive unmixed signal when increasing the imaging depth, (Figure 6; white arrowhead), which we did not observe with SERRS-imaging. A microscopic dark blood clot in the interhemispheric gap interfered with the signal as it strongly absorbed the NIR light across wavelengths with a rather broad OD spectrum. This is an indication that specificity of the optoacoustic signal for the SERRS-MSOT-nanostars may be limited to several millimeters of tissue depth. The SERRS-MSOT-nanostars used in this study produce a relatively broad absorption peak and, thus, may limit the specificity of the unmixed MSOT signal versus other photoabsorbers, such as the dark blood clot that resulted here in a false-positive signal. However, this can potentially be mitigated by synthesizing new gold nanostars with narrower absorption peaks[26] and devising more accurate signal unmixing algorithms in the future.
To our knowledge this represents the first report of dual SERRS-MSOT in vivo imaging. In our previous work we have explored a combined MRI-SERS-optoacoustic probe (not SERRS, not MSOT), where we used a spherical gold core design and a single wavelength as excitation and encountered marked nonspecific optoacoustic background signal that would preclude such accurate visualization as reported herein.[20] Also, the approximately 400-fold sensitivity advantage for SERRS was achieved by using a star-shaped core instead of a spherical gold core, thus red-shifting the LSPR of the gold core into the NIR range and using a Raman reporter in resonance with the illumination wavelength in the NIR.[21] The star-shape of the gold core also has an important advantage for MSOT, as it was previously shown to be superior to a rod-shaped core when it comes to optoacoustic signal generation[27] and, in the current study, we show that the design was not limited by photostability issues during continuous high energetic pulsed laser illumination in vivo.
The results of our current study demonstrate the ability of the combined technologies to delineate GBMs over a range of scales in a preclinical GBM model. Interestingly, instrumentation for both modalities has been translated to the clinic; MSOT is in a variety of clinical studies (e.g. melanoma, inflammatory bowel disease, breast cancer, thyroid cancer and peripheral vascular disease)[23, 28, 29] and recently intrinsic (non-contrast enhanced) Raman spectroscopy was used to detect invasive brain cancer intraoperatively in humans.[30] In contrast to the instrumentation, the SERRS-MSOT-nanostars are not clinically approved yet. While there might be concerns about neurotoxicity related to SERRS-MSOT-nanostars, we demonstrate that the nanoparticles only accumulate in the tumor or tumor-periphery and not in healthy, contralateral brain tissues. Furthermore, since the envisioned application of the SERRS-MSOT-nanostars is to provide guidance to the surgeon during brain tumor resection, the surgical goal would be to remove all nanostars to achieve gross total tumor resection. Realistically, this will not be the case in all of the cases (i.e. tumor infiltrating eloquent brain tissue that needs to be left in situ for preserving functional integrity). Moreover, nanoparticle-based contrast agents of similar size or composition (i.e. silica, gold-silica hybrids) have been translated to the clinic and so far no adverse events related to the intravenous administration of these agents have been reported.[31, 32] We therefore anticipate that a viable path towards clinical translation of the current approach is feasible.
3. Conclusion
In summary, we demonstrated the proof-of-concept of a dual-modality SERRS-MSOT imaging approach in the NIR window with the use of gold-silica nanostars as the contrast agent, enabling the non-invasive depiction of GBM with high signal sensitivity and specificity at depth of up to several millimeters in the brain. The depth penetration potential and real-time imaging performance make MSOT an ideal complimentary diagnostic modality to the extremely sensitive and specific, yet more time-consuming and depth-limited SERRS-based Raman imaging. With regards to the potential of the proposed dual-modal concept for clinical translation, (1) the illumination energy used for Raman and MSOT were well within the limits for the maximal permissible laser light exposure for humans.[33] Furthermore, hand-held devices have already been developed for each modality,[22, 23, 34, 35] while devices incorporating both modalities and sharing the same laser illumination source are subject to ongoing developments. (2) While no adverse effects were observed over the course of 14 hours post injection in any of the mice, this study was not designed to assess survival or adverse events related to the SERRS-MSOT-nanostars used in this study. However, biocompatible inert gold-silica nanoparticles similar in composition and size to the SERRS-MSOT-nanostars have been extensively studied,[36, 37] paving a viable path to the clinical evaluation of the presented strategy to improve image-guided GBM resection.
4. Experimental Section
Materials
All chemicals were obtained from Sigma Aldrich (St. Louis, MO, USA) unless otherwise noted.
SERRS-MSOT-nanostar synthesis
The SERRS-nanostars were synthesized as previously described.[21, 38] In brief, to 1 l ice-cold solution of l-ascorbic acid (40 mM), 10 ml 25 mM gold chloride was rapidly added to form 60-nm gold nanostars, which were collected via centrifugation (5,000 g, 10 min, 4 °C). After removing the supernatant, the gold nanostar pellets were redispersed in ultrapure water (18 MΩ cm) and immediately transferred to a dialysis-cassette (Slide-A-Lyzer G2, molecular weight cut-off (MWCO) 3.5 kDa; Thermo Fisher Scientific).
The dialyzed nanostars (4 ml; 1 nM) were added to a solution of isopropanol (39 ml) containing tetraethyl orthosilicate (1.2 ml; 99.999%), ammonium hydroxide (0.6 ml; 28% (v/v)), the resonant Raman reporter IR780 perchlorate in dimethylformamide (75 μl; 25 mM). After 15 min, the SERRS-MSOT-nanostars were collected using centrifugation and washed with an excess of ethanol. To 1 ml 4 nM SERRS-MSOT-nanostars in ethanol, (3-mercaptopropyl)trimethoxysilane (MPTMS; 100 μl) and ammonium hydroxide (20 μl; 28%) were added. After 2 h, the thiolated SERRS-MSOT-nanostars were collected using centrifugation and washed with an excess of ethanol and water, respectively. The thiolated SERRS-MSOT-nanostars were redispersed in a 1% (w/v) maleimide-terminated methoxypolyethyleneglycol (mPEG; 3.4 kDa). After 2 h, the PEGylated SERRS-MSOT-nanostars were washed with excess water and redispersed in 10 mM MES (pH 7.3) to yield a final concentration of 5 nM.
Raman imaging setup
All Raman scans were performed on an InVia Raman microscopy system (Renishaw, New Mills, UK) equipped with a 785-nm diode laser and a 1 inch CCD detector providing a spectral resolution of 1.07 cm−1 as previously described in detail.[19, 21, 39] In brief, the samples were moved on a piezo-controlled stage for micron-resolved spatial mapping. The SERRS spectra were acquired through a 5× magnification objective (Leica, Wetzlar, Germany). Full laser power referred to an energy output of 100 mW measured by a laser power meter (Edmund Optics Inc., Barrington, NJ, USA) placed at the objective. Raman scans were performed at full laser power unless indicated otherwise using an acquisition time of 1.5 s in StreamLine™ high-speed acquisition mode.
MSOT imaging setup
All optoacoustic measurements were performed in a real-time whole-body mouse imaging MSOT scanner (inVision 256-TF, iThera Medical GmbH, Munich, Germany) as previously described.[40] In brief, optical excitation was provided by a Q-switched Nd:YAG laser with a pulse duration of ~10 ns and a repetition rate of 10 Hz and a tunable range of 680–900 nm. Light was homogeneously delivered to the sample using a fiber bundle split into 10 output arms. The emitted ultrasound signal was detected using a 256-element transducer array cylindrically focused and having a central frequency of 5 MHz, allowing acquisition of transverse-plane images. The fiber bundle and transducer array were stationary, and the sample could be moved to acquire different imaging planes using a moving stage. Measurements took place in a temperature controlled water bath at 34 °C for acoustic coupling, and the samples were kept dry using a thin clear polyethylene membrane attached to the sample holder.
Phantom experiments
Cylindrical phantoms of 2 cm diameter were prepared using a gel made from distilled water containing Agar for jellification (1.5% w/w) and an intralipid 20% emulsion for light diffusion (6% v/v), resulting in a gel presenting a reduced scattering coefficient of μ’s = 10 cm−1. A cylindrical inclusion containing the sample of approximately 3 mm diameter was put approximately in the middle of the phantom, along with a tube containing India ink with an optical density (OD) of around 0.45 at 800 nm for intensity measurement references. The MSOT signal to concentration ratio was assessed in a dilution series of an aqueous nanostar solution series (range 0.25 pM to 5 nM in PBS) with PBS serving as negative control (0.19 nM nanostars referred to an OD of ~1). Photostability assays were performed using constant pulses at 760-nm wavelength for 5 minutes (~80 mJ/pulse). Optoacoustic signals were recorded between 700 and 900 nm in 5 nm steps, using 3 averages per wavelength and transversally at the middle of the phantom. Optoacoustic spectra were extracted by plotting the average intensity of the optoacoustic signal obtained within the sample tube across all wavelengths after model-based reconstruction.[41] All phantom experiments were performed in triplicate. Corresponding characterization of the SERRS properties of the nanostars used in this study has been previously reported.[21]
Animal studies
All animal experiments were approved by the Institutional Animal Care and Use Committees of Memorial Sloan Kettering Cancer Center. In vivo animal procedures were performed under general 2% isoflurane inhalation anesthesia. GBMs were induced using the somatic gene transfer system (RCAS/tv-a) as previously described.[19, 42] In brief, 4–6 week old Nestin-tv-a;Ink4a/Arf−/−;Ptenfl/fl mice were stereotactically implanted with 1 μl of a mixture (1:1) of 1×10⁵ DF-1 cells transfected with RCAS-PDGFB and RCAS-Cre, respectively, in PBS positioned 0.5 mm anterior, 0.5 mm right lateral and 2.5 mm depth in reference to the bregma. Within 3–5 weeks thereafter the implanted mice developed GBMs in the right frontal lobe at 100% penetrance driven by the oncogene platelet-derived growth factor (PDGF) and loss of tumor suppressor genes Ink4a/Arf and Pten, thereby closely mimicking human GBMs.[43]
Tumor growth was monitored by subsequent MRI scans scheduled individually depending on the tumor development beginning in the third week post implantation using a 4.7-Tesla Bruker USR animal scanner (Bruker Biospin Corp., Ettlingen, Germany) equipped with a 300 mT/m gradient coil and a custom-built birdcage resonator (transverse 2D T2-weighted fast spin-echo rapid acquisition with relaxation enhancement (RARE) sequence: field of view = 30 × 34 mm, TE/TR = 50/2369 ms, slice thickness = 700 μm, flip angle = 180°, matrix = 160 × 256, averages = 18, acquisition time = 21.7 minutes).
When the tumor mass reached a size of 3–5 mm in diameter on MRI, the fur on the heads of mice was removed using depilatory cream and water, and following base-line imaging, the mice were intravenously injected with 150 μl of SERRS-MSOT-nanostars (3.5 nM in PBS) or 150 μl PBS as controls, respectively, via tail vein. Prior to the injection and at various time points thereafter (pharmacokinetic studies: at 1 minute, 3, 7 and 14 hours; end point studies: at 14 hours) the mice were imaged by MSOT transversally using 5 averages per position and wavelengths (700; 730; 760; 770; 780; 790; 800; 830; 860; 900 nm) in the region of the brain in 0.3 mm steps.
At corresponding time points the mice were sacrificed by CO2 asphyxiation, the brains were subsequently harvested, fixed in 4% paraformaldehyde and kept at 4° C overnight. Microscopic samples were taken from the tumor as well as from contralateral healthy brain tissue for transmission electron microscopy (TEM) analysis to confirm the presence of SERRS-MSOT-nanostars. Raman imaging was performed on the fixed transverse brain sections to enable the correlation to the corresponding histological slices, which served as reference standards. Corresponding transverse MSOT images depicting the same sections of the brain were identified based on anatomical landmarks by two observers for further analysis.
Histological examination
The imaged brain sections were harvested and processed for paraffin embedding, sectioning and hematoxylin and eosin (H&E)- and immunohistochemistry (IHC) staining. IHC staining was performed using the glioma marker oligo-2 (primary antibody AB9610, Millipore, Temecula, CA), the endothelial marker CD-31 (primary antibody Dianova, Hamburg, Germany), and the polyethylene glycol (PEG) linker (primary antibody AB51257, Abcam, Cambridge, MA) as a secondary stain for the SERRS-MSOT-nanostars.
MSOT Postprocessing and image analysis
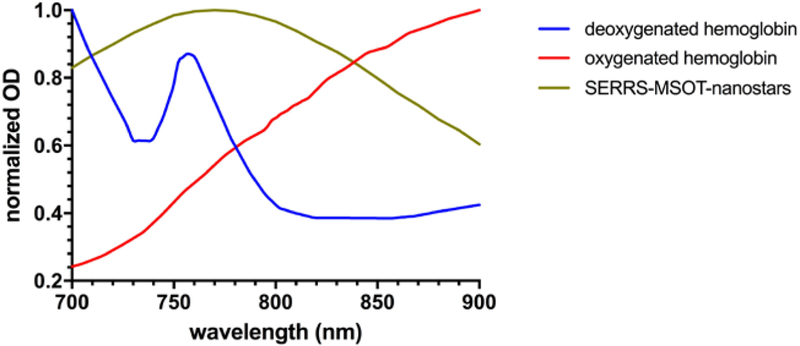
MSOT images were reconstructed from the acquisitions in the viewMSOT software (iThera Medical GmbH) using a model based approach.[41] Multispectral unmixing was performed using the least square method using hemoglobin, oxyhemoglobin and nanostar absorbance spectra (Figure 7) when applicable.[44] Regions of interest (ROI) were defined in the healthy brain tissue, the superficial temporal artery and the tumor area as indicative on MRI and MSOT by two observers independently. Raman maps were generated and analyzed with WiRE 3.4 software (Renishaw) using a direct classical least squares (DCLS) algorithm and correlated to the corresponding MSOT and histological images for congruency analysis in depicting the tumor extent. Differences in the group mean signal (i.e. between pre- and post-injection) were calculated with the two-tailed paired t test unless indicated otherwise. P < 0.05 was considered statistically significant (Prism software V6.0; GraphPad, La Jolla, CA, USA).
Figure 7. Optical spectra of photoabsorbers.
Absorption spectra of oxygenated and deoxygenated hemoglobin as the most significant intrinsic biological absorbers in the brain in the NIR window, in contrast to the spectrum of the SERRS-MSOT-nanostars which were used for spectral unmixing.
ACKNOWLEDGMENTS
We thank the MSKCC Animal Imaging Core Facility as well as the MSKCC Molecular Cytology Core Facility for their technical support. M.F.K. is a Damon Runyon-Rachleff Innovator supported (in part) by the Damon Runyon Cancer Research Foundation (DRR-29–14). We acknowledge the following additional funding sources: NIH R01 EB017748 and K08 CA16396, Pershing Square Sohn Prize, MSKCC Center for Molecular Imaging and Nanotechnology Grant, MSKCC Technology Development Grant, Mr. William H. and Mrs. Alice Goodwin and the Commonwealth Foundation for Cancer Research and The Experimental Therapeutics Center of Memorial Sloan Kettering Cancer Center (all to M.F.K.). Deutsche Forschungsgemeinschaft (DFG) Research Fellowship Grant NE 1922/2–1 (V. Neuschmelting), DFG Research Grant RA1848/5–1 (D.R.), European Research Council Consolidator grant ERC-2015-CoG-682379 (D.R.) and DFG Gottfried Wilhelm Leibniz Prize 2013 NT 3/10–1 (V.Ntziachristos). Acknowledgments are also extended to the grant-funding support provided by the MSKCC NIH Core Grant (P30-CA008748).
Footnotes
V.Neuschmelting, S.H., C.H., N.B., H.L., R.H. and M.F.K. have declared no competing interests. V.Ntziachristos and D.R. have financial interest as a consultant to iThera Medical, Munich, Germany.
REFERENCES
- 1.Li YM; Suki D; Hess K; Sawaya R, J Neurosurg 2016, 124 (4), 977–88. DOI 10.3171/2015.5.JNS142087. [DOI] [PubMed] [Google Scholar]
- 2.Stummer W; Pichlmeier U; Meinel T; Wiestler OD; Zanella F; Reulen HJ; Group, A. L.-G. S., Lancet Oncol 2006, 7 (5), 392–401. DOI 10.1016/S1470-2045(06)70665-9. [DOI] [PubMed] [Google Scholar]
- 3.Suchorska B; Weller M; Tabatabai G; Senft C; Hau P; Sabel MC; Herrlinger U; Ketter R; Schlegel U; Marosi C; Reifenberger G; Wick W; Tonn JC; Wirsching HG, Neuro-Oncology 2016, 18 (4), 549–556. DOI 10.1093/neuonc/nov326. [DOI] [PMC free article] [PubMed] [Google Scholar]
- 4.Hervey-Jumper SL; Berger MS, J Neuro-Oncol 2016, 130 (2), 269–282. DOI 10.1007/s11060-016-2110-4. [DOI] [PubMed] [Google Scholar]
- 5.Reinges MHT; Nguyen HH; Krings T; Hutter BO; Rohde V; Gilsbach JM, Acta Neurochir 2004, 146 (4), 369–377. DOI 10.1007/s00701-003-0204-1. [DOI] [PubMed] [Google Scholar]
- 6.Knauth M; Aras N; Wirtz CR; Dorfler A; Engelhorn T; Sartor K, Am J Neuroradiol 1999, 20 (8), 1547–1553. [PMC free article] [PubMed] [Google Scholar]
- 7.Knauth M; Wirtz CR; Aras N; Sartor K, Neuroradiology 2001, 43 (3), 254–258. DOI 10.1007/Pl00006047. [DOI] [PubMed] [Google Scholar]
- 8.Ludemann L; Hamm B; Zimmer C, Magn Reson Imaging 2000, 18 (10), 1201–1214. DOI 10.1016/S0730-725x(00)00223-X. [DOI] [PubMed] [Google Scholar]
- 9.Eljamel MS; Mahboob SO, Photodiagn Photodyn 2016, 16, 35–43. DOI 10.1016/j.pdpdt.2016.07.012. [DOI] [PubMed] [Google Scholar]
- 10.Beljebbar A; Dukic S; Amharref N; Manfait M, Anal Bioanal Chem 2010, 398 (1), 477–487. DOI 10.1007/s00216-010-3910-6. [DOI] [PubMed] [Google Scholar]
- 11.Kut C; Chaichana KL; Xi JF; Raza SM; Ye XB; McVeigh ER; Rodriguez FJ; Quinones-Hinojosa A; Li XD, Sci Transl Med 2015, 7 (292). DOI 10.1126/scitranslmed.3010611. [DOI] [PMC free article] [PubMed] [Google Scholar]
- 12.Steiner G; Kirsch M, Anal Bioanal Chem 2014, 406 (1), 21–25. DOI 10.1007/s00216-013-7401-4. [DOI] [PubMed] [Google Scholar]
- 13.Toms SA; Lin WC; Weil RJ; Johnson MD; Jansen ED; Mahadevan-Jansen A, Neurosurgery 2005, 57 (4), 382–390. DOI 10.1227/01.Neu.000176855.39826.2d. [DOI] [PubMed] [Google Scholar]
- 14.Kantelhardt SR; Diddens H; Leppert J; Rohde V; Huttmann G; Giese A, Laser Surg Med 2008, 40 (4), 273–281. DOI 10.1002/lsm.20623. [DOI] [PubMed] [Google Scholar]
- 15.Shinoda J; Yano H; Yoshimura SI; Okumura A; Kaku Y; Iwama T; Sakai N, Journal of Neurosurgery 2003, 99 (3), 597–603. DOI 10.3171/jns.2003.99.3.0597. [DOI] [PubMed] [Google Scholar]
- 16.de la Zerda A; Bodapati S; Teed R; Schipper ML; Keren S; Smith BR; Ng JST; Gambhir SS, Mol Imaging Biol 2010, 12 (5), 500–508. DOI 10.1007/s11307-009-0290-4. [DOI] [PMC free article] [PubMed] [Google Scholar]
- 17.Li YP; Rey-Dios R; Roberts DW; Valdes PA; Cohen-Gadol AA, World Neurosurg 2014, 82 (1–2), 175–185. DOI 10.1016/j.wneu.2013.06.014. [DOI] [PubMed] [Google Scholar]
- 18.Moiyadi AV; Shetty P; Sridhar E, Brit J Neurosurg 2017, 31 (1), 107–112. DOI 10.1080/02688697.2016.1229750. [DOI] [PubMed] [Google Scholar]
- 19.Huang RM; Harmsen S; Samii JM; Karabeber H; Pitter KL; Holland EC; Kircher MF, Theranostics 2016, 6 (8), 1075–1084. DOI 10.7150/thno.13842. [DOI] [PMC free article] [PubMed] [Google Scholar]
- 20.Kircher MF; de la Zerda A; Jokerst JV; Zavaleta CL; Kempen PJ; Mittra E; Pitter K; Huang RM; Campos C; Habte F; Sinclair R; Brennan CW; Mellinghoff IK; Holland EC; Gambhir SS, Nat Med 2012, 18 (5), 829–U235. DOI 10.1038/nm.2721. [DOI] [PMC free article] [PubMed] [Google Scholar]
- 21.Harmsen S; Huang RM; Wall MA; Karabeber H; Samii JM; Spaliviero M; White JR; Monette S; O’Connor R; Pitter KL; Sastra SA; Saborowski M; Holland EC; Singer S; Olive KP; Lowe SW; Blasberg RG; Kircher MF, Sci Transl Med 2015, 7 (271). DOI 10.1126/scitranslmed.3010633. [DOI] [PMC free article] [PubMed] [Google Scholar]
- 22.Neuschmelting V; Burton NC; Lockau H; Urich A; Harmsen S; Ntziachristos V; Kircher MF, Photoacoustics 2016, 4 (1), 1–10. DOI 10.1016/j.pacs.2015.12.001. [DOI] [PMC free article] [PubMed] [Google Scholar]
- 23.Stoffels I; Morscher S; Helfrich I; Hillen U; Lehy J; Burton NC; Sardella TCP; Claussen J; Poeppel TD; Bachmann HS; Roesch A; Griewank K; Schadendorf D; Gunzer M; Klode J, Sci Transl Med 2015, 7 (317). DOI 10.1126/scitranslmed.aad1278. [DOI] [PubMed] [Google Scholar]
- 24.Li R; Zheng K; Yuan C; Chen Z; Huang M, Nanotheranostics 2017, 1, 346–357. [DOI] [PMC free article] [PubMed] [Google Scholar]
- 25.Burton NC; Patel M; Morscher S; Driessen WHP; Claussen J; Beziere N; Jetzfellner T; Taruttis A; Razansky D; Bednar B; Ntziachristos V, Neuroimage 2013, 65, 522–528. DOI 10.1016/j.neuroimage.2012.09.053. [DOI] [PubMed] [Google Scholar]
- 26.Wall MA; Harmsen S; Pal S; Zhang LH; Arianna G; Lombardi JR; Drain CM; Kircher MF, Adv Mater 2017, 29 (21). DOI 10.1002/adma.201605622. [DOI] [PMC free article] [PubMed] [Google Scholar]
- 27.Wang J; Xie YD; Wang LM; Tang JL; Li JY; Kocaefe D; Kocaefe Y; Zhang ZW; Li YP; Chen CY, Rsc Adv 2015, 5 (10), 7529–7538. DOI 10.1039/c4ra13228a. [DOI] [Google Scholar]
- 28.Diot G; Metz S; Noske A; Liapis E; Schroeder B; Ovsepian SV; Meier R; Rummeny E; Ntziachristos V, Clin Cancer Res 2017, 23 (22), 6912–6922. DOI 10.1158/1078-0432.Ccr-16-3200. [DOI] [PubMed] [Google Scholar]
- 29.Knieling F; Neurath MF; Waldner MJ, New Engl J Med 2017, 376 (13), 1292–1294. DOI 10.1056/NEJMc1612455. [DOI] [PubMed] [Google Scholar]
- 30.Jermyn M; Mok K; Mercier J; Desroches J; Pichette J; Saint-Arnaud K; Bernstein L; Guiot MC; Petrecca K; Leblond F, Sci Transl Med 2015, 7 (274). DOI 10.1126/scitranslmed.aaa2384. [DOI] [PubMed] [Google Scholar]
- 31.Phillips E; Penate-Medina O; Zanzonico PB; Carvajal RD; Mohan P; Ye YP; Humm J; Gonen M; Kalaigian H; Schoder H; Strauss HW; Larson SM; Wiesner U; Bradbury MS, Sci Transl Med 2014, 6 (260). DOI ARTN260ra14910.1126/scitranslmed.3009524. [DOI] [PMC free article] [PubMed] [Google Scholar]
- 32.Anselmo AC; Mitragotri S, Aaps J 2015, 17 (5), 1041–1054. DOI 10.1208/s12248-015-9780-2. [DOI] [PMC free article] [PubMed] [Google Scholar]
- 33.ANSI, ANSI Z136.1–2007 2007, 53–77.
- 34.Garai E; Sensarn S; Zavaleta CL; Van de Sompel D; Loewke NO; Mandella MJ; Gambhir SS; Contag CH, J Biomed Opt 2013, 18 (9). DOI Artn09600810.1117/1.Jbo.18.9.096008. [DOI] [PMC free article] [PubMed] [Google Scholar]
- 35.Zavaleta CL; Garai E; Liu JTC; Sensarn S; Mandella MJ; Van de Sompel D; Friedland S; Van Dam J; Contag CH; Gambhir SS, P Natl Acad Sci USA 2013, 110 (25), E2288–E2297. DOI 10.1073/pnas.1211309110. [DOI] [PMC free article] [PubMed] [Google Scholar]
- 36.Thakor AS; Gambhir SS, Ca-Cancer J Clin 2013, 63 (6), 395–418. DOI 10.3322/caac.21199. [DOI] [PubMed] [Google Scholar]
- 37.Thakor AS; Luong R; Paulmurugan R; Lin FI; Kempen P; Zavaleta C; Chu P; Massoud TF; Sinclair R; Gambhir SS, Sci Transl Med 2011, 3 (79). DOI 10.1126/scitranslmed.3001963. [DOI] [PMC free article] [PubMed] [Google Scholar]
- 38.Harmsen S; Wall MA; Huang RM; Kircher MF, Nat Protoc 2017, 12 (7), 1400–1414. DOI 10.1038/nprot.2017.031. [DOI] [PMC free article] [PubMed] [Google Scholar]
- 39.Harmsen S; Bedics MA; Wall MA; Huang RM; Detty MR; Kircher MF, Nat Commun 2015, 6 DOI 10.1038/ncomms7570. [DOI] [PMC free article] [PubMed] [Google Scholar]
- 40.Neuschmelting V; Lockau H; Ntziachristos V; Grimm J; Kircher MF, Radiology 2016, 280 (1), 137–150. DOI 10.1148/radiol.2016160191. [DOI] [PMC free article] [PubMed] [Google Scholar]
- 41.Rosenthal A; Razansky D; Ntziachristos V, Ieee T Med Imaging 2010, 29 (6), 1275–1285. DOI 10.1109/Tmi.2010.2044584. [DOI] [PubMed] [Google Scholar]
- 42.Uhrbom L; Holland EC, J Neuro-Oncol 2001, 53 (3), 297–305. DOI 10.1023/A:1012208314436. [DOI] [PubMed] [Google Scholar]
- 43.Brennan CW; Verhaak RGW; McKenna A; Campos B; Noushmehr H; Salama SR; Zheng SY; Chakravarty D; Sanborn JZ; Berman SH; Beroukhim R; Bernard B; Wu CJ; Genovese G; Shmulevich I; Barnholtz-Sloan J; Zou LH; Vegesna R; Shukla SA; Ciriello G; Yung WK; Zhang W; Sougnez C; Mikkelsen T; Aldape K; Bigner DD; Van Meir EG; Prados M; Sloan A; Black KL; Eschbacher J; Finocchiaro G; Friedman W; Andrews DW; Guha A; Iacocca M; O’Neill BP; Foltz G; Myers J; Weisenberger DJ; Penny R; Kucherlapati R; Perou CM; Hayes DN; Gibbs R; Marra M; Mills GB; Lander E; Spellman P; Wilson R; Sander C; Weinstein J; Meyerson M; Gabriel S; Laird PW; Haussler D; Getz G; Chin L; Network TR, Cell 2014, 157 (3), 753–753. DOI 10.1016/j.cell.2014.04.004. [DOI] [Google Scholar]
- 44.Razansky D; Distel M; Vinegoni C; Ma R; Perrimon N; Koster RW; Ntziachristos V, Nat Photonics 2009, 3 (7), 412–417. DOI 10.1038/Nphoton.2009.98. [DOI] [Google Scholar]


