Figure 9.
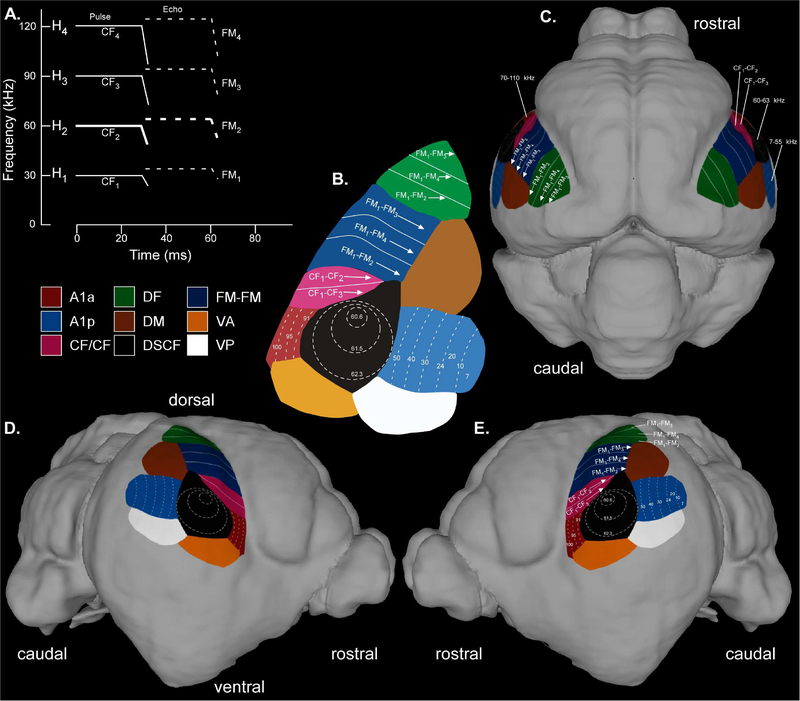
3D rendering of the functional organization of the mustached bat auditory cortex. (A) Schematized spectrogram of the mustached bat’s echolocation signal. H1-H4 refer to harmonics 1–4 of the echolocation pulse or echo. Note the constant frequency (CF) and frequency-modulated (FM) components present in the pulse (solid line) and returning echo (dashed line). (B) Map of the mustached bat auditory cortex. The boundaries of auditory cortical subdivisions are derived from Fitzpatrick et al (1998), and white labels describing the function of auditory cortical subdivisions are derived from Suga (1985). (C) Dorsal view of the mustached bat brain with a superimposed auditory cortex map. The map includes anterior A1 (A1a, maroon), posterior A1 (A1p, light blue), CF/CF (pink), dorsal fringe (DF, green), dorsal medial (DM, brown), Doppler-shifted CF (DSCF, black), FM-FM (dark blue), ventral anterior (VA, orange), and ventral posterior (VP, white). (D) Right profile view of the mustached bat brain with a superimposed auditory cortex map. This depiction contains the same functional areas described above in “C.” (E) Left profile view of the mustached bat brain similar to the depiction in “D.” Note that the DSCF labels in this depiction (60–63 kHz) represent the more commonly reported echo-CF2 range of the P.p.parnellii subspecies (Suga and Jen, 1976), not the 57–60 kHz range of the Trinidadian P.p.rubiginosus subspecies to which this specimen belongs (Xiao and Suga, 2002b). The Meshlab file used to generate this image contains the color-coded boundaries and contours but none of the numerical values, arrows, or text shown here. A second Meshlab file is available without contours. Researchers can thus label these ranges to coincide with those of P.p.parnellii, P.p.rubiginosus, or their choice of mustached bat subspecies. Details regarding the landmarks used to overlay the auditory cortex map onto the surface rendering of the mustached bat brain are shown in Figure SSF2.

