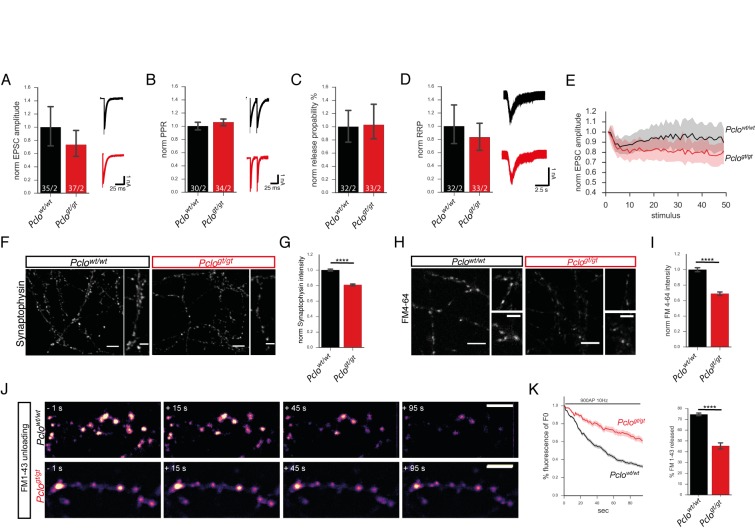
Figure 3. Synaptic vesicle release properties are not altered, but the total recycling pool of vesicles is reduced due to the loss of Piccolo.
(A–E) Patch clamp recordings on autaptic primary hippocampal neurons. (A) Amplitudes of evoked postsynaptic currents (EPSCs) are slightly but not significantly reduced in Pclogt/gt neurons (Pclowt/wt = 1.0 ± 0.15, Pclogt/gt = 0.73 ± 0.10; two independent experiments). (B) Paired pulse ratio is not altered in Pclogt/gt neurons (Pclowt/wt = 1.00 ± 0.03, Pclogt/gt = 1.06 ± 0.03; two independent experiments). (C) Vesicle release probability is not changed upon Piccolo loss (Pclowt/wt = 1 ± 0.13, Pclogt/gt = 1.03 ± 0.13; two independent experiments). (D) The readily releasable pool of vesicles (RRP) in Pclogt/gt neurons is not altered (Pclowt/wt = 1 ± 0.15, Pclogt/gt = 0.83 ± 0.11; two independent experiments). (E) Loss of Piccolo causes an increase in EPSC amplitude depression during 10 Hz train stimulation (Pclowt/wt : 34 cells, Pclogt/gt : 35 cells; two independent experiments). (F) Images of hippocampal neurons immuno-stained with Synaptophysin antibodies. (G) Quantitation of (F). Synaptophysin intensities/bouton are significantly decreased in Pclogt/gt neurons (Pclowt/wt = 1 ± 0.01, n = 3457 puncta; Pclogt/gt = 0.81 ± 0.01, n = 2916 puncta; 13 independent experiments). (H) Images from FM4-64 dye uptake experiments. (I) Quantification of (H). FM4-64 dye uptake is significantly reduced in Pclogt/gt neurons (Pclowt/wt = 1 ± 0.01, n = 1026 puncta; Pclogt/gt = 0.69 ± 0.01, n = 867 puncta; four independent experiments). (J) Selected images of synaptic boutons releasing loaded FM1-43 dye during a 900 AP 10 Hz stimulation. (K) Quantification of changes in FM1-43 dye intensities per bouton over time. Note, FM1-43 unloading rate is slower in Pclogt/gt versus Pclowt/wt neurons. In Pclowt/wt neurons, about 70% of the initially loaded FM1-43 dye is released within 90 s of stimulation (Pclowt/wt = 74.62 ± 0.6607, n = 244 synapses, three independent experiments), whereas in Pclogt/gt neurons only about 45% is released (Pclogt/gt = 45.47 ± 1.468, n = 155 synapses, three independent experiments). Scale bar in F, H and J 10 μm, scale bar in zoom in F and H 5 μm. Numbers in bar graphs (A–D) represent number of cells/number of cultures. Error bars in bar graph represent 95% confidence intervals. Numbers given represent mean ± SEM, Student`s t –test. **** denotes p<0.0001.

