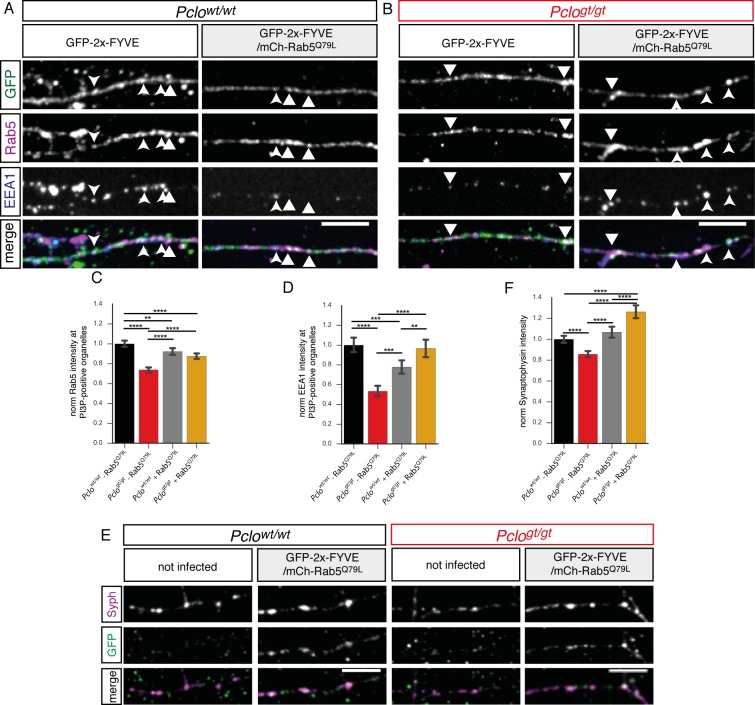
Figure 7. Expression of GTPase deficient Rab5 (Rab5Q79L) in Pclogt/gt neurons rescues EEA1 levels at PI3P containing membranes and Synaptophysin back to Pclowt/wt levels.
(A–B) Rab5 and EEA1 levels at GFP-2x-FYVE organelles along axons in Pclowt/wt (A) and Pclogt/gt (B) neurons and those expressing mCh-Rab5Q79L. (B) In Pclogt/gt neurons, mCh-Rab5Q79L expression increases Rab5 and EEA1 level at GFP-2x-FYVE organelles towards Pclowt/wt levels. (C–D) Quantification of (A and B). (C) mCh-Rab5Q79L expression in Pclowt/wt neurons slightly reduces Rab5 levels at GFP-2x-FYVE membranes (Pclowt/wt = 1 ± 0.02, n = 1066 puncta; Pclowt/wt (mCh-Rab5Q79L)=0.93 ± 0.02, n = 979 puncta; three independent experiments). mCh-Rab5Q79L expression in Pclogt/gt neurons increases Rab5 levels at PI3P-positive organelles (Pclogt/gt = 0.74 ± 0.01, n = 840 puncta; Pclogt/gt (mCh-Rab5Q79L)=0.87 ± 0.01, n = 1185 puncta; three independent experiments). (D) In Pclowt/wt neurons mCh-Rab5Q79L expression causes EEA1 levels to drop (Pclowt/wt = 1 ± 0.04, n = 1066 puncta; Pclowt/wt (mCh-Rab5Q79L)=0.77 ± 0.04, n = 979 puncta; three independent experiments). mCh-Rab5Q79L expression rescues EEA1 levels in Pclogt/gt neurons (Pclogt/gt = 0.53 ± 0.03, n = 840 puncta; Pclogt/gt (mCh-Rab5Q79L)=0.97 ± 0.05, n = 1185 puncta; three independent experiments). (E) mCh-Rab5Q79L expression in Pclowt/wt neurons increases Synaptophysin intensities. (F) Quantification of (E). Synaptophysin puncta intensity slightly increases upon mCh-Rab5Q79L expression in Pclowt/wt neurons. In Pclogt/gt neurons, mCh-Rab5Q79L expression rescues Synaptophysin levels higher than Pclowt/wt levels (Pclowt/wt = 1 ± 0.02, n = 620 synapses; Pclogt/gt = 0.86 ± 0.02, n = 526 synapses; Pclowt/wt (mCh-Rab5Q79L)=1.07 ± 0.03, n = 473 synapses; Pclogt/gt (mCh-Rab5Q79L)=1.26 ± 0.03, n = 446 synapses; three independent experiment). Scale bars represent 10 μm. Error bars in bar graph represent 95% confidence intervals. Numbers given represent mean ± SEM. C, D and H ANOVA with Tukey multi comparison test. ** denotes p<0.01, *** denotes p<0.001 and **** denotes p<0.0001.

