. 2019 May 10;8:e46629. doi: 10.7554/eLife.46629

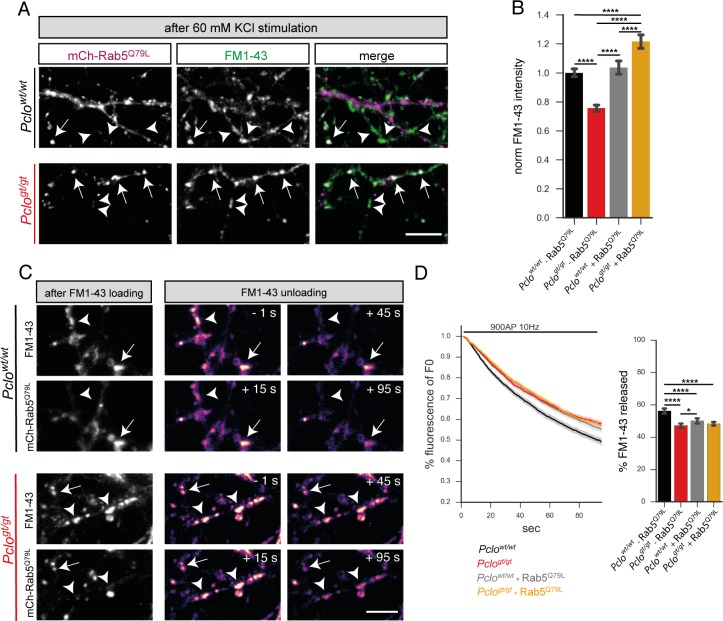
Figure 8. Expression of GTPase deficient Rab5 (Rab5Q79L) in Pclogt/gt neurons rescues the size of the total recycling pool of vesicles but not FM1-43 unloading kinetics.

(A) Representative images showing FM1-43 levels in Pclowt/wt and Pclogt/gt boutons either positive (arrow) or negative (arrowhead) for mCh-Rab5Q79L after 60 mM KCl stimulation. (B) Quantification of (A). (Pclowt/wt = 1 ± 0.01, n = 528 puncta; Pclogt/gt = 0.76 ± 0.01, n = 654 puncta; Pclowt/wt (mCh-Rab5Q79L)=1.04 ± 0.02, n = 304 puncta; Pclogt/gt (mCh-Rab5Q79L)=1.22 ± 0.02, n = 337 puncta; three independent experiments). (C) Left: Images depicting FM1-43 intensities in Pclowt/wt and Pclogt/gt boutons either positive (arrow) or negative (arrowhead) for mCh-Rab5Q79L. Right: Images depicting FM1-43 unloading kinetics in Pclowt/wt and Pclogt/gt boutons either positive (arrow) or negative (arrowhead) for mCh-Rab5Q79L. (D) Quantification of (C). The presence of mCh-Rab5Q79L is not sufficient to rescue slowed FM1-43 unloading kinetics and total amount of FM1-43 dye released in Pclogt/gt boutons (Pclogt/gt = 47.24 ± 0.68, n = 361 synapses; Pclogt/gt(Rab5Q79L)=48.33 ± 0.53, n = 479 synapses; four independent experiments). In Pclowt/wt boutons expressing mCh-Rab5Q79L, FM1-43 unloading kinetics are slowed and total amounts of dye released are reduced similar to what is observed in Pclogt/gt boutons (Pclowt/wt = 56.28 ± 0.81, n = 301 synapses; Pclowt/wt(Rab5Q79L)=50.15 ± 0.85, n = 342 synapses; four independent experiments). Scale bars represent 5 μm. Error bars in bar graph represent 95% confidence intervals. Numbers given represent mean ± SEM. ANOVA with Tukey multi comparison test. * denotes p<0.05, **** denotes p<0.0001.

Figure 8—source data 1. This spreadsheet contains the normalized values used to generate the bar plots shown in Figure 8B and D.
DOI: 10.7554/eLife.46629.024

Figure 8.

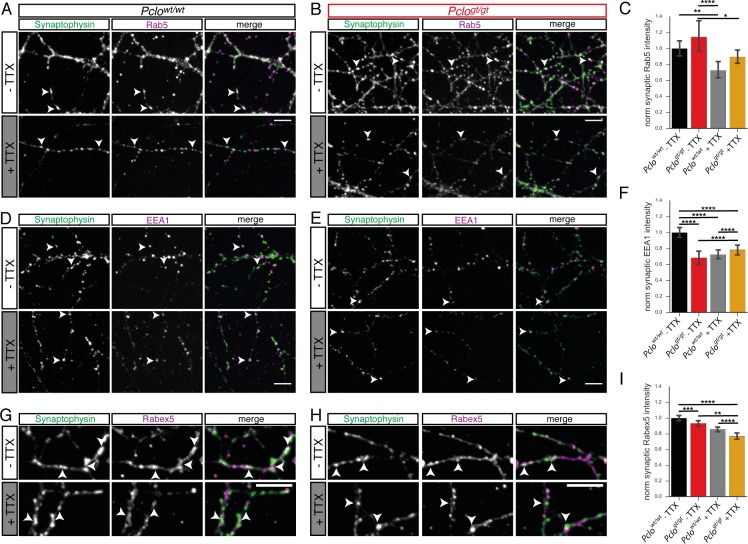
Figure 8—figure supplement 1. Silencing synaptic activity affects synaptic levels of endosome proteins in Pclowt/wt and Pclogt/gt neurons.

Figure 8—figure supplement 1.

(A and B) Images of Pclowt/wt (A) and Pclogt/gt (B) neurons stained for Synaptophysin and Rab5 with and without TTX treatment. (C) Quantification of (A and B). Synaptic Rab5 levels do not significantly alter in Pclowt/wt and Pclogt/gt synapses upon TTX treatment (Pclowt/wt = 1 ± 0.05, n = 391 synapses; Pclowt/wt (TTX) = 0.73 ± 0.05, n = 482 synapses; Pclogt/gt = 1.14 ± 0.09, n = 400 synapses; Pclogt/gt (TTX) = 0.90 ± 0.04, n = 372 synapses; two independent experiments). (D and E) Images of Pclowt/wt (D) and Pclogt/gt (E) neurons stained for Synaptophysin and EEA1 with and without TTX treatment. (F) Quantification of (D and E). In Pclowt/wt synapses EEA1 levels drop upon TTX treatment (Pclowt/wt = 1 ± 0.03, n = 1653 synapse; Pclowt/wt (TTX) = 0.72 ± 0.03, n = 1887 synapses; four independent experiments). In contrast, EEA1 levels slightly increase in Pclogt/gt synapses due to TTX treatment (Pclogt/gt = 0.68 ± 0.04, n = 918; Pclogt/gt (TTX) = 0.78 ± 0.03, n = 1352; four independent experiments). (G and H) Pclowt/wt (G) and Pclogt/gt (H) neurons stained for Synaptophysin and Rabex5 with and without TTX treatment. (I) Quantification of (G and H). Rabex5 level at synapses slightly decrease in Pclowt/wt and Pclogt/gt neurons upon TTX treatment (Pclowt/wt = 1 ± 0.02, n = 2124 puncta; Pclowt/wt (TTX) = 0.85 ± 0.02, n = 2058 puncta; Pclogt/gt = 0.93 ± 0.02, n = 1889, Pclogt/gt (TTX) = 0.77 ± 0.02, n = 2305; six independent experiments). Scale bars represent 10 μm. Error bars in bar graph represent 95% confidence intervals. Numbers given represent mean ± SEM, ANOVA with Tukey multi comparison test. * denotes p<0.05, ** denotes p<0.01, *** denotes p<0.001 and **** denotes p<0.0001.
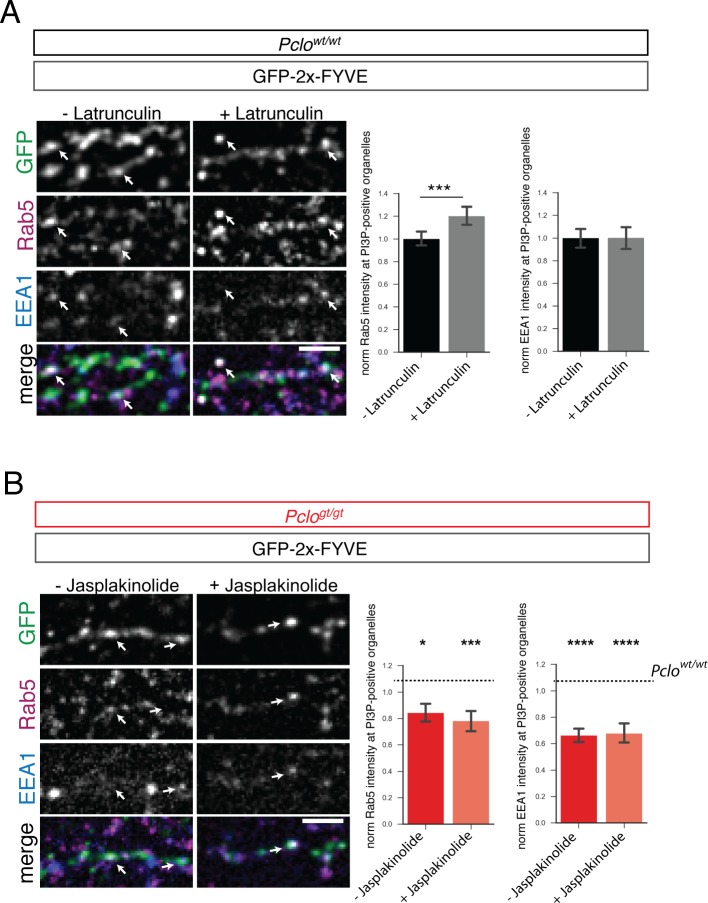
Figure 8—figure supplement 2. Deficiencies in F-actin assembly do not contribute to the endosome phenotype seen in boutons lacking Piccolo.

Figure 8—figure supplement 2.

(A) Pclowt/wt neurons expressing GFP-2x-FYVE were treated for 30 min with Latrunculin or DMSO as control, fixed and stained for Rab5 and EEA1. Latrunculin treatment leads to increased levels of Rab5 at PI3P-positive organelles (Pclowt/wt - Latrunculin = 1 ± 0.03, n = 518 puncta; Pclowt/wt + Latrunculin = 1.21±0.04, n = 579; three independent experiments). EEA1 levels at endosome membranes are not affected by Latrunculin treatment (Pclowt/wt - Latrunculin = 1 ± 0.04, n = 721 puncta; Pclowt/wt + Latrunculin = 0.91±0.03, n = 535; three independent experiments). (B) Pclogt/gt neurons expressing GFP-2x-FYVE were treated for 30 min with Jasplakinolide or DMSO as control, fixed and stained for Rab5 and EEA1. Jasplakinolide treatment does not alter Rab5 levels at PI3P-positive organelles. (Pclogt/gt - Jasplakinolide = 0.84 ± 0.04, n = 441 puncta; Pclogt/gt + Jasplakinolide = 0.78±0.04, n = 377 puncta; three independent experiments). EEA1 levels at PI3P-positive organelles are also not altered through the treatment with Jasplakinolide (Pclogt/gt - Jasplakinolide = 0.66 ± 0.03, n = 601 puncta; Pclogt/gt + Jasplakinolide = 0.67±0.04, n = 493 puncta; three independent experiments). Scale bar represents 10 μm. Error bars in bar graph represent 95% confidence intervals. Numbers given represent mean ± SEM, Student`s t-test. * denotes p<0.05, *** denotes p<0.001 and **** denotes p<0.0001.