Abstract
This study presents a new algorithm to adaptively detect change points of functional connectivity networks in the brain. The proposed approach uses measures from image and video processing on scans from restingstate functional magnetic resonance imaging (rsfMRI) which has emerged as one of the major tools to investigate intrinsic brain functionality. Different regions of the resting brain form networks changing states within a few seconds to minutes. These network dynamics in normal and disordered brain functions are different and their understanding can help in early identification of brain disorders. There are no ground truths for these change points since the influences arise from many unknown factors. As a result extracting them is one of the the major challenges in the study of these dynamics. We demonstrate the effectiveness of the proposed algorithm and show that these change points can be detected reliably in both task-based and resting-state networks. The outcomes also point to new directions for future work.
Keywords: Dynamic functional connectivity, Resting-state functional MRI, Adaptive change point detection
1. Introduction
Studies have reported presence of well-correlated activation in various regions of the resting brain (when a subject is not performing any explicit task and is just thinking) forming networks called ‘functional connectivity (FC)’ networks[1]. Discovery of the networks in resting brain is a landmark for the study of brain functions since the scans do not require the subject to perform any explicit task. As a result, it is possible to scan patients with neurological disorders. These FC networks change configurations or ‘states’ within few seconds, and the changes in a normal brain are different from a brain with some neurological disorder [2]. Hence, the key to understanding the intrinsic brain functionality may be in comprehension of these dynamics. However, understanding these dynamics is a big challenge since there are no ‘ground truths’ for timings of these changes. Even for a normal brain the change points depend on many factors. Despite this lack of the ground truth, studies have used existing methods of capturing the changes in FC networks [3, 4, 5] and a few have developed new methods for this purpose [6, 7, 8]. However, none of these methods focus on extracting just the change points of these FC networks, mostly resulting in extensive computations.
In this study we present a novel algorithm to detect just the change points of dynamic FC networks. After extraction of these change points, any existing method, such as sliding window correlation [3, 4], can be used to capture the relationship of two signals between any two change points. We developed the algorithm by focusing on the findings of some recent studies [7, 9, 10]. [7] reported the presence of Quasi-periodic patterns transitioning from one network to another within a few seconds which can be observed with naked eyes. Coactivation patterns [9] are spontaneous activities in the brain dominated by brief instances of activations and deactivations. Similar observation was made for spontaneous BOLD events in [10]. The changes from one network to another in all of these studies were detected by the simultaneous sign changes in the intensities of various regions from negative to positive and vice versa. These findings motivated us to use some image similarity measures to capture these dynamics.
The rest of the paper is arranged as follows. Section 2 provides the algorithm along with its pseudo code. Section 3 presents details of the data used for the study along with the preprocessing steps. Section 4 presents the results of the algorithm’s application on real taskbased and resting-state data. Finally we conclude our findings and present some future work in Section 5.
2. Algorithm
Our novel adaptive change point detection algorithm is based on two image similarity measures: statistical sign change (SSC) used in medical image registration [11] and sum of absolute differences (SAD) used in motion detection [12]. In SSC the intensity difference of two images is computed and the change in the signs of the difference is the measure of similarity between the two images. In SAD pixels within a square neighborhood of target image are subtracted from the ones in reference image and then the sum of the absolute difference is computed within the square window.
We hypothesized that in FC networks the change in state is a result of change in signs of image intensities at adjacent time points. So, if we compute the difference between the signs of adjacent normalized images and then compute the sum of their absolute values, we would get largest sums at the point of maximum sign change, reflecting the maximum change in the network state. Hence, extracting a number of largest sums of absolute differences would provide the locations of state changes.
We formed a NxM matrix, in which N is the number of voxels in a scanned image and M is the number of time points (scans or TRs). This matrix would represent M images with N voxels each and the image vector at any time point t can be represented as Xt =[x1t,x2t,x3t, ..,xNt]′, 1 ≤ t ≤ M. Then we normalized all the images to zero mean and unit variance by using the formula:
| (1) |
(μt and St are sample mean and sample standard deviation of the image at time t). Afterwards, we computed the difference of signs between any two adjacent images.
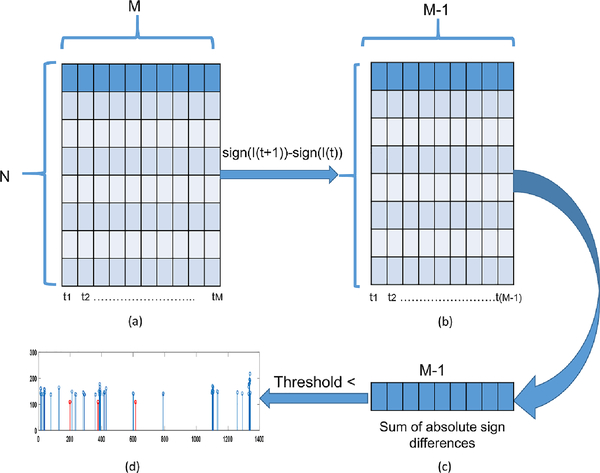
Similar to the SSC, the change in signs were the indication of the difference (or similarity) for our images. However, in our case difference of signs (instead of intensities) between two adjacent images was the image difference (or similarity). This process was repeated and we obtained a Nx(M−1) matrix, in which columns were the sign differences of the adjacent normalized images. Subsequently, we computed the sum of absolute differences of each column (based on the idea of SAD) at each time point. Finally, we extracted a number of largest sums representing the state change points of the FC networks. Once these change points were extracted, the network transitions could be observed by extraction of images around the change points. Our algorithm is very efficient and computationally inexpensive with computational complexity of O(n). Figure 1. shows the block diagram for the sequence of operations in our algorithm.
Figure 1.
Block diagram of the adaptive change point detection algorithm. (a) Normalized images in columns. (b) Sign difference of adjacent normalized images. (c) Sum of absolute sign differences. (d) Largest sums based above certain threshold.
2.1. Pseudo Code
The pseudo code for the algorithm is given in Algorithm 1. In this code N is number of voxels, M is number of time points, ‘Diff’ is sign difference, and ‘SumOfDiff’ is sum of absolute of sign differences. ‘sign’ represents the sign of intensities of the voxels in an image.
3. Data and Preprocessing
We applied the proposed algorithm on data from a psychomotor vigilance task [13] from an earlier study [3]. In this study the subjects were asked to observe the change in the color of a circle from ‘black’ to ‘dark blue’ and press a button after detecting this color change. The colors were changed at random time points so the subjects did not have any idea of the task timings prior to its onset. Four fMRI runs of PVT performance were collected from each individual. Two fMRI resting-state runs were collected from each individual. In resting-state runs, individuals were told to lie quietly and look at the black dot that never changed the color. The sampling rate (repetition time or TR) of the scans was 300 msec and four slices were scanned at every time point. Standard preprocessing steps (slice time correction, motion correction, image segmentation, normalization, and registration) were performed followed by filtering (FIR, 0.01–0.08 Hz).
We applied our algorithm on data from both the task and resting-state scans. The algorithm was applied to the task data since we had information about the state change points (reaction times after the task onset) for these scans providing us with ground truths to compare the results. We chose these specific task scans since the task was very subtle and it was as close to resting state as possible. Hence, we hypothesized that the success of our algorithm on these scans would point towards its probable success for resting-state data also.
4. Results and Analysis
4.1. Real Networks (Task)
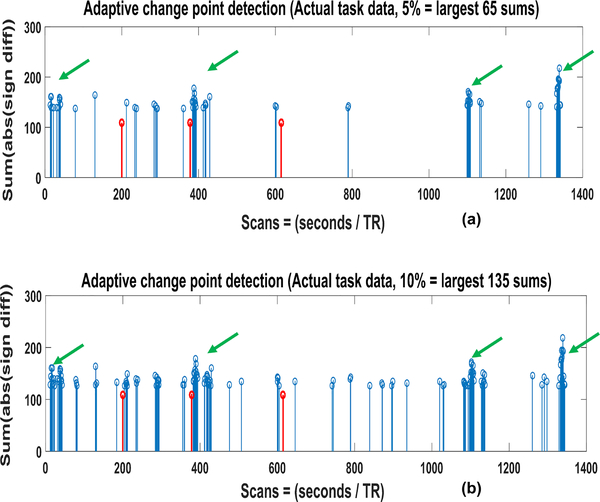
We applied the proposed algorithm on task data first. Figure 2. shows the result of our algorithm on detecting the changes in gray matter area from one run of a subject, selected at random. In both figures the red vertical lines show the reaction time of the task and the blue lines are the largest (a) 5% and (b) 10% sums of absolute differences. Large sums are present around these time points even for the case of 5% largest sums in (a). Moreover, mostly the sums are present in the form of clusters (green arrows) at adjacent time points. This is again expected since the state transition is a gradual process and would take a few seconds to complete, resulting in large consecutive changes of signs. Furthermore, these clusters are present even in the absence of any task onset which is again expected since the restingstate networks would be transitioning at the time when no task is performed.
Figure 2.
Adaptive change point detection of the vigilance task. The plots are for (a) 5% largest sums and (b) 10% largest sums.
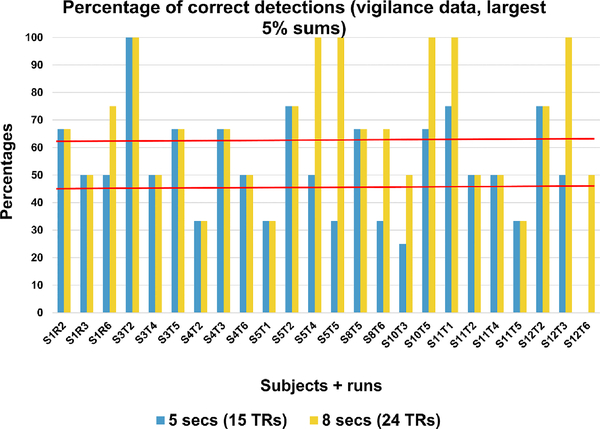
Figure 3. shows the percentage of times the largest 5% sums were within 5 seconds or 8 seconds of the reaction time for eight subjects and twenty four runs. Red horizontal lines show the mean percentages. As expected the mean percentage is higher for detection within 8 seconds of the reaction time. It should be noted here that these plots are only from 5% (65 time points) of the largest sums. Increasing this sum is expected to improve the percentage detection.
Figure 3.
Percentages of correct change point detections in vigilance data (8 subjects, 24 runs).
4.2. Real Networks (Rest)
As seen from Figure 2., clusters of largest sums of absolute differences were obtained even in the absence of any task, indicating the network transitions in the resting-state. Based on this observation we applied the algorithm on resting-state data from the same study and results for one randomly selected subject is given in Figure 4. We plotted all four slices at the start and at the end of a cluster of large sums from (a) in (b) and (c). The start and end of the cluster are pointed to by red lines (a). It can be observed that there is a significant amount of transition in the network between these two time points (shown by black ovals) that are only three seconds (9 scans) apart.
Figure 4.
Adaptive change point detection of resting-state network from a randomly chosen subject and run.
5. Conclusion and Future Work
This study presents a new algorithm for change point detection of dynamic FC networks. Using taskbased and resting-state scans we showed that this algorithm can detect the network change points reliably. Our adaptive change point detection algorithm is simple and efficient, however, it has a few limitations. Since there are changes happening in the FC networks all the time so there will always be sign differences between any adjacent images. Our algorithm is based on the hypothesis, that the largest sums would indicate the presence of state changes. However, in the absence of any information about the underlying network transitions, there is no way of knowing how many of these largest sums to analyze. Furthermore, the algorithm provides the state change points, but it does not give the information about the state the network was in, around the change points. Future studies can modify the algorithm to set a threshold on the number of largest sums based on the maximum and minimum sums of absolute differences. In future, some method can also be developed that would identify the networks around the change points by extracting the intensities from various regions that can be part of specific network(s).
References
- [1].Biswal B, Yetkin F, Haughton V, and Hyde J, “Functional connectivity in the motor cortex of resting human brain using echo-planar mri,” Magn Reson Med, vol. 34, pp. 537–41, 1995. [DOI] [PubMed] [Google Scholar]
- [2].Damaraju E, Allen E, Belgerc A, et al. , “Dynamic functional connectivity analysis reveals transient states of dysconnectivity in schizophrenia,” Neuroimage: Clinical, vol. 5, pp. 298–308, 2014. [DOI] [PMC free article] [PubMed] [Google Scholar]
- [3].Thompson G, Magnuson M, Merritt M, et al. , “Short time windows of correlation between large scale functional brain networks predict vigilance intra-individually and inter-individually,” Hum Brain Mapping, vol. 34, no. 12, pp. 3280–98, 2013. [DOI] [PMC free article] [PubMed] [Google Scholar]
- [4].Keilholz S, Magnuson M, Pan W-J, et al. , “Dynamic properties of functional connectivity in the rodent,” Brain Connectivity, vol. 3, no. 1, pp. 31–40, 2013. [DOI] [PMC free article] [PubMed] [Google Scholar]
- [5].Kiviniemi V, Vire T, Remes J, et al. , “A sliding timewindow ica reveals spatial variability of the default mode network in time,” Brain Connectivity, vol. 1, no. 4, pp. 339–47, 2011. [DOI] [PubMed] [Google Scholar]
- [6].Cribben I, Haraldsdottir R, Atlas L, et al. , “Dynamic connectivity regression: determining state-related changes in brain connectivity,” Neuroimage, vol. 61, no. 4, pp. 907–20, 2012. [DOI] [PMC free article] [PubMed] [Google Scholar]
- [7].Majeed W, Magnuson M, Hasenkamp W, et al. , “Spatiotemporal dynamics of low frequency bold fluctuations in rats and humans,” Neuroimage, vol. 54, no. 2, pp. 1140–50, 2011. [DOI] [PMC free article] [PubMed] [Google Scholar]
- [8].Lindquist M, Xu Y, Nebel M, and Caffo B, “Evaluating dynamic bivariate correlations in resting-state fmri: a comparison study and a new approach,” Neuroimage, vol. 101, pp. 531–46, 2014. [DOI] [PMC free article] [PubMed] [Google Scholar]
- [9].Liu X and Duyn J, “Time-varying functional network information extracted from brief instances of spontaneous brain activity,” Proc Natl Acad Sci, vol. 110, no. 11, pp. 4392–7, 2013. [DOI] [PMC free article] [PubMed] [Google Scholar]
- [10].Petridou N, Gaudes C, Dryden I, et al. , “Periods of rest in fmri contain individual spontaneous events which are related to slowly fluctuating spontaneous activity,” Human Brain Mapping, vol. 34, no. 6, pp. 1319–1329, 2013. [DOI] [PMC free article] [PubMed] [Google Scholar]
- [11].Shields K, Barber D, and Sherriff S, “Image registration for the investigation of atherosclerotic plaque movement,” Lecture Notes in Computer Science, vol. 687, pp. 438–58, 1993. [Google Scholar]
- [12].Vassiliadis S, Hakkennes E, Wong J, and Pechanek G, “The sum-absolute-difference motion estimation accelerator,” in Proceedings of Euromicro Conference, IEEE, 1998. [Google Scholar]
- [13].Dinges D and Powell J, “Microcomputer analyses of performance on a portable, simple visual rt task during sustained operations,” Behavior Research Methods, Instruments, and Computers, vol. 17, no. 6, pp. 652–655, 1985. [Google Scholar]


