

SUMMARY
Dietary salt reduction and exercise are lifestyle modifications for salt-sensitive hypertensives. While exercise has prominent metabolic effects, salt has an adverse effect on metabolic syndrome, of which hypertension is a hallmark. We hypothesized that dietary salt impacts metabolism in a salt-sensitive model of hypertension. An untargeted metabolomic approach demonstrates lower circulating levels of the ketone body, beta-hydroxybutyrate (βOHB), in high salt-fed hypertensive rats. Despite the high salt intake, specific rescue of βOHB levels by nutritional supplementation of its precursor, 1,3-butanediol, attenuates hypertension and protects kidney function. This beneficial effect of βOHB was likely independent of gut-microbiotal and Th17-mediated effects of salt and instead facilitated by βOHB inhibiting the renal Nlrp3 inflammasome. The juxtaposed effects of dietary salt and exercise on salt-sensitive hypertension, which decrease and increase βOHB respectively, indicate that nutritional supplementation of a precursor of βOHB provides a similar benefit to salt-sensitive hypertension as exercise.
In Brief
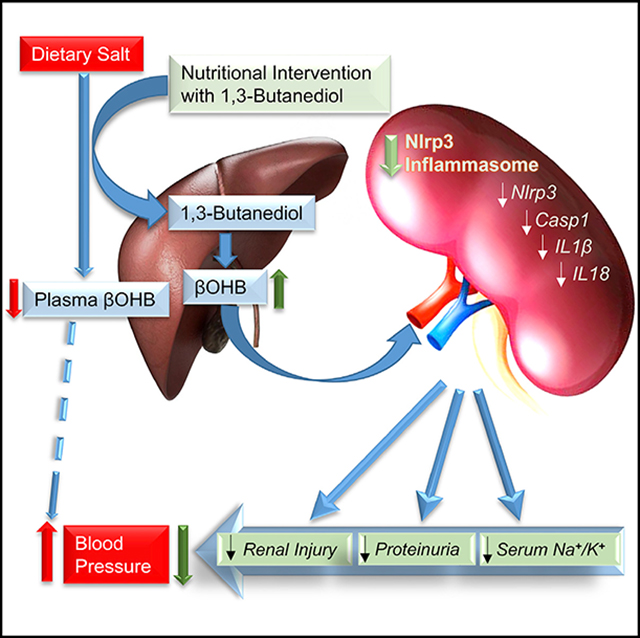
Chakraborty et al. report a link between dietary salt, a ketone, and experimental hypertension. Intake of a high salt diet lowers the ketone body betahydroxybutyrate (βOHB), produced by the liver, which functions to prevent Nlrp3-mediated kidney inflammation. Rescuing βOHB by nutritional supplementation of its precursor attenuates hypertension.
Graphical Abstract
INTRODUCTION
Hypertension is a modifiable risk factor for cardiovascular disease and exercise is widely recommended for hypertensive patients as a lifestyle modification because of the well-documented beneficial effect of exercise on lowering blood pressure (BP). Similarly, calorie restriction, although not widely recommended for patients, is also documented to lower hypertension (Dolinsky et al., 2010; Melo et al., 2016). Interestingly, both exercise and calorie-restriction are associated with increased circulating levels of ketone bodies such as β-Hydroxybutyrate (βOHB) (Evans et al., 2017; Mahoney et al., 2006; Newman and Verdin, 2017; Sutton et al., 2018; Veech et al., 2017; Wang et al., 2017). βOHB is produced predominantly in the liver, transported to extrahepatic tissues, and traditionally recognized as a vital alternative metabolic fuel during times of starvation (Newman and Verdin, 2014). However, contemporary evidence indicates that apart from serving as energy fuels, ketone bodies such as βOHB block nucleotide-binding domain, leucine-rich-containing family, pyrin domain-containing-3 (Nlrp3)-inflammasome-mediated inflammatory diseases and thereby play a prominent role in maintaining physiological homeostasis (Newman and Verdin, 2014; Youm et al., 2015). Nlrp3 inflammasome is a broad sensor for danger-associated molecular patterns (Bomfim et al., 2017; Feldman et al., 2015; Kersse et al., 2011; Savage et al., 2012; Sepehri et al., 2017; Yu et al., 2014). The anti-inflammatory effects of both exercise and caloric restriction are linked to βOHB-mediated inhibition of the Nlrp3 (Ringseis et al., 2015; Wang et al., 2016b).
In contrast to exercise and calorie-restriction, consumption of high salt promotes hypertension. Studies on the effects of dietary salt have focused mainly on organs and tissues relevant to BP regulation such as kidney, vasculature, heart, and brain. A recent study demonstrated that a high -salt diet in mice reprioritized liver energy metabolism (Kitada et al., 2017). Close associations are noted between nonalcoholic steatohepatitis and hypertension (Arima et al., 2014; Musso et al., 2003; Uetake et al., 2015; Willner et al., 2001). A recent report suggests that a reduction in salt intake serves as an additional interventional approach for reducing the risk for developing metabolic syndrome (Hattori et al., 2014; Kimura et al., 2016; Lanaspa et al., 2018), of which, hypertension is one of the hallmark features. Taken together, these studies point to an intriguing possibility that a high salt diet induced a deleterious effect on hypertension and could mechanistically represent the opposite scenario to that of the protective effects of exercise and calorie-restriction on hypertension by altering the levels of hepatogenic metabolites such as ketone bodies. Here, we examined this possibility, first by an untargeted mass spectrometry-based plasma metabolomics study and discovered altered ketogenesis and over-activation of renal Nlrp3 as a key mechanistic link between high salt and hypertension. These results indicated that a high salt diet has mechanistically opposite effects of exercise and calorie-restriction on BP. Next, we demonstrated that nutritional intervention with 1,3-butanediol, a precursor of the endogenous ketone body, βOHB, reversed the adverse effects of high salt induced renal Nlrp3-mediated inflammation, fibrosis, and hypertension. Based on these observations in the Dahl S rat, which is a salt-sensitive pre-clinical model of hypertension, we propose dietary intervention with 1,3-butanediol as an intriguing strategy for the clinical management of salt-sensitive hypertension.
RESULTS
Untargeted Metabolomics Identifies Circulating βOHB as a Key Metabolite Lowered by a High Salt Diet
Groups of salt-sensitive (S) Dahl rats were maintained on a high (2.0% NaCl) or low (0.3% NaCl) salt-containing diet and monitored for BP. The experimental time-line is provided in Figure S1. The systolic, diastolic, and mean arterial BP of the rats maintained on a high salt diet were consistently and significantly elevated compared to the low salt group (Figures 1A–1C). Renal fibrosis of these high salt-treated rats were significantly elevated compared to the low salt-treated rats (Figure 1D). Plasma metabolites in these animals were profiled using a gas-chromatography-time of flight-mass-spectrometry (GCTOF-MS)-based untargeted metabolomic approach (Data S1). Principal-component analysis (PCA) plot of the profiled untargeted metabolites is shown in Figure 2A. The distinct clusters of black and red spheres representing metabolomic data from low and high salt-fed groups of animals show that the metabolomes of these two groups of animals are distinctly different from each other (Figure 2A). Figure 2B shows that a majority of the metabolites (represented by blue dots) remain unchanged with a high salt challenge. However, a select group of 29 metabolites was differentially expressed between the high and low salt-fed groups (represented by red dots) (Table S1). A majority of these metabolites are not yet annotated. However, among the annotated metabolites, 4 metabolites were downregulated and 9 metabolites were upregulated (Table S1). Interestingly, the most differential hepatogenic metabolite was 3-hydroxybutyric acid or βOHB (Figure 2C; Table S1). βOHB is a ketone body predominantly generated by the liver. To confirm this observation, βOHB was quantitated in both fasting and fed (non-fasted) rats maintained either on low or high salt diets. Regardless of the salt in the diet, βOHB was elevated in the rats that were fasted compared to the rats in the fed state (Figure 2D). Importantly, βOHB was significantly lower in the fasted group of rats maintained on a high salt diet compared to the rats on a low salt diet (Figure 2D). This result is consistent with the differences of βOHB levels found in plasma metabolomics.
Figure 1. Hemodynamic and Renal Responses to Salt-Loading.

(A–C) Systolic (A), diastolic (B), and mean (C) arterial pressure data obtained from BP radio telemetry studies of 50- to 52-day-old rats on low (0.3% NaCl) or on high (2% NaCl) salt containing diets. Black line: data from rats on a low salt diet (n = 8). Red line: data from rats on a high salt diet (n = 8). Data points are 4 hr moving averages. *p < 0.05, **p < 0.01.
(D) Representative renal histological images of rats from the low or high salt-fed rats. Left: i and iii display images of low and high salt-fed rat kidney sections stained with Masson’s trichrome (8× magnification). The scale on the left panel (images labeled i and iii) are set at 1 mm. The boxed regions in the left panel were further magnified (40×) into the right panels (ii and iv). The scale on the right panel (images labeled ii and iv) are set at 200 μm (micrometer). Blue areas marked by cream-colored arrows denote staining for collagen, a fibrosis marker. Black/red arrows point to pink-color-filled protein casts.
Figure 2. Detection of βOHB as a Metabolite Altered by Dietary Salt.

(A) PCA plots of data obtained from untargeted metabolomics analysis of plasma samples. Each sphere represents a single animal. Black spheres: low salt-fed group. Red spheres: high salt-fed group. Distinct clusters of black and red spheres indicate that the groups are dissimilar in their metabolomics profiles.
(B) Volcano plot of all detected metabolites by the untargeted GC-TOF-MS. Blue and red dots represent metabolites not significantly and significantly different between low and high salt-fed rats (p < 0.05, fold change [FC] >1.4). +, denotes βOHB.
(C) Plasma levels of βOHB.
(D) Confirmation of the decreased serum βOHB levels in fasting rats on a high salt diet. *p < 0.05, ns, not significant.
Nutritional Intervention with βOHB-Attenuated Hypertension
Next, to examine whether an increase in circulating βOHB could directly impact BP regulation, rats were provided with or without the precursor of βOHB, 1,3-butanediol in drinking water, and their BP was monitored. Under both fasted and fed conditions, circulating βOHB levels were elevated in the rats given 1,3-butanediol (Figure 3A). This restoration of circulating βOHB levels compared to animals without nutritional βOHB supplementation was associated with significantly lower systolic, diastolic, mean arterial BP, and heart rate compared to that of the rats maintained without 1,3-butanediol (Figures 3B–3D, 6C, and S7A). However, the overall 24 hr BP lowering effect was only significant in the high salt versus high salt + 1,3-butanediol group compared to low salt versus low salt + 1,3-butanediol group (Figures S7A and S7B). From this point forward, we therefore resorted to studying only the high salt and high salt + 1,3-butanediol groups. Alterations in BP in these groups were accompanied by a lower Na+/K+ ratio in the sera and lower microalbuminuria of high salt-fed rats treated with 1,3-butanediol (Figures 3E–3G).
Figure 3. Nutritional Intervention with βOHB Lowered Hypertension.

Groups of 64- to 65-day-old S rats were administered with (n = 12) or without (n = 10) 20% v/v of 1,3-butanediol in drinking water for 5 weeks.
(A–D) Serum levels of βOHB on week 3 post administration of 1,3-butanediol (A), systolic (B), diastolic (C), and mean (D) arterial pressure data recorded by radio telemetry after 3 weeks on 1,3-butanediol. Data points are 4 hr moving averages. (E) Fasted and fed Na+/K+ ratio in serum on week 3 post administration of 1,3-butanediol.
(F and G) Microalbumin (F) and microalbumin/creatinine (G) ratio in serum on week 3 post administration of 1,3-butanediol. *p < 0.05, **p < 0.01, ***p < 0.001.
Figure 6. Assessment of Renal Nlrp3 Inflammasome and Related Measures of Inflammation.

(A–C) Comparisons of renal quantitative real-time PCR data of Nlrp3 and Casp1 (A), IL18 (B), and IL1β (C) from 1,3-butanediol-treated rats compared to the rats without the 1,3-butanediol treatment. Pgk-1, phosphoglycerokinase-1.
(D and E) ELISA data from high salt versus high salt + 1,3-butanediol treated rats (D) and low salt versus high salt fed rats (E), for comparisons of serum IL1β.
(F) Same legend as (A)–(C) for Lcn2.
(G and H) ELISA data from high salt versus high salt + 1,3-butanediol treated rats (G) and low salt versus high salt fed rats (H) for comparisons of serum Lcn2; *p ≤ 0.05; **p < 0.01, ***p < 0.001.
Protective Effect of βOHB on Salt-Sensitive Hypertension Is Likely Independent of Salt-Dependent Th17 Activation
βOHB is known to lower inflammatory responses (Newman and Verdin, 2014, 2017; Roberts et al., 2017; Veech et al., 2017; Wang et al., 2017; Youm et al., 2015), and previous studies implicate the immune system in salt-sensitive hypertension via the exaggeration of the pro-inflammatory T cell function (De Miguel et al., 2010, 2015; Maalouf et al., 2009; Mattson, 2014; Mattson et al., 2006; Rudemiller et al., 2014; Wu et al., 2013). Therefore, to delineate the mechanism by which βOHB lowers salt-sensitive hypertension, we focused on kidney function in hypertension and examined the status of molecules associated with salt-responsive Th17 activation. In confirmation with previous reports, the levels of Sgk1, IL23, Rorγt, and IL17r were significantly upregulated in the rats on a high salt diet compared to those on a low salt diet (Figure S2A). To examine whether alterations in βOHB affected these Th17 responses, we measured the renal Th17 profile in high salt-fed rats treated with 1,3-butanediol. Despite the increase in serum βOHB of rats fed with 1,3-butanediol, there was no difference in the levels of molecules (except IL17r) associated with salt-responsive Th17 activation compared to the rats with lower serum βOHB in the rats that did not receive 1,3-butanediol (Figure S2B). These data support a Th17-independent mechanism for the BP lowering effect of βOHB.
Gut Commensal Microbiota Adapt to High Salt-Induced Decrease in Host Ketogenesis
Due to the fact that microbiota are also known to be altered in response to a high-salt diet (Wilck et al., 2017), we compared the fecal microbiotal profiles of genetically hypertensive S rats maintained on a low versus high salt diet (Figure S3; Data S2). Consistent with the published literature (Wilck et al., 2017), abundance of Lactobacilli spp. was lower in the high salt-fed group (Figure 4A). Additional alterations were noted in Proteobacteria, which were depleted and Prevotella, which were enriched in the high salt-fed group compared to the low salt-fed animals (Figures 4B and 4C). Associated with these changes, we observed alterations in several metabolic functional pathways of the gut microbiota of high salt-fed rats compared to low salt-fed rats (Figure 4D). Interestingly, the two major metagenomic functional pathways, which were downregulated in the high salt-fed group (Figure 4D, black bars), were the phosphotransferase system (regulating gluconeogenesis) and the synthesis and degradation of ketone bodies. Additional downregulation of functional pathways related to carbohydrate metabolism including galactose, fructose, and mannose metabolism were noted (Figure 4D, black bars). In contrast, in response to a high-salt diet there were a number of upregulated pathways related to amino acid metabolism such as valine, leucine, isoleucine, histidine, phenylalanine, lysine, alanine, aspartate, glutamate, cysteine, and methionine metabolism (Figure 4D, red bars).
Figure 4. Assessment of Microbiotal Profiles and Functional Data from 16S RNA Sequencing of Fecal Samples from S Rats Fed with Low or High Salt.

(A–C) Relative abundance of Lactobacilli (A), Proteobacteria (B), and Prevotella (C) in S rats on low or high salt diets. Plotted are dots representing values from each rat along with a mean ± SEM.
(D) Functional analysis of microbiotal profiles. Black bars represent functional pathways enriched in the low salt-fed group. Red bars represent functional pathways enriched in the high salt-fed group.
To determine whether the above alterations in the gut microbiotal compositions reflected in any changes in the gut microbial products such as short-chain fatty acids (SCFAs), we conducted a second, targeted metabolomic profiling to specifically assess the SCFA levels in the high salt- versus low salt-fed groups of rats. Changes in gut microbiotal composition or their functional pathways did not result in any changes in circulating SCFAs (Figure S5A). Also, gut barrier function, as measured by fluorescein isothiocyanate (FITC)-dextran translocation, was not different between the high and low salt diet-fed animals (Figure S5B). In addition, as an indirect measure of epithelial permeability function, serum immunoreactivity to bacterial products such as flagellin and lipopolysaccharide (LPS) was unaltered between the groups (Figure S5C).
βOHB Does Not Restore Gut Commensal Depleted by High Salt
Further, to examine whether a high salt-induced lowering of the ketone body, βOHB, was a factor for shaping the gut microbiota, we compared the fecal microbiota of groups of rats maintained on a high salt diet with or without the supplementation of 1,3-butanediol (Figure S4; Data S3). Rats receiving this supplement had a modest increase, but not complete restoration in their gut commensal levels of Lactobacilli spp. or Proteobacteria as seen in the low salt-fed rats (Figures 5A and 5B). However, a significant decrease in a commensal Prevotella (Figure 5C) and increase in Akkermansia were noted (Figure 5D). These changes were accompanied by an overall shift in functional pathways of gut microbiota from an increase in amino acid pathways in response to a high salt diet (Figure 4D, red bars) reversed to a decrease in amino acid pathways with the administration of the pre-cursor of βOHB (Figure 5E, purple bars).
Figure 5. Assessment of Microbiotal Profiles and Functional Data from 16S RNA Sequencing of Fecal Samples from S Rats Fed with High Salt or High Salt with 1,3-Butanediol.

(A–D) Relative abundance of Lactobacilli (A), Proteobacteria (B), Prevotella (C), and Akkermansia (D) in fecal samples of S rats on a high salt diet either with or without nutritional intervention with 1,3-butanediol. Plotted are dots representing values from each rat along with a mean ± SEM.
(E) Bars represent functional pathways. Red color: pathways enriched in the high salt group without 1,3-butanediol. Purple color: pathways enriched in the high salt group administered with 1,3-butanediol.
βOHB-Mediated Inhibition of the Renal Nlrp3-Inflammasome
Because Th17 and gut-microbiotal modalities did not fully account for the mechanism by which βOHB contributes to a decrease in BP, we focused on the known effects of βOHB on the Nlrp3 inflammasome. Rats maintained on a high salt diet and administered with or without 1,3-butanediol were examined for levels of Nlrp3 and Caspase1, which are the signal sensor and effector components of the Nlrp3 inflammasome, respectively. Both Nlrp3 and Caspase1 were significantly lower in the kidneys of the 1,3-butanediol-treated rats compared to the rats without the 1,3-butanediol treatment (Figure 6A).
Next, to examine the downstream effects of the Nlrp3 inflammasome complex, which is also a driver of the expression of proinflammatory cytokines interleukin (IL)-1β and IL18, we examined the levels of these cytokines. Rats treated with 1,3-butanediol had lower renal levels of both IL1β and IL18 (Figures 6B–6D) compared to the rats without the 1,3-butanediol treatment. This lowering effect on IL1β is consistent with the observed lower serum IL1β levels in low salt-fed rats compared to high salt-fed rats (Figure 6E).
βOHB is an inhibitor of the over-activation of the Nlrp3-inflammasome, which contributes to escalating inflammation. To test whether the lower levels of the key Nlrp3 inflammasome components in response to the 1,3-butanediol treatment of high salt-induced hypertension led to an overall lowering of renal inflammation, we measured the renal levels of Lipocalin2 (Lcn2), a real-time marker of renal inflammation (Paragas et al., 2011). Serum Lcn2 was significantly lowered by the administration of βOHB to rats on a high salt diet (Figures 6E and 6F). This lower level of Lcn2 is also consistent with the reduced serum Lcn2 level of low salt-fed rats compared to high salt-fed rats (Figure 6G).
βOHB-Mediated Inhibition of the Nlrp3-Inflammasome Activation Protects Kidneys
Previous reports suggest a role for Nlrp3 in renal injury and identify the Nlrp3 inflammasome as a possible therapeutic target in the treatment of patients with progressive chronic kidney disease (Anders et al., 2018; Bai et al., 2017; Bugyei-Twum et al., 2016; Foresto-Neto et al., 2018; Hutton et al., 2016; Vilaysane et al., 2010). A recent study links IL1β with kidney tubulointerstitial fibrosis (Lemos et al., 2018). Therefore, to determine whether βOHB-mediated inhibition of the Nlrp3-inflammasome similarly impacted renal structure and function, we subjected renal tissue of rats in our study for histological and immunochemical examination. Renal injury characterized by the extent of fibrosis, glomerulosclerosis, and protein casts were all significantly decreased in the βOHB-treated rats (Figures 7A–7C). Associated with these alterations, kidneys of rats treated with 1,3-butanediol had lower levels of Hif1α, Tgfβ1, Serpine 1, and Col1a2 expression, which are markers of cellular stress and tissue fibrosis (Figure 7D). 24-hr urinary protein excretion was significantly lowered by the treatment of high salt-fed rats with 1,3-butanediol (Figure 7E). Further, through histological staining for macrophages, it was noted that the remission of renal inflammation and injury led to a lower extent of macrophages infiltrating the kidneys of high salt-fed rats, which were nutritionally supplemented with 1,3-butanediol (Figures 7F–7H).
Figure 7. Remission of Kidney Fibrosis, Protein Casts, and Urinary Proteinuria in Rats Treated with βOHB.

(A and B) Kidney sections of high salt-fed rats treated without (A) or with (B) 20% v/v of 1,3-butanediol were stained with Masson’s trichrome. Left: i and iv displays the images at low magnification (8×). The boxed regions in the left panel were further magnified (40×) into the right panel (ii and v). Black arrows in (ii) and (v) indicate protein casts; dark blue arrows in (iii) and (vi) denote blue staining for collagen.
(C–E) Bar graphs show quantitation of renal injury (n = 4/group) (C), mRNA level of genes encoding for cellular stress and tissue fibrosis (n = 8/group) (D), and UPE (urinary protein excretion) (E).
(F and G) Representative images (200× magnification) of kidney sections of high salt fed rats (F) and high salt + 1,3-butanediol fed rats (G) display immunostaining for macrophages (Cd68, brown color). Arrows indicate the infiltration of macrophages in kidney sections.
(H) Quantitation of macrophage numbers. Numbers are counts of macrophages; n = 10. 10× magnification fields/group. Values are expressed as mean ± SEM (*p < 0.05, **p < 0.01, ***p < 0.001).
DISCUSSION
Ketogenesis is a metabolic adaptation response to energy crisis to sustain life by altering oxidative fuel selection. The production of ketone bodies increases rapidly under energy-deficit conditions such as calorie restriction and prolonged exercise, both of which are linked to health benefits of lowering BP. Our study, focused on a specific ketone body, βOHB, which was identified via an untargeted metabolomics profiling experiment, has identified that consumption of a high salt-containing diet represents an antithesis to the relationship between ketone bodies and calorie restriction or prolonged exercise. Specifically, a key liver-derived ketone body, βOHB, was downregulated and associated with a high salt-induced elevation of BP. Exogenously increasing the levels of βOHB lowered salt-induced hypertension, demonstrating the direct therapeutic effect of 1,3-butanediol, which is a precursor of βOHB, in controlling salt-sensitive hypertension. Reversal of salt-induced alterations in gut microbiotal composition, gut microbiotal-derived SCFAs, and Th17 profiles were explored and eliminated as mechanisms by which βOHB facilitates a lowering effect on hypertension. Instead, our results point to the observation that the lowering of βOHB associated with intake of a high-salt diet causes hyperactivation of the renal Nlrp3 inflammasome. We propose that this salt-induced mechanism of increased renal injury and fibrosis contributes, at least in part, to the observed lowering of BP by this hepatogenic metabolite.
Salt (sodium chloride [NaCl]) is an essential micronutrient food additive that enhances taste and is a food preservative. High intake of salt is associated with an increased risk for hypertension and cardiovascular mortality, leading many professional societies to recommend limiting salt intake to 3.75–6 g/day (World Health Organization, 2003). However, intake of salt is generally greater and can average >10 g/day in many populations (Brown et al., 2009). Excess salt consumption adversely affects cardiovascular and renal physiology, and to a lesser known extent, liver physiology. Ingestion of high salt (4% NaCl in drinking water) by mice and exposure of chick embryos to high salt lead to liver fibrosis and derangement of the hepatic cords, respectively (Wang et al., 2016a). A recent study reporting the adverse effect of salt on obesity notes that a high intake of salt activates the aldose reductase-fructokinase pathway in the liver and leads to endogenous fructose production (Lanaspa et al., 2018). However, isocaloric substitution of fructose for other carbohydrates did not adversely affect BP in humans (Ha et al., 2012). Thus, although salt is known to adversely affect liver function in different studies, whether this adverse effect of salt on the liver contributes to salt-sensitive hypertension is not known. Our study, using a genetically sensitive model for salt-induced hypertension (Padmanabhan and Joe, 2017), demonstrates that high salt-induced hypertension is indeed linked to liver function. This inference is based on the salt-responsive oscillation of a key metabolite, βOHB, which is one of the major ketone bodies produced by the liver. Admittedly, the study has not directly tested the direct effect of high salt on hepatic ketogenesis per se.
βOHB is synthesized by the liver and released into the blood for use as a metabolic fuel by other tissues, particularly the kidney, heart, and brain. Although traditionally viewed as a metabolic substrate used as a vital alternative metabolic fuel for life spanning from archaea and bacteria to eukaryotes, ketone bodies are increasingly being recognized as metabolic and signaling mediators even when carbohydrates are abundant (Puchalska and Crawford, 2017). Through such functions, protective roles for ketone bodies, specifically βOHB, are noted in cancer, heart, and liver diseases (Puchalska and Crawford, 2017). The major finding of our study is that it identifies a similarly protective effect of a ketone body on salt-sensitive hypertension.
In addition to lowering dietary salt, physicians often recommend hypertensive patients should exercise. However, exercise may be difficult for some patients to incorporate into their lifestyles. Hence, if at all possible, it would be useful to derive the beneficial biochemical effects of exercise through simpler, more practical means such as through nutritional intervention. Viewed from this context, it is intriguing to note that βOHB is a common factor underlying both exercise and dietary salt. βOHB levels are elevated during high-intensity exercise and, based on our report, inversely correlated with dietary salt content. Thus, at the level of a circulating metabolite, by lowering the intake of salt, or by nutritional supplementation of precursors of βOHB, hypertensive subjects could be deriving the same beneficial effects of elevated βOHB as that of exercise. The commonality of the underlying mechanism is traced to the beneficial effects of βOHB as an inhibitor of the Nlrp3 inflammasome (Youm et al., 2015). High salt diet in the Dahl S rat is reported to be associated with inflammatory pathways and the inflammasome (Huang et al., 2016; Tian et al., 2007; Zhu et al., 2016). What is exciting here is the ability of 1,3-butanediol to prevent the activation of the inflammasome in S rats, which could serve as a basis for further translational intervention studies. Admittedly, evidence from our study is limited to such mechanistic observations in the kidney. It is also possible that the effects of βOHB on the Nlrp3 are similarly operational in extra renal systems including the vasculature, heart, and brain, which may add to the observed lowering of BP.
A recent report indicates that high dietary salt leads to a decrease in gut lactobacilli (Wilck et al., 2017), which raises the question of whether the decrease in βOHB is due to the indirect effect of the altered gut bacterial composition in response to a high salt diet. Our results obtained by nutritionally increasing βOHB levels, which lowers hypertension despite the high-salt diet regimen and the associated salt-responsive re-arrangement in gut bacterial composition, indicates that the salt-induced decrease in βOHB is not a host adaptation in response to altered gut microbiota. Further, βOHB-fed animals did not completely restore the gut microbiotal composition to be similar to that of a low salt-induced gut composition, suggesting that the salt effect and the βOHB effect on the gut microbiotal composition are distinctly different (Figures 4 and 5; Data S2 and S3).
The use of 1,3-butanediol in our study is based on the literature (Youm et al., 2015). However, one drawback of using a high concentration of 1,3-butanediol is that not all of the 1,3-butanediol is converted to βOHB, whereby residual 1,3-butanediol may also circulate and contribute to the observed BP effect. There is no simple solution to address this problem because, in order to test the sole effect of βOHB, infusion studies have to be conducted, but βOHB is only available as a sodium salt. Sodium therefore presents as a major confounding variable, whereby the sole effect of βOHB is unlikely to remain unknown. Reports in the literature (Carpenter and Grossman, 1983; Hall et al., 1984; Rossi et al., 2000) indicate that both 1,3-butanediol and βOHB are associated with diminished body weight and glycemia. Therefore, we examined these metabolic parameters (Figures S6A and S6B). However, Nlrp3 inflammasome is known to play a key role in obesity and glycemia control (Stienstra et al., 2011; Vandanmagsar et al., 2011; Wan et al., 2018). Taken together, the body weight and glycemia reduction noted in our study support the notion that βOHB inhibits the Nlrp3 inflammasome and has multiple effects, which may additionally converge and contribute to the observed BP lowering effect. In future, it is of interest to validate our data on the blood pressure-lowering effect of 1,3-butanediol with other sources of βOHB such as ketone esters (Cox et al., 2016) as well as with other animal models.
Microbiotal alterations in response to 1,3-butanediol supplementation is interesting. The colonization of Akkermansia, in particular, is notable because the presence of this bacterium is inversely correlated with body weight in rodents and humans (Collado et al., 2008; Everard et al., 2013; Karlsson et al., 2012; Santacruz et al., 2010; Schneeberger et al., 2015). In our study, rats with elevated βOHB indeed demonstrated lower body weight (Figure S6A) suggesting that colonization of Akkermansia in response to 1,3-butanediol administration could represent one of the mechanisms underlying the body weight lowering effect of βOHB. However, further experiments will be required to address the potential for Akkermansia to independently affect BP.
Both endurance exercise and starvation place a premium on glucose reserves. Cox et al. (2016) have shown the benefits of diet-derived ketosis, which alter fuel preference under energy-intense conditions such as endurance training. Kitada et al. (2017) describe that high salt intake, as it requires hepatic and extrahepatic urea osmolyte production for renal water conservation, is also a similar energy-intense condition requiring reprioritization of energy metabolism. Our observations, wherein, rats with diet-derived ketosis had lower fasting glucose levels (Figure S6B), also indicates a reprioritization of energy metabolism, but our finding that a high salt diet lowers βOHB contradicts the report by Kitada et al. (2017) showing that dietary high salt results in hepatic ketogenesis. While both studies identify that reprioritization of energy metabolism occurs with a high salt diet, the direction of prioritization could be different depending on the salt-sensitivity, genetic background, fed (non-fasted) or fasted state, and volume expansion features of the model. It is worth noting that the study by Kitada et al. (2017) on fed mice is different from our study where in the reported results are more prominent in the fasted state. The Dahl S rat used in our study is highly salt-sensitive (i.e., their increase in BP is dependent on an increased blood volume) (Greene et al., 1990), whereas the mouse model used by Kitada et al. (2017) is insensitive to salt-induced BP. The inability of the S rat to increase the production of βOHB could be due to an impaired “switching” mechanism from carbohydrate to ketone metabolism, which is remedied by the exogenous administration of the precursor of βOHB. In this context, it is relevant to point out that S rats have poor running capacity compared to other inbred rats (Barbato et al., 1998; Kumarasamy et al., 2013). It is therefore tempting to speculate that the aberrant shift from glucose to ketone body utilization as substrate for energy production may not only affect salt-induced hypertension in this model, but may also adversely affect their endurance running capacity.
Overall, the major finding of our study is that similar to the importance of exercise-derived benefits of ketogenesis, the hepatogenic ketone body, βOHB, either endogenously produced by the liver or exogenously supplemented via dietary ketosis, is vitally important in the regulation of salt-induced hypertension. The results of our study underscore the need for translational studies in humans to harness similar metabolic actions of nutritional ketogenesis, as a substitute or in addition to exercise, in the clinical management of salt-sensitive hypertension.
STAR★METHODS
CONTACT FOR REAGENT AND RESOURCE SHARING
Further information and requests for resources and reagents should be directed to and will be fulfilled by the Lead Contact, Bina Joe (bina.joe@utoledo.edu).
EXPERIMENTAL MODEL AND SUBJECT DETAILS
The inbred Dahl salt-sensitive (SS/Jr or S) rat strain was used in the entire study. The S rat is a widely used pre-clinical model selectively bred for hypertension in response to a high salt diet (Dahl, 1961; Dahl et al., 1964, 1970; Rapp and Dene, 1985; Rapp et al., 1973). The inbred strain of the S rat model was developed in our laboratory at the University of Toledo College of Medicine and Life Sciences (previous Medical College of Ohio) as a salt-sensitive genetic model for hypertension in 1985 and since then maintained in-house (Rapp and Dene, 1985). Due to their inherent propensity to develop hypertension, the entire S rat colony is bred and maintained on a low salt diet (0.3% NaCl; Harlan Teklad diet TD 7034, Madison, WI). The Harlan Teklad diet (TD94217) was used for experiments involving a high salt regimen (2% NaCl). All animal breeding and research procedures were conducted as per approved IACUC protocols. All rats in any single experiment were raised by breeding their parents concomitantly. Male rats were used for all studies. Pups were weaned at 28 days and maintained either on a low (0.3% NaCl) salt containing diet or on a high salt (2% NaCl) diet as needed. For nutritional intervention studies, rats were given 20% (v/v) 1, 3-butanediol in their drinking water for durations mentioned under each study. All the animals were allocated to experimental groups randomly. The timelines of the salt study experiment and nutritional intervention study are as shown in Figure S1.
METHOD DETAILS
Blood Pressure Measurements
Rats were surgically implanted with radiotelemetry transmitters as described previously (Mell et al., 2015). Post-surgery, rats were housed individually and allowed to recover prior to recording their BP using the DSI software and equipment (https://www.datasci.com/). Systolic, diastolic and mean arterial pressure were collected at 5 minintervals and analyzed using the Dataquest A.R.T 4.2 Software.
Urinary Protein Excretion (UPE)
UPE determination was done as previously described (Garrett et al., 2006). Briefly, within 7 days following BP measurements, each rat was housed individually in a metabolic cage and its urine was collected over a 24-hr period. The pyrogallol based QuanTtest Red Total Protein Assay from Quantimetrix (Redondo Beach, CA, USA) was used to determine protein concentrations of the urine samples. A SpectraMax M3 microplate reader from Molecular Devices (Sunnyvale, CA, USA) was used to determine absorbance at 600 nm. Protein concentrations were determined by reading against the absorbance of the QuanTtest human protein standards (25–200mg/dl). UPE data are presented as milligrams over a 24-hr period (mg per 24-hr).
Serum and Urinalysis
Within 7 days following BP measurements, serum (from non-fasted rats) was collected from rats fed with low salt, high salt or high salt with 1,3- Butanediol. Each rat was housed individually in a metabolic cage with food and water and urine was collected over a 24-hr period. Then, the rats were continued to be housed in metabolic cages with access to water, but not food, for 24-hr fasted serum and urine collection. At the end of the urine collection period, urine volume was recorded, and the rats were moved back to their home cages with access to food ad libitum. Both serum and urine were stored at −80°C. Sodium, microalbumin and creatinine contents were assessed with a Beckman Coulter AU680 analyzer by the ion selective electrode diluted (indirect) method.
Measurement of Serum βOHB
βOHB level was measured in the serum obtained from low salt, high salt or high salt with 1,3-Butanediol groups by using a colorimetric assay kit (Cayman Chemicals, catalog # 700190). Briefly, serum was diluted to 1:2 (for fed or non-fasted state) and 1:8 (for 1, 3 butanediol supplemented and fasted group) with assay buffer provided in the kit. Standard was prepared as per manufacturer’s protocol. The standards and samples were added into respective wells, and reaction was triggered by adding the developer solution. After 30 min. of incubation at 25°C in dark, optical density was recorded at 450 nm using SpectraMax M3 microplate reader from Molecular Devices (Sunnyvale, CA, USA).
Histological Analyses
Immediately, after euthanasia kidneys were fixed in neutral buffered formalin for 24-hr and then transferred to 70% ethanol for paraffin-embedding and sectioning via microtome. To observe the morphological and histopathological changes kidney sections were stained with Hematoxylin & eosin. Kidney sections were graded in a blinded manner on an arbitrary semiquantitative scale from 0 to 4 for kidney lesions as previously described (0 = normal, 1 = mild, 2 = moderate, 3 = marked, 4 = severe, including half points) (Garrett et al., 2003). The extent of macrophage infiltration in kidney was examined immunohistochemically. Briefly, paraffinembedded kidney sections were de-paraffinized and immersed in citrate buffer for epitope retrieval. After, blocking with horse serum, the sections were incubated overnight with mouse anti-rat CD68 (Bio-Rad, Cat # MCA341R, 1:100 dilution). CD68-positive cells i.e., macrophages, were detected by using Vectastain Elite ABC kit and peroxidase substrate kit (Vector Laboratories Inc. Burlingame, CA). The images were visualized, captured, and analyzed by using VS120 Virtual Slide Microscope (Olympus).
Microbiotal 16S RNA analysis
DNA extraction and Quantification
Fecal DNA was extracted from one fecal pellet (approximately 0.2g) using QIAam®PowerFecal®DNA kit (QIAGEN) followed by provided protocol. At elution step, 50μl of low TE buffer (0.1mM EDTA, Tris-HCl buffer, 10mM, pH8.5) was used instead of AE buffer from the kit. DNA concentration was measured by NanoDrop and then it was diluted to be 5ng/μl in low TE buffer to proceed the PCR library preparation.
16S PCR library preparation, Clean-up, Normalization, and Pooling
We followed Illumina User Guide: 16S Metagenomic Sequencing Library Preparation-Preparing 16S Ribosomal RNA Gene Amplicons for the Illumina MiSeq System (Part # 15044223 Rev. B).
The 16S rRNA gene targeting V3-V4 region was amplified by PCR using the Ilumina primers
5′TCGTCGGCAGCGTCAGATGTGTATAAGAGACAGCCTACGGGNGGCWGCAG and 5′ GTCTCGTGGGCTCGGAGATGTGTATAAGAGACAGGGACTACHVGGGTWTCTAAT. For index PCR, Nextera XT index kit (FC-131–1002) were used to attach dual indices. Following the Illumina User Guide for the Illumina MiSeq System, 10pM denatured and diluted library was mixed with 10pM PhiX control spike-in to be 10% PhiX in the final volume and loaded on Illumina MiSeq V3 flow cell kit with 2X300 cycles.
Quality Filtering, OTU Picking and Data Analysis
Raw 16S sequencing data were processed and analyzed using a bioinformatics pipeline of multiple software including USEARCH (Edgar, 2010), Quantitative Insights Into microbial Ecology (QIIME) software package (version 1.9.1) (Caporaso et al., 2010), linear discriminant analysis effect size (LEfSe) (Segata et al., 2011), phylogenetic investigation of communities by reconstruction of unobserved states (PICRUSt) (Langille et al., 2013) and HMP unified metabolic analysis network (HUMAnN) (Abubucker et al., 2012).
Raw paired-end reads were merged to create consensus sequences and then quality filtered using USEARCH (version 9). Chimeric sequences were identified and filtered using QIIME combined with the USEARCH (version 6) algorithm. Open reference operational taxonomic units (OTUs) were subsequently picked using QIIME combined with the USEARCH (version 6) algorithm, and taxonomy assignment was performed using Greengenes (DeSantis et al., 2006) as reference database. Using a series of QIIME pipelines, alpha and beta-diversity analyses were performed using a BIOM formatted OUT table. Taxonomic features with difference abundance were further summarized using LEfSe (https://huttenhower.sph.harvard.edu/galaxy/) for group comparisons and predictive metagenome functional analysis was performed using PICRUSt and HUMAnN.
Gut Barrier function
Rats from each of the 3 groups (low salt, high salt and high salt with 1,3- Butanediol groups) were fasted for three hr. 4kDa FITC-dextran (Sigma Cat#FD4) was gavaged at 13.7mg/kg body weight. After the gavage, food and water were provided. After two hours, serum was collected. Hemolysis-free serum was serially diluted in PBS in a 96-well black plate. Fluorescence intensity of the hemolysis-free serum was measured (excitation 490 nm; emission 520 nm) using a microplate reader (SpectraMax M3).
Enzyme-linked immunosorbent assay (ELISA)
Sera were collected from low salt, high salt and high salt with 1,3- Butanediol fed rats with and without treatment with 1, 3-Butanediol. Serum IL-1β [1:10 in reagent diluent (PBS+1% BSA)] and serum Lcn2 [1:250 in reagent diluent (PBS+1% BSA)] were measured by duoset enzyme-linked immunosorbent assay kits from R&D Systems (cat# DY501–05 and cat# DY3508 respectively) according to the manufacturer’s protocol. All reagents used in the IL-1β and Lcn2 ELISA were procured from R&D Systems unless specified.
Lipopolysaccharide (LPS) from Escherichia coli 0128:B12 (Cat# L2887) was procured from Sigma (St. Louis, MO, USA). Flagellin was purified from Salmonella typhimurium (SL3201, fljB– strain) through sequential cation and anion-exchange chromatography as described previously (Ziegler et al., 2008). A 96-well plate was coated with LPS (2 μg/well) or flagellin (100 ng/well) in 9.6 pH bicarbonate buffer (100 μL/well) and incubated overnight at 4°C. Plates were washed thrice with wash buffer (0.05% goat serum and 0.01% Tween 20 in PBS). Serum samples were diluted (1:200) in wash buffer and loaded 100 μL to each well. After incubation for 1-hr at 37°C, plates were washed thrice with wash buffer. Anti-rat IgG HRP-conjugated (Cat# 112–035-003 bought from Jackson ImmunoResearch Laboratories, Inc.) was added (100 μL/well) and incubated at 37°C for 1-hr. Plates were washed thrice with wash buffer and added with 3,3′,5,5′-tetramethylbenzidine (TMB) chromogenic substrate (100 μL/well). After 5 min incubation at room temperature, reaction is stopped by adding TMB Stop Solution (50 μL/well) and the optical density was read at 450 nm. All reagents used in the Flagellin and LPS ELISA were procured from Sigma (St. Louis, MO, USA) unless specified.
Untargeted Metabolomics
After 4 weeks on differential salt containing diets, rats were fasted overnight and plasma samples from high salt or low salt fed groups of rats (n = 9/group) were collected and shipped to the West Coast Metabolomics Center at UC Davis (http://metabolomics.ucdavis.edu/) for a primary metabolism panel of GC-TOF-MS based untargeted metabolomics profiling (http://metabolomics.ucdavis.edu/core-services/metabolomics-central-service-core). All metabolites were reported by retention index, quantification mass, biochemical database identifiers and full mass spectra. Metabolites were quantified by peak heights. Data were visualized as PCoA plots by Sparse Partial Least Squares-Discriminant Analysis (sPLS-DA) and significantly different metabolites were mined for the pathways they impacted using MetaboAnalyst (Xia et al., 2009).
Targeted Metabolomics
25 μL of plasma was extracted with acetonitrile spiked with internal standards, and the supernatant was then mixed with 200 mM 3-nitrophenylhydrazine and 120 mM N-(3-dimethylaminopropyl)-N1-ethylcarbodiimide in a 2:1:1 (v/v/v) ratio. The samples were derivatized at 40°C for 30 min and then injected into an Agilent 6410 triple quadrupole mass spectrometer equipped with an electrospray ionization (ESI) source in negative-ion mode coupled to an Agilent 1290 infinity HPLC system with an Acquity UPLC BEH C18 column (2.1×100 mm, 1.7 μm; Waters, Milford MA). Solvent A was formic acid (0.01%, v/v) in water, and solvent B was formic acid (0.01%, v/v) in acetonitrile.
Quantitation was performed by calibration to internal standards and standard curves on the Mass Hunter quantitative suite version B.06.00 (Santa Clara). All levels are expressed in μM (Han et al., 2015; Mell et al., 2015; Theriot et al., 2014).
RNA isolation and RT-PCR analysis
Kidneys from low salt, high salt and high salt with 1,3-Butanediol intervention group rats were isolated and homogenized in TRIzol reagent (Invitrogen) for extracting RNA. We used 1 μg of total RNA to obtain cDNA by reverse transcription with SuperScript III kit (Invitrogen). Levels of mRNA expression of Casp1, Nlrp3, IL1β, Lcn2, Hif1β, Tgfb1, Serpine1, Col1a2, RorγT, IL23, Sgk1, and IL17r (primer sequence shown in Table S2) were analyzed by real-time PCR (Applied Biosystems), and expression levels relative to the expression of Pgk1 were calculated by the 2-ΔΔCT method (Livak and Schmittgen, 2001).
QUANTIFICATION AND STATISTICAL ANALYSIS
Graph Pad Prism version 5.02 was used for all analyses. Student’s t test was used to compare two groups, whereas one-way ANOVA with Bonferroni post hoc test was used for studies with more than two groups. A p value < 0.05 was considered to be significant. All bar graph values are expressed as Mean ± SEM. Information on replicates for each experiment can be found in the figures and figure legends.
DATA AND SOFTWARE AVAILABILITY
Data from untargeted metabolomics are reported in the Metabolomics Workbench and the study number is ST001051. (http://dev.metabolomicsworkbench.org:22222/data/DRCCMetadata.php?Mode=Study&DataMode=ProjectData&StudyID=ST001051&StudyType=MS&ResultType=5#DataTabs) The metabolomics profile is presented in the Data S1. The microbiotal profile of high salt and low salt fed animals is in Data S2. The microbiotal profile of high salt versus high salt plus 1,3-Butanediol fed animals is listed in Data S3. Raw and analyzed data are deposited with Mendeley Data at DOI: https://data.mendeley.com/datasets/4tt4hcmxr4/1.
Supplementary Material
KEY RESOURCES TABLE.
| REAGENT or RESOURCE | SOURCE | IDENTIFIER |
|---|---|---|
| Antibodies | ||
| Mouse anti-rat CD68 | Bio-Rad | Cat#MCA341R; RRID: AB_2291300 |
| Rat IL-1 beta/IL-1F2 DuoSet ELISA | R & D Systems | Cat#DY501-05 |
| Rat Lipocalin-2/NGAL DuoSet ELISA | R & D Systems | Cat#DY3508 |
| Anti-rat IgG HRP-conjugated | Jackson lab | Cat#112-035-003; RRID: AB_2338128 |
| Chemicals, Peptides, and Recombinant Proteins | ||
| (±)-1,3-Butanediol | Sigma-Aldrich | Cat#B84785 |
| Fluorescein isothiocyanate-dextran (4KDa) | Sigma-Aldrich | Cat#FD4 |
| Trizol reagent | Invitrogen | Cat#15596-026 |
| Lipopolysaccharide from E. coli 0128:B12 | Sigma-Aldrich | Cat#L2887 |
| Flagellin from Salmonella typhimurium (SLC3201, fljB-strain) | Ziegler et al., 2008 | N/A |
| Critical Commercial Assays | ||
| QuanTtest Red Total Protein Assay kit | Quantimetrix | Cat#2210-02 |
| βOHB Colorimetric Assay kit | Cayman Chemicals | Cat#700190 |
| QIAampPowerFecalDNA kit | QIAGEN | Cat#12830-50 |
| MiSeq Reagent Kit v3 | Illumina | Cat#MS-102-3003 |
| Nextera XT Index Kit | Illumina | Cat#FC-131-1002 |
| DuoSet ELISA Ancillary Reagent Kit 2 | R & D Systems | Cat#DY008 |
| VECTASTAIN Elite ABC HRP Kit (Peroxidase, Standard) | Vector Lab | Cat#PK-7200 |
| DAB Peroxidase (HRP) Substrate Kit (with Nickel), 3,3′-diaminobenzidine | Vector Lab | Cat#SK-4100 |
| Deposited Data | ||
| Raw and analyzed data | This paper | Mendeley Data. https://data.mendeley.com/datasets/4tt4hcmxr4/1 |
| Untargeted metabolomics data | This paper | Metabolics Workbench (study number: ST001051). http://dev.metabolomicsworkbench.org:22222/data/DRCCMetadata.php?Mode=Study&DataMode=ProjectData&StudyID=ST001051&StudyType=MS&ResultType=5#DataTabs |
| Experimental Models: Organisms/Strains | ||
| Dahl Salt sensitive rats/JR | University of Toledo | https://rgd.mcw.edu/rgdweb/report/strain/main.html?id=69369 |
| Oligonucleotides | ||
| See Table S2 for the primer sequences. | This paper | N/A |
| Software and Algorithms | ||
| Dataquest A.R.T. software v4.2 | Data Science Int. | https://www.datasci.com/ |
| USEARCH | Edgar, 2010 | https://www.drive5.com/usearch/ |
| QIIME software v1.9.1 | Caporaso et al., 2010 | http://qiime.org/ |
| LEfSe | Segata et al., 2011 | https://huttenhower.sph.harvard.edu/galaxy/ |
| PICRUSt | Langille et al., 2013 | http://picrust.github.io/picrust/ |
| HUMAnN | Abubucker et al., 2012 | http://huttenhower.sph.harvard.edu/humann |
| Greengenes | DeSantis et al., 2006 | http://greengenes.lbl.gov/Download/ |
| MetaboAnalyst | Xia et al., 2009 | http://www.metaboanalyst.ca/ |
| MassHunter Quantitative Analysis B.06.00 Service Pack 1 | Agilent | https://www.agilent.com/en/support/softwareinformatics/quant-b-0600-sp1 |
| GraphPad Prism v5.02 | GraphPad software | https://www.graphpad.com/ |
| Other | ||
| Harlan Teklad low salt diet | Envigo | Cat#TD7034 |
| Harlan Teklad high salt diet | Envigo | Cat#TD94217 |
| Radiotelemetry transmitters | Data Science Int. | PA-C10 |
| SpectraMax M3 | Molecular Devices | N/A |
| AU680 Chemistry Analyzer | Beckman Coulter | N/A |
| Nanodrop 2000 | Thermo Scientific | N/A |
| MiSeq system | Illumina | N/A |
| VS120 Virtual Slide Microscope | Olympus | N/A |
| Bioanalyzer | Agilent | N/A |
| Agilent 6410 triple quadrupole mass spectrometer | Agilent | N/A |
| Agilent 1290 infinity HPLC system with UPLC BEH C18 column | Agilent | N/A |
Highlights.
The liver contributes to blood pressure regulation via ketone body production
High salt diet reduces the ketone body beta-hydroxybutyrate (βOHB)
Reduced βOHB results in increased renal Nlrp3 inflammasome activity in hypertension
Nutritional intervention with the βOHB precursor 1,3-butanediol lowers hypertension
ACKNOWLEDGMENTS
All authors thank Dr. John P. Rapp, Emeritus Professor, University of Toledo, for blinded scoring of renal injury and Mr. Sifaat Muhtasham, Ms. Naveena Luke, and Mr. Anay Hindupur for technical assistance. This work was supported by institutional funding from the University of Toledo College of Medicine to the University of Toledo Microbiome Consortium. A.M. acknowledges support from the National Heart, Lung, and Blood Institute (K08HL130944). M.V.-K. acknowledges funding from NIH (RO1 CA219144). V.S. and P.S. are funded by fellowships from the Crohn’s and Colitis Foundation of America (CCFA).
Footnotes
DECLARATION OF INTERESTS
B.J. and S.C. have an interest in U.S. Patent Application serial no. 62/665,690 filed on May 2, 2018 in this paper regarding nutritional intervention for salt-sensitive hypertension for 1,3-butanediol. All other authors declare no competing interests.
SUPPLEMENTAL INFORMATION
Supplemental Information includes seven figures, two tables, and three data files and can be found with this article online at https://doi.org/10.1016/j.celrep.2018.09.058.
REFERENCES
- Abubucker S, Segata N, Goll J, Schubert AM, Izard J, Cantarel BL, Rodriguez-Mueller B, Zucker J, Thiagarajan M, Henrissat B, et al. (2012). Metabolic reconstruction for metagenomic data and its application to the human microbiome. PLoS Comput. Biol 8, e1002358. [DOI] [PMC free article] [PubMed] [Google Scholar]
- Anders HJ, Suarez-Alvarez B, Grigorescu M, Foresto-Neto O, Steiger S, Desai J, Marschner JA, Honarpisheh M, Shi C, Jordan J, et al. (2018). The macrophage phenotype and inflammasome component NLRP3 contributes to nephrocalcinosis-related chronic kidney disease independent from IL-1-mediated tissue injury. Kidney Int. 93, 656–669. [DOI] [PubMed] [Google Scholar]
- Arima S, Uto H, Ibusuki R, Kumamoto R, Tanoue S, Mawatari S, Oda K, Numata M, Fujita H, Oketani M, et al. (2014). Hypertension exacerbates liver injury and hepatic fibrosis induced by a choline-deficient L-amino aciddefined diet in rats. Int. J. Mol. Med 33, 68–76. [DOI] [PubMed] [Google Scholar]
- Bai M, Chen Y, Zhao M, Zhang Y, He JC, Huang S, Jia Z, and Zhang A (2017). NLRP3 inflammasome activation contributes to aldosteroneinduced podocyte injury. Am. J. Physiol. Renal Physiol 312, F556–F564. [DOI] [PubMed] [Google Scholar]
- Barbato JC, Koch LG, Darvish A, Cicila GT, Metting PJ, and Britton SL (1998). Spectrum of aerobic endurance running performance in eleven inbred strains of rats. J. Appl. Physiol. (1985) 85, 530–536. [DOI] [PubMed] [Google Scholar]
- Bomfim GF, Rodrigues FL, and Carneiro FS (2017). Are the innate and adaptive immune systems setting hypertension on fire? Pharmacol. Res 117, 377–393. [DOI] [PubMed] [Google Scholar]
- Brown IJ, Tzoulaki I, Candeias V, and Elliott P (2009). Salt intakes around the world: implications for public health. Int. J. Epidemiol 38, 791–813. [DOI] [PubMed] [Google Scholar]
- Bugyei-Twum A, Abadeh A, Thai K, Zhang Y, Mitchell M, Kabir G, and Connelly KA (2016). Suppression of NLRP3 inflammasome activation ameliorates chronic kidney disease-induced cardiac fibrosis and diastolic dysfunction. Sci. Rep 6, 39551. [DOI] [PMC free article] [PubMed] [Google Scholar]
- Caporaso JG, Kuczynski J, Stombaugh J, Bittinger K, Bushman FD, Costello EK, Fierer N, Peña AG, Goodrich JK, Gordon JI, et al. (2010). QIIME allows analysis of high-throughput community sequencing data. Nat. Methods 7, 335–336. [DOI] [PMC free article] [PubMed] [Google Scholar]
- Carpenter RG, and Grossman SP (1983). Plasma fat metabolites and hunger. Physiol. Behav 30, 57–63. [DOI] [PubMed] [Google Scholar]
- Collado MC, Isolauri E, Laitinen K, and Salminen S (2008). Distinct composition of gut microbiota during pregnancy in overweight and normalweight women. Am. J. Clin. Nutr 88, 894–899. [DOI] [PubMed] [Google Scholar]
- Cox PJ, Kirk T, Ashmore T, Willerton K, Evans R, Smith A, Murray AJ, Stubbs B, West J, McLure SW, et al. (2016). Nutritional ketosis alters fuel preference and thereby endurance performance in athletes. Cell Metab. 24, 256–268. [DOI] [PubMed] [Google Scholar]
- Dahl LK (1961). Effects of chronic excess salt feeding. Induction of self-sustaining hypertension in rats. J. Exp. Med 114, 231–236. [DOI] [PMC free article] [PubMed] [Google Scholar]
- Dahl LK, Heine M, and Tassinari L (1964). Effects of chronic excess salt ingestion. vascular reactivity in two strains of rats with opposite genetic susceptibility to experimental hypertension. Circulation 30 (Suppl 2), 11–22. [DOI] [PubMed] [Google Scholar]
- Dahl LK, Knudsen KD, and Iwai J (1970). Genetic influence of the kidney in hypertension-prone rats. Circ. Res 27 (Suppl 2), 277. [PubMed] [Google Scholar]
- De Miguel C, Das S, Lund H, and Mattson DL (2010). T lymphocytes mediate hypertension and kidney damage in Dahl salt-sensitive rats. Am. J. Physiol. Regul. Integr. Comp. Physiol 298, R1136–R1142. [DOI] [PMC free article] [PubMed] [Google Scholar]
- De Miguel C, Rudemiller NP, Abais JM, and Mattson DL (2015). Inflammation and hypertension: new understandings and potential therapeutic targets. Curr. Hypertens. Rep 17, 507. [DOI] [PMC free article] [PubMed] [Google Scholar]
- DeSantis TZ, Hugenholtz P, Larsen N, Rojas M, Brodie EL, Keller K, Huber T, Dalevi D, Hu P, and Andersen GL (2006). Greengenes, a chimera-checked 16S rRNA gene database and workbench compatible with ARB. Appl. Environ. Microbiol 72, 5069–5072. [DOI] [PMC free article] [PubMed] [Google Scholar]
- Dolinsky VW, Morton JS, Oka T, Robillard-Frayne I, Bagdan M, Lopaschuk GD, Des Rosiers C, Walsh K, Davidge ST, and Dyck JR (2010). Calorie restriction prevents hypertension and cardiac hypertrophy in the spontaneously hypertensive rat. Hypertension 56, 412–421. [DOI] [PubMed] [Google Scholar]
- Edgar RC (2010). Search and clustering orders of magnitude faster than BLAST. Bioinformatics 26, 2460–2461. [DOI] [PubMed] [Google Scholar]
- Evans M, Cogan KE, and Egan B (2017). Metabolism of ketone bodies during exercise and training: physiological basis for exogenous supplementation. J. Physiol 595, 2857–2871. [DOI] [PMC free article] [PubMed] [Google Scholar]
- Everard A, Belzer C, Geurts L, Ouwerkerk JP, Druart C, Bindels LB, Guiot Y, Derrien M, Muccioli GG, Delzenne NM, et al. (2013). Crosstalk between Akkermansia muciniphila and intestinal epithelium controls diet-induced obesity. Proc. Natl. Acad. Sci. USA 110, 9066–9071. [DOI] [PMC free article] [PubMed] [Google Scholar]
- Feldman N, Rotter-Maskowitz A, and Okun E (2015). DAMPs as mediators of sterile inflammation in aging-related pathologies. Ageing Res. Rev 24 (Pt A), 29–39. [DOI] [PubMed] [Google Scholar]
- Foresto-Neto O, Ávila VF, Arias SCA, Zambom FFF, Rempel LCT, Faustino VD, Machado FG, Malheiros DMAC, Abensur H, Camara NOS, et al. (2018). NLRP3 inflammasome inhibition ameliorates tubulointerstitial injury in the remnant kidney model. Lab. Invest. 98, 773–782. [DOI] [PubMed] [Google Scholar]
- Garrett MR, Dene H, and Rapp JP (2003). Time-course genetic analysis of albuminuria in Dahl salt-sensitive rats on low-salt diet. J. Am. Soc. Nephrol 14, 1175–1187. [DOI] [PubMed] [Google Scholar]
- Garrett MR, Joe B, and Yerga-Woolwine S (2006). Genetic linkage of urinary albumin excretion in Dahl salt-sensitive rats: influence of dietary salt and confirmation using congenic strains. Physiol. Genomics 25, 39–49. [DOI] [PubMed] [Google Scholar]
- Greene AS, Yu ZY, Roman RJ, and Cowley AW Jr. (1990). Role of blood volume expansion in Dahl rat model of hypertension. Am. J. Physiol 258, H508–H514. [DOI] [PubMed] [Google Scholar]
- Ha V, Sievenpiper JL, de Souza RJ, Chiavaroli L, Wang DD, Cozma AI, Mirrahimi A, Yu ME, Carleton AJ, Dibuono M, et al. (2012). Effect of fructose on blood pressure: a systematic review and meta-analysis of controlled feeding trials. Hypertension 59, 787–795. [DOI] [PubMed] [Google Scholar]
- Hall SE, Wastney ME, Bolton TM, Braaten JT, and Berman M (1984). Ketone body kinetics in humans: the effects of insulin-dependent diabetes, obesity, and starvation. J. Lipid Res 25, 1184–1194. [PubMed] [Google Scholar]
- Han J, Lin K, Sequeira C, and Borchers CH (2015). An isotope-labeled chemical derivatization method for the quantitation of short-chain fatty acids in human feces by liquid chromatography-tandem mass spectrometry. Anal. Chim. Acta 854, 86–94. [DOI] [PubMed] [Google Scholar]
- Hattori T, Murase T, Takatsu M, Nagasawa K, Matsuura N, Watanabe S, Murohara T, and Nagata K (2014). Dietary salt restriction improves cardiac and adipose tissue pathology independently of obesity in a rat model of metabolic syndrome. J. Am. Heart Assoc 3, e001312. [DOI] [PMC free article] [PubMed] [Google Scholar]
- Huang B, Cheng Y, Usa K, Liu Y, Baker MA, Mattson DL, He Y, Wang N, and Liang M (2016). Renal Tumor Necrosis Factor α Contributes to Hypertension in Dahl Salt-Sensitive Rats. Sci. Rep 6, 21960. [DOI] [PMC free article] [PubMed] [Google Scholar]
- Hutton HL, Ooi JD, Holdsworth SR, and Kitching AR (2016). The NLRP3 inflammasome in kidney disease and autoimmunity. Nephrology (Carlton) 21, 736–744. [DOI] [PubMed] [Google Scholar]
- Karlsson CL, Onnerfält J, Xu J, Molin G, Ahrné S, and Thorngren-Jerneck K (2012). The microbiota of the gut in preschool children with normal and excessive body weight. Obesity (Silver Spring) 20, 2257–2261. [DOI] [PubMed] [Google Scholar]
- Kersse K, Bertrand MJ, Lamkanfi M, and Vandenabeele P (2011). NODlike receptors and the innate immune system: coping with danger, damage and death. Cytokine Growth Factor Rev. 22, 257–276. [DOI] [PubMed] [Google Scholar]
- Kimura T, Hashimoto Y, Tanaka M, Asano M, Yamazaki M, Oda Y, Toda H, Marunaka Y, Nakamura N, and Fukui M (2016). Sodium-chloride difference and metabolic syndrome: a population-based large-scale cohort study. Intern. Med 55, 3085–3090. [DOI] [PMC free article] [PubMed] [Google Scholar]
- Kitada K, Daub S, Zhang Y, Klein JD, Nakano D, Pedchenko T, Lantier L, LaRocque LM, Marton A, Neubert P, et al. (2017). High salt intake reprioritizes osmolyte and energy metabolism for body fluid conservation. J. Clin. Invest 127, 1944–1959. [DOI] [PMC free article] [PubMed] [Google Scholar]
- Kumarasamy S, Gopalakrishnan K, Abdul-Majeed S, Partow-Navid R, Farms P, and Joe B (2013). Construction of two novel reciprocal conplastic rat strains and characterization of cardiac mitochondria. Am. J. Physiol. Heart Circ. Physiol 304, H22–H32. [DOI] [PMC free article] [PubMed] [Google Scholar]
- Lanaspa MA, Kuwabara M, Andres-Hernando A, Li N, Cicerchi C, Jensen T, Orlicky DJ, Roncal-Jimenez CA, Ishimoto T, Nakagawa T, et al. (2018). High salt intake causes leptin resistance and obesity in mice by stimulating endogenous fructose production and metabolism. Proc. Natl. Acad. Sci. USA 115, 3138–3143. [DOI] [PMC free article] [PubMed] [Google Scholar]
- Langille MG, Zaneveld J, Caporaso JG, McDonald D, Knights D, Reyes JA, Clemente JC, Burkepile DE, Vega Thurber RL, Knight R, et al. (2013). Predictive functional profiling of microbial communities using 16S rRNA marker gene sequences. Nat. Biotechnol 31, 814–821. [DOI] [PMC free article] [PubMed] [Google Scholar]
- Lemos DR, McMurdo M, Karaca G, Wilflingseder J, Leaf IA, Gupta N, Miyoshi T, Susa K, Johnson BG, Soliman K, et al. (2018). Interleukin-1b activates a MYC-dependent metabolic switch in kidney stromal cells necessary for progressive tubulointerstitial fibrosis. J. Am. Soc. Nephrol 29, 1690–1705. [DOI] [PMC free article] [PubMed] [Google Scholar]
- Livak KJ, and Schmittgen TD (2001). Analysis of relative gene expression data using real-time quantitative PCR and the 2(-Delta Delta C(T)) method. Methods 25, 402–408. [DOI] [PubMed] [Google Scholar]
- Maalouf M, Rho JM, and Mattson MP (2009). The neuroprotective properties of calorie restriction, the ketogenic diet, and ketone bodies. Brain Res. Brain Res. Rev 59, 293–315. [DOI] [PMC free article] [PubMed] [Google Scholar]
- Mahoney LB, Denny CA, and Seyfried TN (2006). Caloric restriction in C57BL/6J mice mimics therapeutic fasting in humans. Lipids Health Dis. 5, 13. [DOI] [PMC free article] [PubMed] [Google Scholar]
- Mattson DL (2014). Infiltrating immune cells in the kidney in salt-sensitive hypertension and renal injury. Am. J. Physiol. Renal Physiol 307, F499–F508. [DOI] [PMC free article] [PubMed] [Google Scholar]
- Mattson DL, James L, Berdan EA, and Meister CJ (2006). Immune suppression attenuates hypertension and renal disease in the Dahl salt-sensitive rat. Hypertension 48, 149–156. [DOI] [PubMed] [Google Scholar]
- Mell B, Jala VR, Mathew AV, Byun J, Waghulde H, Zhang Y, Haribabu B, Vijay-Kumar M, Pennathur S, and Joe B (2015). Evidence for a link between gut microbiota and hypertension in the Dahl rat. Physiol. Genomics 47, 187–197. [DOI] [PMC free article] [PubMed] [Google Scholar]
- Melo DS, Costa-Pereira LV, Santos CS, Mendes BF, Costa KB, Santos CF, Rocha-Vieira E, Magalhães FC, Esteves EA, Ferreira AJ, et al. (2016). Severe calorie restriction reduces cardiometabolic risk factors and protects rat hearts from ischemia/reperfusion injury. Front. Physiol 7, 106. [DOI] [PMC free article] [PubMed] [Google Scholar]
- Musso G, Gambino R, De Michieli F, Cassader M, Rizzetto M, Durazzo M, Fagà E, Silli B, and Pagano G (2003). Dietary habits and their relations to insulin resistance and postprandial lipemia in nonalcoholic steatohepatitis. Hepatology 37, 909–916. [DOI] [PubMed] [Google Scholar]
- Newman JC, and Verdin E (2014). β-hydroxybutyrate: much more than a metabolite. Diabetes Res. Clin. Pract 106, 173–181. [DOI] [PMC free article] [PubMed] [Google Scholar]
- Newman JC, and Verdin E (2017). β-hydroxybutyrate: a signaling metabolite. Annu. Rev. Nutr 37, 51–76. [DOI] [PMC free article] [PubMed] [Google Scholar]
- Padmanabhan S, and Joe B (2017). Towards precision medicine for hypertension: a review of genomic, epigenomic, and microbiomic effects on blood pressure in experimental rat models and humans. Physiol. Rev 97, 1469–1528. [DOI] [PMC free article] [PubMed] [Google Scholar]
- Paragas N, Qiu A, Zhang Q, Samstein B, Deng SX, Schmidt-Ott KM, Viltard M, Yu W, Forster CS, Gong G, et al. (2011). The Ngal reporter mouse detects the response of the kidney to injury in real time. Nat. Med 17, 216–222. [DOI] [PMC free article] [PubMed] [Google Scholar]
- Puchalska P, and Crawford PA (2017). Multi-dimensional Roles of Ketone Bodies in Fuel Metabolism, Signaling, and Therapeutics. Cell Metab. 25, 262–284. [DOI] [PMC free article] [PubMed] [Google Scholar]
- Rapp JP, and Dene H (1985). Development and characteristics of inbred strains of Dahl salt-sensitive and salt-resistant rats. Hypertension 7, 340–349. [PubMed] [Google Scholar]
- Rapp JP, Knudsen KD, Iwai J, and Dahl LK (1973). Genetic control of blood pressure and corticosteroid production in rats. Circ. Res 32 (Suppl 1), 139–149. [PubMed] [Google Scholar]
- Ringseis R, Eder K, Mooren FC, and Kru€ger K (2015). Metabolic signals and innate immune activation in obesity and exercise. Exerc. Immunol. Rev 21, 58–68. [PubMed] [Google Scholar]
- Roberts MN, Wallace MA, Tomilov AA, Zhou Z, Marcotte GR, Tran D, Perez G, Gutierrez-Casado E, Koike S, Knotts TA, et al. (2017). A ketogenic diet extends longevity and healthspan in adult mice. Cell Metab. 26, 539–546. [DOI] [PMC free article] [PubMed] [Google Scholar]
- Rossi R, Dörig S, Del Prete E, and Scharrer E (2000). Suppression of feed intake after parenteral administration of D-beta-hydroxybutyrate in pygmy goats. J. Vet. Med. A Physiol. Pathol. Clin. Med 47, 9–16. [DOI] [PubMed] [Google Scholar]
- Rudemiller N, Lund H, Jacob HJ, Geurts AM, and Mattson DL; PhysGen Knockout Program (2014). CD247 modulates blood pressure by altering T-lymphocyte infiltration in the kidney. Hypertension 63, 559–564. [DOI] [PMC free article] [PubMed] [Google Scholar]
- Santacruz A, Collado MC, García-Valdés L, Segura MT, Martín-Lagos JA, Anjos T, Martí-Romero M, Lopez RM, Florido J, Campoy C, and Sanz Y (2010). Gut microbiota composition is associated with body weight, weight gain and biochemical parameters in pregnant women. Br. J. Nutr 104, 83–92. [DOI] [PubMed] [Google Scholar]
- Savage CD, Lopez-Castejon G, Denes A, and Brough D (2012). NLRP3-inflammasome activating DAMPs stimulate an inflammatory response in glia in the absence of priming which contributes to brain inflammation after injury. Front. Immunol 3, 288. [DOI] [PMC free article] [PubMed] [Google Scholar]
- Schneeberger M, Everard A, Gómez-Valadés AG, Matamoros S, Ramírez S, Delzenne NM, Gomis R, Claret M, and Cani PD (2015). Akkermansia muciniphila inversely correlates with the onset of inflammation, altered adipose tissue metabolism and metabolic disorders during obesity in mice. Sci. Rep 5, 16643. [DOI] [PMC free article] [PubMed] [Google Scholar]
- Segata N, Izard J, Waldron L, Gevers D, Miropolsky L, Garrett WS, and Huttenhower C (2011). Metagenomic biomarker discovery and explanation. Genome Biol. 12, R60. [DOI] [PMC free article] [PubMed] [Google Scholar]
- Sepehri Z, Kiani Z, Afshari M, Kohan F, Dalvand A, and Ghavami S (2017). Inflammasomes and type 2 diabetes: An updated systematic review. Immunol. Lett 192, 97–103. [DOI] [PubMed] [Google Scholar]
- Stienstra R, van Diepen JA, Tack CJ, Zaki MH, van de Veerdonk FL, Perera D, Neale GA, Hooiveld GJ, Hijmans A, Vroegrijk I, et al. (2011). Inflammasome is a central player in the induction of obesity and insulin resistance. Proc. Natl. Acad. Sci. USA 108, 15324–15329. [DOI] [PMC free article] [PubMed] [Google Scholar]
- Sutton EF, Beyl R, Early KS, Cefalu WT, Ravussin E, and Peterson CM (2018). Early time-restricted feeding improves insulin sensitivity, blood pressure, and oxidative stress even without weight loss in men with prediabetes. Cell Metab. 27, 1212–1221. [DOI] [PMC free article] [PubMed] [Google Scholar]
- Theriot CM, Koenigsknecht MJ, Carlson PE Jr., Hatton GE, Nelson AM, Li B, Huffnagle GB, Z Li J, and Young VB (2014). Antibiotic-induced shifts in the mouse gut microbiome and metabolome increase susceptibility to Clostridium difficile infection. Nat. Commun 5, 3114. [DOI] [PMC free article] [PubMed] [Google Scholar]
- Tian N, Moore RS, Braddy S, Rose RA, Gu JW, Hughson MD, and Manning RD Jr. (2007). Interactions between oxidative stress and inflammation in salt-sensitive hypertension. Am. J. Physiol. Heart Circ. Physiol 293, H3388–H3395. [DOI] [PubMed] [Google Scholar]
- Uetake Y, Ikeda H, Irie R, Tejima K, Matsui H, Ogura S, Wang H, Mu S, Hirohama D, Ando K, et al. (2015). High-salt in addition to high-fat diet may enhance inflammation and fibrosis in liver steatosis induced by oxidative stress and dyslipidemia in mice. Lipids Health Dis. 14, 6. [DOI] [PMC free article] [PubMed] [Google Scholar]
- Vandanmagsar B, Youm YH, Ravussin A, Galgani JE, Stadler K, Mynatt RL, Ravussin E, Stephens JM, and Dixit VD (2011). The NLRP3 inflammasome instigates obesity-induced inflammation and insulin resistance. Nat. Med 17, 179–188. [DOI] [PMC free article] [PubMed] [Google Scholar]
- Veech RL, Bradshaw PC, Clarke K, Curtis W, Pawlosky R, and King MT (2017). Ketone bodies mimic the life span extending properties of caloric restriction. IUBMB Life 69, 305–314. [DOI] [PubMed] [Google Scholar]
- Vilaysane A, Chun J, Seamone ME, Wang W, Chin R, Hirota S, Li Y, Clark SA, Tschopp J, Trpkov K, et al. (2010). The NLRP3 inflammasome promotes renal inflammation and contributes to CKD. J. Am. Soc. Nephrol 21, 1732–1744. [DOI] [PMC free article] [PubMed] [Google Scholar]
- Wan Z, Wen W, Ren K, Zhou D, Liu J, Wu Y, Zhou J, Mu J, and Yuan Z (2018). Involvement of NLRP3 inflammasome in the impacts of sodium and potassium on insulin resistance in normotensive Asians. Br. J. Nutr 119, 228–237. [DOI] [PubMed] [Google Scholar]
- Wang G, Yeung CK, Wong WY, Zhang N, Wei YF, Zhang JL, Yan Y, Wong CY, Tang JJ, Chuai M, et al. (2016a). Liver fibrosis can be induced by high salt intake through excess reactive oxygen species (ROS) production. J. Agric. Food Chem 64, 1610–1617. [DOI] [PubMed] [Google Scholar]
- Wang Y, Xu Y, Sheng H, Ni X, and Lu J (2016b). Exercise amelioration of depression-like behavior in OVX mice is associated with suppression of NLRP3 inflammasome activation in hippocampus. Behav. Brain Res 307, 18–24. [DOI] [PubMed] [Google Scholar]
- Wang X, Liu Q, Zhou J, Wu X, and Zhu Q (2017). b hydroxybutyrate levels in serum and cerebrospinal fluid under ketone body metabolism in rats. Exp. Anim 66, 177–182. [DOI] [PMC free article] [PubMed] [Google Scholar]
- Wilck N, Matus MG, Kearney SM, Olesen SW, Forslund K, Bartolomaeus H, Haase S, Mähler A, Balogh A, Markó L, et al. (2017). Salt-responsive gut commensal modulates TH17 axis and disease. Nature 551, 585–589. [DOI] [PMC free article] [PubMed] [Google Scholar]
- Willner IR, Waters B, Patil SR, Reuben A, Morelli J, and Riely CA (2001). Ninety patients with nonalcoholic steatohepatitis: insulin resistance, familial tendency, and severity of disease. Am. J. Gastroenterol 96, 2957–2961. [DOI] [PubMed] [Google Scholar]
- World Health Organization (2003). Diet, nutrition and the prevention of chronic diseases. WHO Tech. Rep. Ser 916, 1–149. [PubMed] [Google Scholar]
- Wu C, Yosef N, Thalhamer T, Zhu C, Xiao S, Kishi Y, Regev A, and Kuchroo VK (2013). Induction of pathogenic TH17 cells by inducible salt-sensing kinase SGK1. Nature 496, 513–517. [DOI] [PMC free article] [PubMed] [Google Scholar]
- Xia J, Psychogios N, Young N, and Wishart DS (2009). MetaboAnalyst: a web server for metabolomic data analysis and interpretation. Nucleic Acids Res. 37, W652–60. [DOI] [PMC free article] [PubMed] [Google Scholar]
- Youm YH, Nguyen KY, Grant RW, Goldberg EL, Bodogai M, Kim D, D’Agostino D, Planavsky N, Lupfer C, Kanneganti TD, et al. (2015). The ketone metabolite β-hydroxybutyrate blocks NLRP3 inflammasome-mediated inflammatory disease. Nat. Med 21, 263–269. [DOI] [PMC free article] [PubMed] [Google Scholar]
- Yu J, Nagasu H, Murakami T, Hoang H, Broderick L, Hoffman HM, and Horng T (2014). Inflammasome activation leads to Caspase-1-dependent mitochondrial damage and block of mitophagy. Proc. Natl. Acad. Sci. USA 111, 15514–15519. [DOI] [PMC free article] [PubMed] [Google Scholar]
- Zhu Q, Li XX, Wang W, Hu J, Li PL, Conley S, and Li N (2016). Mesenchymal stem cell transplantation inhibited high salt-induced activation of the NLRP3 inflammasome in the renal medulla in Dahl S rats. Am. J. Physiol. Renal Physiol 310, F621–F627. [DOI] [PMC free article] [PubMed] [Google Scholar]
- Ziegler TR, Luo M, Estívariz CF, Moore DA 3rd, Sitaraman SV, Hao L, Bazargan N, Klapproth JM, Tian J, Galloway JR, et al. (2008). Detectable serum flagellin and lipopolysaccharide and upregulated anti-flagellin and lipopolysaccharide immunoglobulins in human short bowel syndrome. Am. J. Physiol. Regul. Integr. Comp. Physiol 294, R402–R410. [DOI] [PMC free article] [PubMed] [Google Scholar]
Associated Data
This section collects any data citations, data availability statements, or supplementary materials included in this article.
Supplementary Materials
Data Availability Statement
Data from untargeted metabolomics are reported in the Metabolomics Workbench and the study number is ST001051. (http://dev.metabolomicsworkbench.org:22222/data/DRCCMetadata.php?Mode=Study&DataMode=ProjectData&StudyID=ST001051&StudyType=MS&ResultType=5#DataTabs) The metabolomics profile is presented in the Data S1. The microbiotal profile of high salt and low salt fed animals is in Data S2. The microbiotal profile of high salt versus high salt plus 1,3-Butanediol fed animals is listed in Data S3. Raw and analyzed data are deposited with Mendeley Data at DOI: https://data.mendeley.com/datasets/4tt4hcmxr4/1.