Abstract
Occupational exposure to contaminants in agriculture and other industries is known to cause significant respiratory ailments. The effect of organic dust on lung inflammation and tissue remodeling has been actively investigated over many years but the adverse effect of organic dust-exposure on the central vital organ brain is beginning to emerge. Brain microglial cells are a major driver of neuroinflammation upon exposure to danger signals. Therefore, we tested a hypothesis that organic dust-exposure of microglial cells induces microglial cell activation and inflammation through HMGB1-RAGE signaling. Mouse microglial cells were exposed to organic dust extract showed a time-dependent increase in cytoplasmic translocation of high-mobility group box 1 (HMGB1) from the nucleus, increased expression of receptor for advanced glycation end products (RAGE) and activation of Iba1 as compared to control cells. Organic dust also induced reactive oxygen species generation, NF-κB activation, and proinflammatory cytokine release. To establish a functional relevance of HMGB1-RAGE activation in microglia-mediated neuroinflammation, we used both pharmacological and genetic approaches involving HMGB1 translocation inhibitor ethyl pyruvate (EP), anti-HMGB1 siRNA, and NOX-inhibitor mitoapocynin. Interestingly, EP effectively reduced HMGB1 nucleocytoplasmic translocation and RAGE expression along with reactive oxygen species (ROS) generation and TNF-α and IL-6 production but not NF-κB activation. HMGB1 knockdown by siRNA also reduced both ROS and reactive nitrogen species (RNS) and IL-6 levels but not TNF-α. NOX2 inhibitor mitoapocynin significantly reduced RNS levels. Collectively, our results demonstrate that organic dust activates HMGB1-RAGE signaling axis to induce a neuroinflammatory response in microglia and that attenuation of HMGB1-RAGE activation by EP and mitoapocynin treatments or genetic knockdown can dampen the neuroinflammation.
Keywords: organic dust, neuroinflammation, microglia, HMGB1, RAGE
Worldwide, agriculture employs about 1.3 billion people (International Labor Organization, 2018) and with significant mortalities, work-related injuries and negative health effects, it is considered as a dangerous profession (reviewed in Sethi et al., 2017). However, when compared to mining and other industries, occupational dangers in agriculture have received far less attention. In the USA alone, about 3.2 million farmers operate farms (United States Department of Agriculture, 2018) and are exposed to many on-site occupational contaminants. Among the agriculture production systems, people who work in concentrated animal feeding operations (CAFOs) working with pigs, dairy, poultry, duck hatcheries, and other large animal production facilities are exposed to the airborne organic dust (OD) and gases such methane, ammonia, and hydrogen sulfide (Iowa State University and University of Iowa, 2002). Exposed workers suffer from many respiratory and other symptoms and loss of lung function (reviewed in Sethi et al., 2017).
OD is a mixture of particulate matter of varying sizes, microbes, and microbial products such as lipopolysaccharide (LPS), peptidoglycan (PGN), and microbial DNA (Iowa State University and University of Iowa, 2002). Persistent exposure to OD is central to the respiratory symptoms and an annual decline in lung function in exposed farm workers. Several research groups have examined the mechanisms of respiratory inflammation using in vitro and in vivo (rat, mice, and human volunteers) models (Charavaryamath et al., 2005, 2008; Dosman et al., 2000). However, OD exposure effects on vital organs such as brain largely remain unknown.
Increased incidences of neurodegenerative diseases in the mid-western and north-eastern regions of the USA are documented (Wright Willis et al., 2010). Exposure to pesticides is a known risk factor for neuroinflammation driven neurodegenerative diseases. Further, intensive agriculture and animal production in the mid-western region of the USA prompted us to examine whether exposure to agriculture contaminants will cause neuroinflammation (Braun et al., 2017; Chin-Chan et al., 2015; Wright Willis et al., 2010). Among the contaminants from agriculture, OD contains significant levels of LPS (Charavaryamath et al., 2008) and PGN (Dusad et al., 2013) and LPS is known to cause neuroinflammation (Fu et al., 2014). However, the effects of inhalational exposure to OD on induction of neuroinflammation are largely unknown. OD contains multiple pathogen associated molecular patterns (PAMPs) (Iowa State University and University of Iowa, 2002) and published work shows involvement of multiple pattern recognition receptors and activation of overlapping signaling pathways in mediating OD-induced respiratory and systemic inflammatory effects (Charavaryamath et al., 2008; Nath Neerukonda et al., 2018; Poole et al., 2010; Schneberger et al., 2016; Staab et al., 2016). Thus, the complexity of host-response to OD makes therapeutic targeting of OD-induced inflammation challenging.
Damage associate molecular patterns (DAMPs) such as high-mobility group box 1 (HMGB1) are increasingly becoming important in many inflammatory conditions (Kang et al., 2014). HMGB1 (nucleosome protein) is a prototype DAMP, ubiquitously present in all nucleated cells. HMGB1 is known to undergo nucleocytoplasmic translocation and secretion into extra-cellular milieu under the influence of inflammagens. Extra-cellular HMGB1 behaves as a proinflammatory stimulus and potentiates inflammation along with other inflammatory stimuli. Although about 14 receptors have been identified so far, receptor for advanced glycation end products (RAGE) appears to be the main receptors for HMGB1 (Ugrinova and Pasheva, 2017). HMGB1 has been shown to be important in several inflammatory conditions such as asthma (Di Candia et al., 2017), ischemia-reperfusion injury (Liu et al., 2017), and neuroinflammation. Blocking HMGB1 with various approaches have been shown to be beneficial (Fonken et al., 2016; Musumeci et al., 2014). Ethyl pyruvate (EP), an aliphatic ester of pyruvic acid blocks phosphorylation of HMGB1 and chelates calcium ions resulting in the blockade of HMGB1 translocation and secretion (Shin et al., 2015). EP treatment has shown promising results in various models of inflammation (Ouyang et al., 2016). Delivery of anti-HMGB1 short interfering RNA (siRNA) is protective in brain infarct (Kim et al., 2012) and glucose induced retinal damage model (Jiang and Chen, 2017). Mitoapocynin (MA) is mitochondria targeted NOX2 inhibitor and an anti-oxidant. MA has been derived as an analog of neuroprotective molecule apocynin (4-hydroxy-3-methoxyacetophenone). Details of the preparation of MA and its neuroprotective properties are reviewed (Langley et al., 2017). Microglial cells of the brain are myeloid cells in lineage and are known for their central role in mounting an innate inflammatory response to danger signals (Saijo and Glass, 2011). In vitro models of microglial cells have been used to unravel mechanisms of neuroinflammation (Sarkar et al., 2017). Therefore, we tested a hypothesis that OD-exposure of microglial cells induces cell activation and inflammation through HMGB1-RAGE signaling.
In the current manuscript, we show that OD-exposure of microglia induces microglial activation, production of reactive species and inflammatory cytokines. OD exposure leads to nucleocytoplasmic translocation of HMGB1, contributing to increased cell activation and inflammation. Using EP or anti-HMGB1 siRNA treatment, we demonstrate that OD-induced microglial activation and inflammation could be abrogated via HMGB1-RAGE signaling. Using MA treatment, we evaluated if mitochondria could be targeted to reduce OD exposure-induced neuroinflammation.
MATERIALS AND METHODS
Chemicals and reagents
Dulbecco’s minimum essential medium (DMEM), fetal bovine serum (FBS), penicillin and streptomycin (PenStrep), L-glutamine, and trypsin-EDTA were purchased from Life Technologies (Carlsbad, California). LPS (Escherichia coli-O127: B8, Sigma; catalog No. L3129, 5 mg/ml stock) and PGN (from Staphylococcus aureus, Sigma; catalog No. 77140, 1 mg/ml stock) were purchased from (Sigma-Aldrich, St Louis, Missouri) and stored at −80°C. Poly-D-Lysine (Sigma, P6407) was prepared and stored as 0.5 mg/ml stock at −20°C. Mitoapocynin (MA) was procured from Dr Balaraman Kalyanaraman (Medical College of Wisconsin, Milwaukee, Wisconsin), stock solution (10 mM/l in DMSO) prepared by shaking vigorously and stored at −20°C. MA was used (10 µM/l) as one of the co-treatments (Table 1). EP working dilution (2.5 mM) was prepared in Ringer’s solution (Sigma). LPS and PGN were used as control PAMPs as outlined in Table 1.
Table 1.
Microglial Cell Treatments
| Treatment Groups | Pre-treatment | Co-treatment |
|---|---|---|
| Controla | None | Medium |
| ODE | None | ODE 1% v/v |
| ODE + EP | EP (2.5 mM for 35 min) | ODE 1% v/v + EP 2.5 mM |
| ODE + MA | None | ODE 1% v/v + MA 10 µM |
| LPS | None | 1 µg/ml |
| PGN | None | 10 µg/ml |
Control group samples were harvested at 0 h only. All other group samples were harvested at 6, 24, and 48 h.
Preparation of organic dust extract
All experiments were conducted in accordance with an approved protocol from the Institutional Biosafety Committee of the Iowa State University. Settled swine barn dust (representing OD) was collected from various swine production units into sealed bags with a desiccant and transported on ice to the laboratory. Organic dust extract (ODE) was prepared as per a published protocol (Romberger et al., 2002). Briefly, dust samples were weighed and for every gram of dust, 10 ml of Hanks’ balanced salt solution without calcium (Gibco) was added, stirred and allowed to stand at room temperature for 60 min. The mixture was centrifuged (1365 × g, 4°C) for 20 min, supernatant collected, and the pellet was discarded. The supernatant was centrifuged again with same conditions, pellet discarded and recovered supernatant was filtered using a 0.22 μm filter and stored at −80°C until used. This stock was considered 100% and diluted in cell culture medium to prepare a 1% v/v solution to use in our experiments (Table 1). LPS content of the ODE samples was analyzed using a commercial kit as per the instructions and results are included in another manuscript from our group (Bhat et al., 2019).
Cell culture and treatments
Mouse microglial cell line, derived from wild-type C57BL/6 mice (Halle et al., 2008) was a kind gift from Dr D. T. Golenbock (University of Massachusetts Medical School, Worcester, Massachusetts) to Dr A.G.K. Microglial cells were grown in T-75 flasks (1 × 10⁶ cells/flask), 12-well (75 × 103 cells/well), or 24-well (50 × 103 cells/well) tissue culture plates. The cells were on coverslips coated with 0.1 mg/ml Poly-D-Lysine for 12- or 24-well plates. Cells were grown in 96 well tissue culture plates (10 × 103 cells/well) for reactive oxygen species (ROS) and reactive nitrogen species (RNS) assays. Cells were maintained in DMEM supplemented with 10% heat inactivated FBS, 50 U/ml penicillin, 50 µg/ml streptomycin, and 2 mM L-glutamine and incubated overnight. All the treatment groups with pre-treatment and co-treatment details are outlined in Table 1. Control group samples were collected at 0 h because the control group samples from 6, 24, and 48 h time points did not show any differences in our pilot studies. In order to address the specific role of HMGB1, in separate experiments, cells were treated either with anti-HMGB1 or negative control (NC) siRNAs followed by either saline or ODE-exposure.
siRNA-mediated knockdown of HMGB1
Three (R1, R2, and R3) custom designed Dicer-substrate anti-HMGB1 siRNAs (DsiRNA), scrambled RNA (negative control, NC), HPRT1 DsiRNA (positive control), and a fluorescent transfection control (TYE563) were purchased from Integrated DNA Technologies Inc. (Coralville, Iowa) to maximize the probability of achieving successful HMGB1 knockdown. Lipofectamine 2000 (ThermoFisher) was employed to transfect DsiRNA into the microglia. Sequences of siRNAs and NC siRNA are listed in Table 2.
Table 2.
Anti HMGB1 and Control DsiRNAs Sequences
| Gene | siRNA | Sequences |
|---|---|---|
| HMGB1 | DsiRNA-1(R1) | Sense 5’-CCUUUAUGAAUCAGAUACAAGAGGA-3’Antisense 5’-UCCUCUUGUAUCUGAUUCAUAAAGGGA -3’ |
| DsiRNA-2(R2) | Sense 5’-GAUGCAGCUUAUACGAAGAUAAUTG-3’Antisense 5’-CAAUUAUCUUCGUAUAAGCUGCAUCAG -3’ | |
| DsiRNA-3(R3) | Sense 5’-GGAAAAUCAACUAAACAUGGGCAAA-3’Antisense 5’-UUUGCCCAUGUUUAGUUGAUUUUCCUC -3’ | |
| Negative control | DsiRNA(NC) | Sense 5’-CGUUAAUCGCGUAUAAUACGCGUATAntisense 5’-AUACGCGUAUUAUACGCGAUUAACGAC-’3 |
To perform transfection with various siRNAs, microglia were cultured a day before in DMEM without antibiotics and FBS. For each transfection, 20 µM of (DsiRNA) for HMGB1, scrambled RNA (negative control), HPRT1 DsiRNA (positive control) ,and a fluorescent transfection control (TYE563) were diluted in Opti-MEM media without antibiotics and FBS to 10 nM and gently mixed with Lipofectamine 2000 according to the manufacturer’s protocol. Following incubation for 20 min at room temperature, the transfection mixture was added to the cells, transfected cells were further incubated at 37°C for 24 and 48 h and knockdown was confirmed by qRT-PCR and Western blot analysis of the target gene and protein respectively. Transfection was confirmed by performing immunocytochemistry (ICC) for TYE563 (fluorescent transfection control).
qRT-PCR
RNA was isolated using TRIzol (Thermo Fisher Scientific) extraction methods as per manufacturer’s guidelines. Following cell treatments (Table 1), RNA concentration was measured using NanoDrop. One microgram of RNA was used to synthesize cDNA using the superscript IV VILO Kit (ThermoFisher Scientific, Waltham, Massachusetts) as per the manufacturer’s protocol. For qRT-PCR, 5 µl of SYBR Green Mastermix (Qiagen Cat No.208056), 0.5 µl of forward and reverse primers each, 3 µl of nuclease free-water, and 1 µl of cDNA were used. The following genes were used for qRT-PCR: HMGB1 (primer sequences: forward-TGG CAAAGGCTGACAAGGCTC, and reverse-GGATGCTCGCCTTTGATTTTGG and HPRT1 (primer sequences: forward-GCCTAAGATGAGCGCAAGTTG, and reverse-TACTAGGCAGATGGCCACAGG). All primer sequences were synthesized at Iowa State University’s DNA Facility. The housekeeping gene 18S rRNA (Thermo Fisher Scientific) was used in all qRT-PCR experiments. No-template controls and dissociation curves were run for all experiments to exclude cross-contamination.
Immunocytochemistry
Cells were grown in 12 well tissue culture plates (75 × 105 cells/well) on 18 mm coverslips coated with 0.1mg/ml Poly-D-Lysine. Cells were maintained in Dulbecco’s Modified Eagle’s Medium (DMEM, Thermo Fisher Scientific) supplemented with 10% heat inactivated FBS, 50 U/ml of penicillin, 50 µg/ml of streptomycin, and 2 mM L-glutamine and incubated overnight. Cells were treated as outlined in Table 1 and processed for immunofluorescence at 0, 6, 24, and 48 h following fixation with 4% paraformaldehyde in PBS (20 min at room temperature). Next, cells were blocked for an hour in blocking solution containing 10% normal donkey serum (EMD Millipore, Burlington, Massachusetts), 0.2% trition X 100 and PBS. Cells on cover slips were incubated with anti- HMGB1(1:1000, mouse monoclonal; Abcam, ab190377), anti-RAGE (1:250, rabbit polyclonal; Abcam, ab3611), anti-gp91 phox (indirect marker and a source of ROS, 1:500, Abcam; ab80508), anti Iba1(1:250, Abcam; ab5076) anti-3NT (marker for RNS, 1:500, Abcam; ab61392), Anti-NF-κB p65 (1:1000, Abcam; ab16502), and anti-CD14 (1:500, rabbit polyclonal, Abcam; ab182032) antibodies in antibody diluent solution (2.5% normal donkey serum, 0.25% sodium azide, 0.2% trition X 100 and PBS, Abcam, Cambridge, Massachusetts) overnight at 4°C. Next, coverslips were stained with secondary antibodies (Table 3, Jackson Immunoresearch, West Grove, Pennsylvania) for an hour at room temperature followed by mounting with VECTASHIELD antifade mounting medium containing 4', 6-Diamidino-2-Phenylindole, Dihydrochloride (DAPI, Vector Labs, Burlingame, California) on glass sides.
Table 3.
Secondary Antibodies Used in ICC
| Primary Target | Secondary Antibody | Source and Catalog Number |
|---|---|---|
| HMGB1 (Mouse Maba) | Anti-mouse (cy3 conjugated) raised in donkey | Jackson Immunoresearch 711-165-150 |
| RAGE (Rabbit Pabb) | Anti-rabbit (FITC conjugated) raised in donkey | Jackson Immunoresearch 711-095-152 |
| Iba1 (Goat Pab) | Anti-Goat (FITC conjugated) raised donkey | Jackson Immunoresearch 705-095-147 |
| Gp91 phox (ROS) (Rabbit Pab) | Anti-rabbit (cy3 conjugated) raised in donkey | Jackson Immunoresearch 711-165-152 |
| 3-NT (RNS) (Mouse Mab) | Anti-mouse (cy3 conjugated) raised in donkey | Jackson Immunoresearch 711-165-150 |
| CD-14 anti-rabbit | Anti-rabbit (cy3 conjugated) raised in donkey | Jackson Immunoresearch 016-160-084 |
Mab: monoclonal antibody; bPab: polyclonal antibody.
Quantification of HMGB1 and NF-κB translocation
ICC stained slides were viewed and photographed (Nikon Eclipse TE2000-U, Photometrics Cool Snap cf, HCImage). Five randomly selected fields were chosen and all the cells were counted using ImageJ (National Institutes of Health). Within these fields, the number of cells showing nucleocytoplasmic translocation (HMGB1) or cytoplasm to the nucleus (NF-κB p65) were counted manually using DAPI stained nuclei as a reference. The fraction of total cells showing translocation and the percentage was calculated, analyzed, and plotted.
Quantification of ICC staining intensity of RAGE, gp91 phox, 3-NT, and Iba1
Five fields per slide were chosen randomly and total stained cells were counted (ImageJ). Then, total staining intensity per field (cy3 or FITC) was measured using a software (HC Image, Hamamatsu Corp, Sewickley, Pennsylvania). Total field’s intensity (cy3 or FITC) was divided by the number of cells per field to obtain mean intensity (cy3 or FITC) per cell.
Western blot analysis
Cells were grown in T-75 flasks (1 × 10⁶ cells per flask), incubated overnight at 37°C with 5% CO2. Following pre- and co-treatments as outlined in Table 1, cells were treated with 0.5% trypsin for 15 min at 37°C and then re-suspended in equal volumes of DMEM and 10% FBS. Nuclear and cytoplasmic fractions were separated using NE-PER kit (Thermo Fisher Scientific). The supernatant media was collected, and total protein was precipitated with chloroform and ethanol. Equal amounts of protein (20 μg/well) or total protein were loaded for nuclear/cytoplasmic or supernatant fraction respectively and separated on 10% SDS-PAGE gels (Bio-Rad). Next, proteins were transferred to a nitrocellulose membrane and the nonspecific binding sites were blocked for an hour with a blocking buffer specifically formulated for fluorescent western blotting (Rockland Immunochemicals, Pottstown, Pennsylvania). Membranes incubated overnight at 4°C with the respective primary antibodies namely, HMGB1 (1:1000, mouse monoclonal; Abcam; ab79823), RAGE (1: 250, rabbit polyclonal; Abcam), Anti-NF-κB p65 (1:1000, Abcam; ab16502), Lamin-B1 (1:1000, Abcam; 16048), and β-actin (1:5000, Abcam; ab6276 or ab8227). Next, membranes were incubated with secondary donkey anti-rabbit IgG highly cross-adsorbed (A10043) or anti-mouse 680 Alexa Fluor antibodies (A21058, Thermo Fisher Scientific). Then membranes were washed 3 times with PBS containing 0.05% Tween-20 and visualized on the Odyssey infrared imaging system. Using Lamin-B1 (nuclear) or β-actin (cytoplasmic and whole cell lysate) as a loading control, band densities were normalized and densitometry was performed (ImageJ).
Intracellular ROS detection
Reactive oxygen species production was quantified by the ROS-sensitive dye chloromethyl derivative of dichlorodihydrofluorescein diacetate (DCFDA, Thermo Fisher Scientific). Cells were incubated with 25 µM (CM-H2DCFDA) in HBSS containing 2% FBS and incubated at 37°C and 5% CO2 for 45 min before further treatment with either media or ODE. Cells were washed with PBS and fluorescence intensity of the oxidized form of H2DCFDA was measured using excitation/emission wavelengths of 488/535 nm using a microplate reader (SpectraMax M2 Gemini Molecular Device). The fluorescence value from the control groups was subtracted as background and the results were expressed as percentage fluorescence relative to control to indicate intracellular ROS values.
Reactive nitrogen species detection in the supernatants
We employed colorimetric quantification of nitrite production by microglial cells using Griess reagent (Sigma-Adrich). Nitrite production was measured as a readout of RNS production by microglia. The supernatant was collected from each treatment after 0, 6, 24, and 36 h and Griess reagent was added to 50 µl of supernatant samples in a 98-well plate (1:1) and incubated at room temperature for 10 min until color development. A standard nitrite curve was made from sodium nitrite to determine nitrite concentrations. Change in color was analyzed by measuring absorbance at 540 nm using Spectramax M2 (Molecular devices) microplate reader. The values were expressed in µM and data were analyzed by using GraphPad Prism software.
Cytokine analysis by ELISA
Cells (5 × 10⁴/well) were seeded in a 24-well plate and allowed to attach overnight. Next, pre-treatments and co-treatments (Table 1) or siRNA-mediated knockdown of HMGB1 gene was performed and cell culture supernatants were collected and stored in −80°C. Later, TNF-α, IL-6, IL-10, and TGF-β1 levels were determined using ELISA kits (Invitrogen) by employing manufacturer’s recommended protocols. For siRNA experiments, only TNF-α and IL-6 were measured in the supernatants.
Statistical analysis
Data were expressed as mean ± SEM and analyzed by one-way or two-way ANOVA followed by Bonferroni’s post hoc comparison tests (GraphPad Prism 5.0, La Jolla, California). A p-value of < .05 was considered statistically significant. An asterisk (*) indicates a significant difference between controls and ODE-treated cells whereas hashtag (#) indicates either EP or MA treatment or siRNA-mediated HMGB1 knockdown effect. The p-values (Figs. 1–11 and legends) corresponding to asterisk/s or hashtag/s are listed in Table 4.
Figure 1.
Ethyl pyruvate (EP) and mitoapocynin (MA) reduce organic dust extract (ODE)-exposure induced Iba1 expression. Cells exposed to media (control) or lipopolysaccharide (LPS) or peptidoglycan (PGN) or ODE followed by either vehicle or EP or MA were stained for Iba1 (microglial activation marker). A, Compared to controls, ODE-exposed cells showed higher amounts of Iba1 staining at 6, 24, and 48 h (upper panel, A). Compared to vehicle, both EP- and MA-treatment reduced the ODE-induced increase in Iba1 staining at 6, 24, and 48 h (B, middle and C, lower panel respectively). Immunocytochemistry data for LPS and PGN are not shown and micrometer bar = 20 µm. B and C, Mean intensity of Iba1 staining was measured using HCImage software. B, Compared to control, LPS or PGN or ODE-exposure resulted in increased staining intensity for Iba1 at 6 (LPS alone), 24, and 48 h (LPS, PGN, and ODE). Compared to controls, EP treatment significantly reduced the staining intensity for Iba1 at 6 (LPS), 24, and 48 h for LPS, PGN and ODE. C, Compared to control, LPS or PGN or ODE-exposure resulted in increased staining intensity for Iba1 at 6, 24, and 48 h. Compared to controls, MA treatment significantly reduced the staining intensity for Iba1 at 6 and 24 (LPS, PGN and ODE) and 48 h (PGN and ODE respectively).
Table 4.
Symbols (Asterisk or Hashtag) and Corresponding p-Values
| Symbol | p-value |
|---|---|
| * or # | ≤.05 |
| ** or ## | ≤.01 |
| *** or ### | ≤.001 |
| **** or #### | ≤.0001 |
RESULTS
ODE-Exposure and Microglial Activation
Immunohistochemical expression of Iba1 marker (representing microglial activation) in control (medium treated) and ODE treated cells is shown in Figure 1A and ICC data for LPS and PGN are not shown. Quantification of ICC data showed that, compared to controls, LPS, PGN, and ODE increased the expression of Iba1 at 6, 24, and 48 h (Figs. 1B and 1C). EP treatment significantly decreased the LPS (6, 24, and 48 h), PGN and ODE (24 and 48 h) induced increases in Iba1 expression (Figure 1B). MA treatment also significantly decreased the LPS (6 and 24 h), PGN and ODE (6, 24, and 48 h) induced increases in Iba1 expression (Figure 1C).
ODE, LPS and PGN Exposure of Microglial Cells and Production of RNS
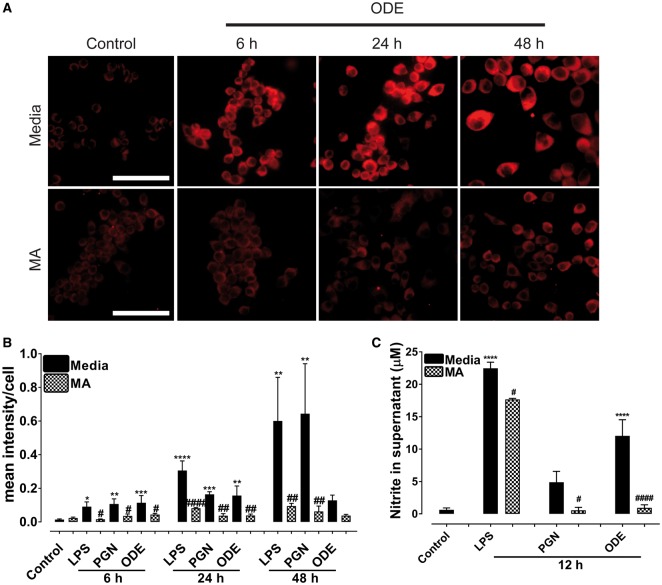
Immunohistochemical expression of 3-NT (indirect marker for RNS) in control (medium treated) and ODE treated cells is shown (Figure 2A) and ICC data for LPS and PGN are not shown. Quantification of ICC data showed that, compared to controls, LPS, PGN increased the expression of 3-NT (RNS) at 6, 24, and 48 h whereas ODE increased the expression of 3-NT (RNS) at 6 and 24 h only. MA treatment significantly decreased 3-NT (RNS) levels at 6, 24, and 48 h (LPS and PGN induced) and at 6 and 24 h (ODE-induced 3-NT, Figure 2B). Griess assay performed on cell culture supernatants showed that, compared to controls, LPS and ODE increased the secretion of nitrite (RNS) levels at 12 h whereas MA treatment significantly decreased the nitrite production (Figure 2C).
Figure 2.
Mitoapocynin (MA) treatment reduces organic dust extract (ODE)-exposure induced reactive nitrogen specie (RNS) production. Cells exposed to media (control) or ODE were stained for 3-NT (RNS). A, Compared to controls, ODE-exposed cells showed higher amounts of 3-NT staining (RNS) at 6, 24, and 48 h (upper panel). Compared to vehicle, MA treatment reduced ODE-induced increase in 3-NT (RNS) staining at 6, 24, and 48 h (lower panel). Immunocytochemistry data for LPS and PGN are not shown and micrometer bar = 20 µm. B, Mean intensity of 3-NT staining was measured and compared to control, LPS (6, 24, and 48 h) or PGN (6, 24, and 48 h) or ODE (6 and 24 h) exposure increased the staining intensity for 3-NT. Compared to controls, MA treatment significantly reduced the staining intensity for 3-NT at 6, 24, and 48 h for LPS and PGN but not ODE at 48 h. C, Griess assay was performed to measure nitrite levels as a readout of secreted RNS levels at 12 h. Compared to controls, LPS and ODE-exposure increased the secretion of RNS. Compared to vehicle, MA treatment significantly decreased nitrite levels at 12 h.
ODE, LPS, and PGN Exposure of Microglial Cells and Expression of ROS
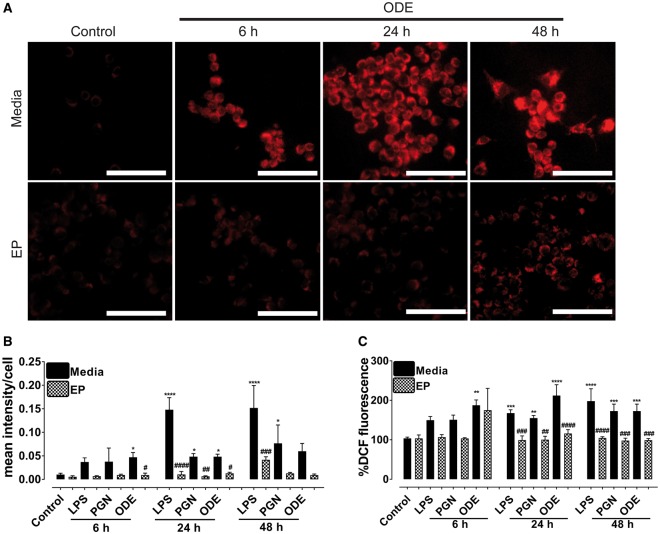
Immunohistochemical expression of gp91 phox (representing ROS) in control (medium treated) and ODE treated cells is shown (Figure 3A) and ICC data for LPS and PGN are not shown. Quantification of ICC data showed that, compared to controls, LPS (24 and 48 h), PGN (24 and 48 h), and ODE (6 and 24 h) increased the expression of gp91 phox (ROS) whereas EP treatment significantly decreased the LPS (24 and 48 h), PGN (24 h), and ODE (6 and 24 h) induced increases in gp91 phox (representing ROS) (Figure 3B). DCF assay performed using cultured cells showed that, compared to controls, LPS (24 and 48 h), PGN (24 and 48 h), and ODE (6, 24, and 48 h) treatment increased the expression of intracellular ROS whereas EP treatment significantly decreased the ROS production at 24 and 48 h (LPS, PGN, and ODE, Figure 3C).
Figure 3.
Ethyl pyruvate (EP) reduces organic dust extract (ODE)-exposure induced reactive oxygen species (ROS) production. Cells exposed to media (control) or ODE were stained for gp91 phox (source of ROS). A, Compared to controls, ODE-exposed cells appear to contain higher amounts of gp91 phox (source of ROS) at 6 and 24 h (upper panel, A). Compared to vehicle, EP treatment reduced ODE-induced increase in gp91 phox (ROS) staining at 6 and 24 h (lower panel, B). Immunocytochemistry data for LPS and PGN are not shown and micrometer bar = 20 µm. B, Mean intensity of gp91 phox staining was measured using HCImage software. Compared to control, LPS (24 and 48 h) or PGN (24 and 48 h) or ODE (6 and 24 h) exposure resulted in increased staining intensity for gp91 phox. Compared to controls, EP treatment significantly reduced the staining intensity for gp91 phox at 6 h (#, p < .05, ODE), 24 h (LPS, PGN, and ODE), and 48 h (LPS). C, Dichlorodihydrofluorescein diacetate (DCFDA) assay was performed to measure DCF fluorescence as a readout of secreted ROS levels at 6, 24, and 48 h. Compared to controls, LPS, PGN, and ODE-exposure increased the secretion of ROS. Compared to vehicle, EP treatment significantly decreased ROS levels at 24 and 48 h for LPS, PGN, and ODE.
Nucleocytoplasmic Translocation, Secretion of HMGB1 and Expression of RAGE
Our ICC data authenticated that mouse microglial cells expressed CD-14 marker and morphologically appeared to be typical microglial cells (images not shown). Next, we performed ICC to stain for HMGB1, RAGE, and DAPI staining to identify the nucleus. Individual and merged images were used to identify nucleocytoplasmic translocation of HMGB1.
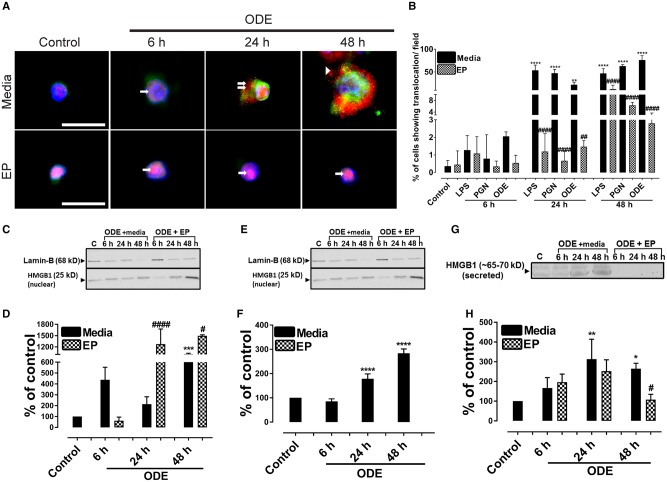
Compared to controls, ODE-treated cells showed a nucleocytoplasmic translocation and extra-cellular secretion of HMGB1. Co-treatment with EP reduced the ODE-induced nucleocytoplasmic translocation and secretion into the supernatant (Figure 4A, data not shown for LPS or PGN). Compared to media exposed control cells, ODE or LPS or PGN treated cells showed a significantly higher percentage of cells showing HMGB1 translocation per ×20 microscopic field (Figure 4B) whereas co-treatment with EP abrogated the same at 24 and 48 h.
Figure 4.
Ethyl pyruvate (EP) reduces organic dust extract (ODE)-induced high-mobility group box 1 (HMGB1) nucleocytoplasmic translocation. Cells treated medium (control) or lipopolysaccharide (LPS), peptidoglycan (PGN), and ODE followed by either vehicle (Ringer’s solution) or EP were stained with anti-HMGB1 (Cy3, red) and anti-RAGE (receptor for advanced glycation end products; FITC, green) antibodies and nuclei were identified with DAPI (blue). Data for LPS and PGN treated cells are not shown here. A, Compared to media treated control cells (0 h), ODE (1%) treated cells at early time point showed HMGB1 expression (cy3, red) restricted to the nucleus (6 h, arrow, upper panel). Compared to control and ODE (6 h) treated cells, ODE-treated cells at later time points (24 and 48 h) show nucleocytoplasmic translocation (double arrows) and secretion into extra-cellular space (48 h, arrow head). EP treatment (lower panel, A) reduces ODE-induced nucleocytoplasmic translocation and secretion of HMGB1 into extra-cellular space. With EP treatment HMGB1 expression mostly remains in the nucleus (arrows, lower panel, A). Micrometer bar = 20 µm. B, Compared to controls, LPS, PGN, and ODE-treated cells showed significantly higher HMGB1 translocation (24 and 48 h). Compared to medium, EP treatment significantly reduced HMGB1 translocation (24 and 48 h). C–H, Cell culture supernatants, cytoplasmic, and nuclear fractions from control and ODE-treated cells were processed for western blotting analysis to quantify HMGB1 and loading control proteins. β-Actin served as a loading control for cell culture supernatant and cytoplasmic fractions whereas Lamin-B1 served as a control for nuclear fraction. Densitometry and statistical data analysis were performed on normalized bands (n = 4). C–D, Compared to controls, nuclear fractions from ODE treated cells contained higher levels of HMGB1 protein. Following EP treatments, the amount of HMGB1 protein in the nuclear fractions increased at 24 and 48 h. E–F, Compared to controls, ODE treated cells showed higher levels of HMGB1 in the cytoplasmic fractions. Compared to Ringer’s solution (vehicle), EP treatment significantly reduced the HMGB1 levels at 48 h. G–H, Compared to controls, ODE-exposure significantly increased the secretion of HMGB1 into cell culture supernatant at 24 and 48 h. Compared to Ringer’s solution, EP treatment significantly reduced the HMGB1 levels (below detection limit) at 6, 24, and 48 h.
Next, we performed western blotting on nuclear, cytoplasmic and cell culture supernatant fractions of control, and ODE-treated cells. Compared to medium, ODE treatment increased the levels of HMGB1 protein in the nucleus at 48 h whereas EP treatment increased the HMGB1 levels in the nucleus at 24 and 48 h (Figs. 4C and 4D). In cytoplasmic fractions, compared to controls, ODE treatment significantly increased the HMGB1 levels at 24 and 48 h. EP treatment significantly decreased the HMGB1 levels at 48 h (Figs. 4E and 4F). Next, compared to medium, ODE treated cells secreted increased amounts of HMGB1 at 24 and 48 h. Amount of HMGB1 secreted by EP treated cells was below the detection limit of western blotting (Figs. 4G and 4H).
ODE, LPS, and PGN Exposure of Microglial Cells and Expression of RAGE
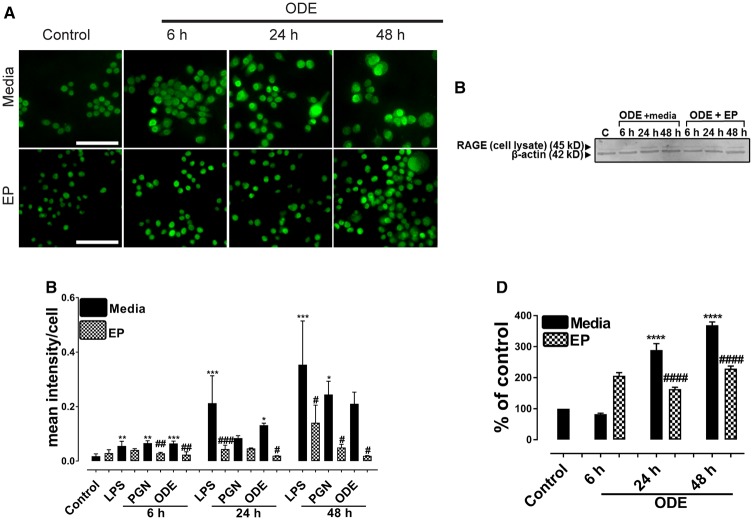
Immunohistochemical expression of RAGE in control (medium treated) and ODE-treated cells is shown (Figure 5A) and ICC data for LPS and PGN are not shown. Quantification of ICC data showed that, compared to controls, LPS (6, 24, and 48 h), PGN (6 and 48 h), and ODE (6 and 24 h) increased the expression of RAGE. EP treatment significantly decreased the LPS (24 and 48 h), PGN (6 and 48 h), and ODE (6, 24, and 48 h) induced increases in RAGE expression (Figure 5B). Western blotting on cell lysates showed that, compared to controls, ODE increased the expression of RAGE at 24 and 48 h whereas EP treatment significantly decreased the same (Figure 5C).
Figure 5.
Ethyl pyruvate (EP) treatment reduces organic dust extract (ODE)-exposure induced increase in receptor for advanced glycation end products (RAGE) expression. Cells treated with medium (control) or LPS, PGN, and ODE followed by either vehicle (medium) or EP were stained with anti-RAGE (FITC, green) antibody. A, Compared to medium, ODE-exposed cells showed an increase in RAGE expression at 6, 24, and 48 h (A, upper panel). Compared vehicle (medium), treatment with EP reduced the expression of RAGE at 6, 24, and 48 h (A, lower panel). Immunocytochemistry data for LPS and PGN are not shown and micrometer bar = 20 µm. B, The mean intensity of staining for RAGE was measured using (HCImage software). Compared to controls, LPS or PGN or ODE-exposed cells showed an increase in RAGE staining intensity at 6, 24, and 48 h. Compared to vehicle, EP treatment reduced the RAGE staining intensity. C–D, Western blotting was performed on cell lysates using anti-RAGE and anti-β-actin (loading control) antibodies. Densitometry and statistical analysis of normalized bands was conducted. Compared to controls ODE-exposed cells showed an increase in the expression of RAGE at 24 and 48 h. Compared to the vehicle (medium), EP treatment significantly reduced the expression of RAGE at 24 and 48 h (n = 4, A–D).
ODE-Exposure of Microglia Results in Nuclear Translocation of NF-κB p65
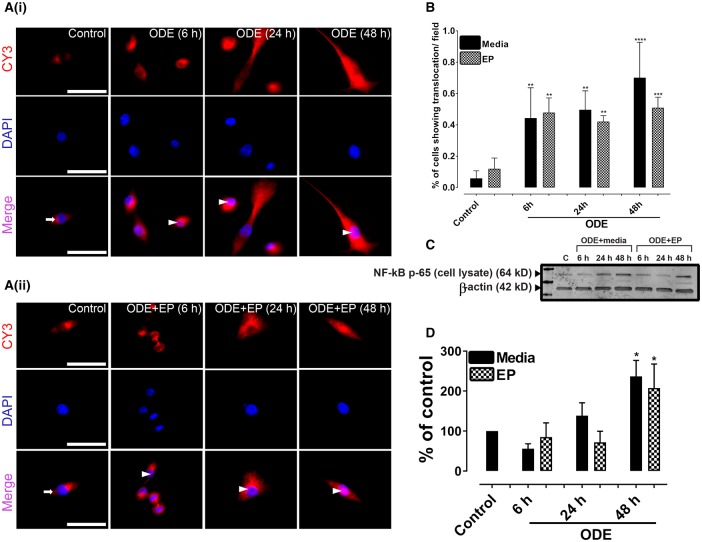
Immunohistochemical staining for anti-NF-κB p65 and DAPI revealed that, compared to controls, ODE-exposed cells showed nuclear translocation of NF-κB p65 (Figure 6A). Quantification of ICC data reveled that, compared to controls, ODE-exposed cells showed significantly higher nuclear translocation of NF-κB p65 and EP treatment did not have any impact on NF-κB p65 translocation (Figure 6B). Western blotting data on whole cell lysates indicated that, compared to controls, ODE-exposed cells contained higher amounts of NF-κB p65 at 48 h and EP treatment had no effect on NF-κB p65 levels (Figs. 6C and 6D).
Figure 6.
Organic dust extract (ODE)-exposure results in nuclear translocation of NF-κB p65. Cells exposed to media (control) or lipopolysaccharide (LPS) or peptidoglycan (PGN) or ODE were stained with anti-NF-κB p65 antibody (cy3) and DAPI staining to identify nuclei. A, Compared to controls (cytoplasmic NF-κB, white arrows), ODE-exposed cells showed nuclear translocation of NF-κB p65 at 6, 24, and 48 h (white arrowheads, lower panel in A (i)). Neither vehicle or nor EP had any significant effect on nuclear translocation of NF-κB p65 (lower panel of A (ii)). Immunocytochemistry data for LPS and PGN are not shown and micrometer bar = 20 µm. C and D, Western blot analysis on whole cell lysate using anti-κB p65 and anti-β-actin (loading control) was performed. Densitometry and statistical analysis of normalized band intensities indicated that, compared to controls, ODE-exposed cells showed an increase in NF-κB levels at 48 h. Neither vehicle nor EP treatment had any significant effect on NF-κB levels.
ODE-Exposure of Microglia and Cytokine Secretion
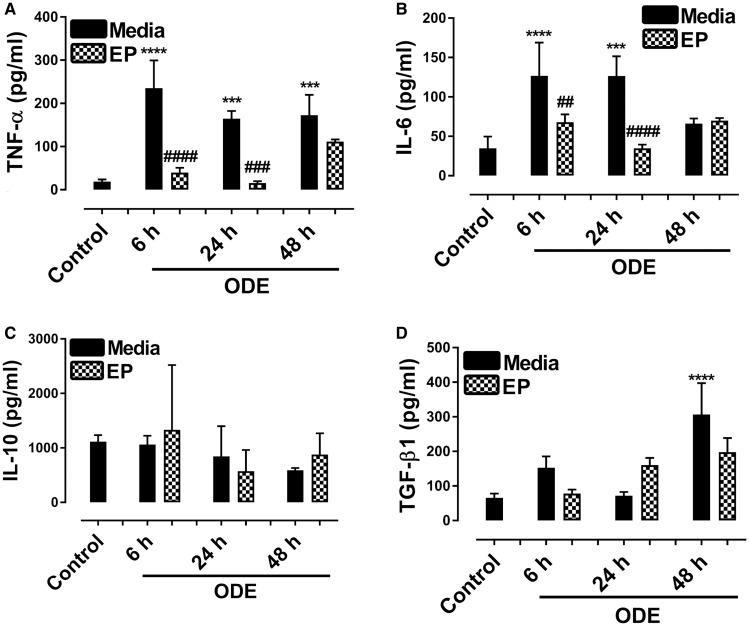
Culture supernatants from control and ODE-exposed cells showed an increase in TNF-α levels (6, 24, and 48 h) and EP treatment significantly decreased the ODE-induced TNF-α secretion (6 and 24 h, Figure 7A). Similarly, ODE-exposed cells secreted higher amounts of IL-6 at 6 and 24 h and EP treatment significantly decreased the same (Figure 7B). IL-10 levels did not change between control and ODE-exposed cells (Figure 7C) but compared to controls, ODE treated cells secreted more TGF-β1 at 48 h (Figure 7D). EP treatment did not change IL-10 and TGF-β1 levels (Figs. 7C and 7D) respectively.
Figure 7.
Ethyl pyruvate (EP) reduces organic dust extract (ODE)-exposure induced proinflammatory cytokines. Culture supernatants from cells treated media (control) or ODE were processed for various cytokine ELISA. A, Compared to medium, ODE-exposed cell culture supernatants secreted increased amounts of TNF-α. Compared to vehicle, EP treatment decreased the levels of TNF-α at 6 and 24 h. B, Compared to medium, ODE-exposed cell culture supernatants secreted increased amounts of IL-6 at 6 and 24 h. Compared to vehicle, EP treatment decreased the levels of IL-6 at 6 and 24 h. C, IL-10 levels did not change between control and ODE-treated groups at any time points and EP treatment did change IL-10 levels. D, Compared to medium, ODE-exposed cells secreted increased amounts of TGF-β1 at 48 h and EP treatment did not change ODE-induced TGF-β1 production.
siRNA-Mediated Knockdown of HMGB1 and Expression of HMGB1 and RAGE
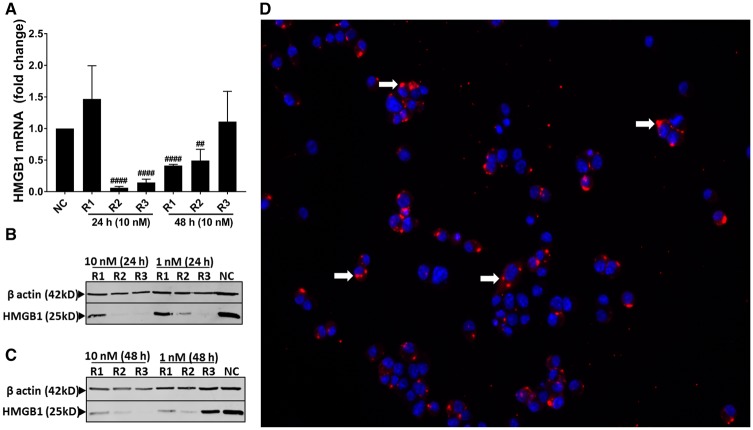
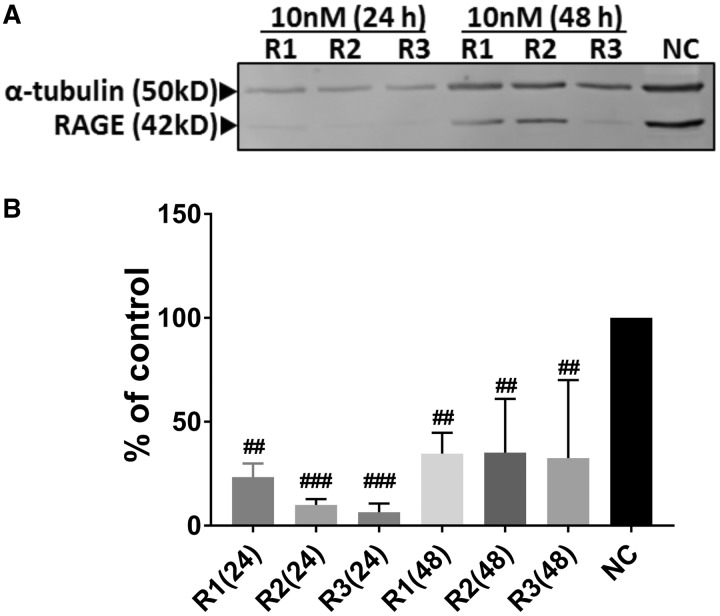
ICC performed (fluorescent TYE 563 and DAPI) confirmed the transfection of cells (Figure 8D). Compared to negative controls, anti-HMGB1 siRNA transfection (10 nM) resulted in the decrease in the amount of HMGB1 mRNA expression at 24 h (R2 and R3) and 48 h (R1 and R2) indicating that a combination of 3 siRNA will yield a successful decrease in the HMGB1 mRNA (Figure 8A). Semi-quantified Western blot analysis showed that, compared to negative control siRNA (NC), anti-HMGB1 siRNA transfection resulted in the decrease in the amount of HMGB1 protein at 24 (R2 and R3) and 48 h (R1, R2 and R3), indicating that a combination of R1, R2, and R3 will yield successful reduction in HMGB1 protein (Figs. 8B and 8C). Next, compared to negative control siRNA (NC), anti-HMGB1 siRNA treatment reduced the amount of RAGE protein at 24 (R1, R2, and R3) and 48 (R3) h (R3, Figure 9).
Figure 8.
Transfection of microglia with anti-HMGB1 siRNAs reduces high-mobility group box 1 (HMGB1) mRNA and protein levels. Cells treated with DsiRNAs (R1, R2, R3, NC) or TYE 563 (transfection control) were processed for whole cell lysate preparation or fixed with paraformaldehyde respectively. A, Following qRT-PCR R2 (10 nm) or R3 (10 nm) and R1 (10 nm) or R2 (10 nm) significantly reduced mRNA expression of HMGB1 at 24 and 48 h respectively. B–C, Following Western blot analysis R2 (10 nm) or R3 (10 nm) and R1 (10 nm), R2 (10 nm) or R3 (10 nm) reduced HMGB1 expression at 24 and 48 h respectively. D, After 48 h, immunofluoroscence shows successful transfection with TYE563 DsiRNA (white arrows) in the cytoplasm of microglia and the nucleus is stained in blue with DAPI (n = 3, A–D).
Figure 9.
Transfection of microglia with anti-HMGB1 siRNAs reduces RAGE protein levels. Following the siRNA-mediated reduction in high-mobility group box 1 (HMGB1) mRNA, receptor for advanced glycation end products (RAGE) (42 kD) and housekeeping protein α-tubulin (50 Kd) bands (n = 3) are shown (A). Normalized densitometry values show that, compared to negative control (NC) siRNA, anti-HMGB1 siRNA treatment (R1, R2, and R3) reduced the expression of RAGE protein levels at 24 and 48 h (#, anti HMGB1 siRNA effect, n = 3, B).
siRNA-Mediated Knockdown of HMGB1 mRNA and Production of ROS, RNS and Cytokines
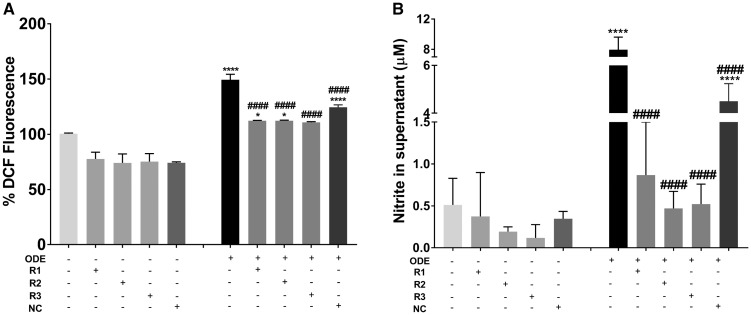
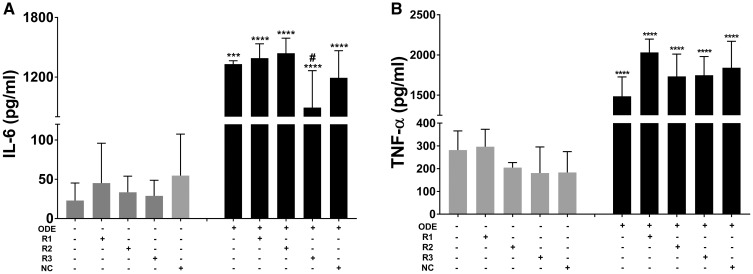
Compared to control (medium treated), ODE-treated cells without any siRNA treatment or those treated with negative control siRNA showed significantly higher amounts of ROS whereas anti-HMGB1 (R3, Figure 10A) reduced the ROS levels significantly. Although ROS levels significantly increased in anti-HMGB1 (R1 and R2) siRNA groups, they were also significantly lower than ODE-treated cells without any siRNA treatment or those treated with negative control (NC) siRNA. Similarly, compared to controls, ODE-treated cells without any siRNA treatment or those treated with negative control siRNA showed significantly higher amounts of RNS whereas anti-HMGB1 (R1, R2, and R3, Figure 10B) reduced the RNS levels significantly. siRNA-mediated knockdown of HMGB1 did not reduce ODE-induced TNF-α levels whereas R3 (anti-HMGB1 siRNA) reduced the ODE-induced IL-6 levels significantly (Figs. 11A and 11B respectively).
Figure 10.
Transfection of microglia with anti-HMGB1 (high-mobility group box 1) siRNAs reduces organic dust extract (ODE)-induced reactive oxygen species (ROS) and reactive nitrogen species (RNS) production. Compared to medium treated control cells, cells treated with ODE (with media or negative control [NC] siRNA) produced significantly increased amounts of ROS (A) and RNS (B). Following anti-HMGB1 siRNA treatment, ODE-induced ROS and secreted nitrite (representing RNS) production significantly decreased (n = 4, A and B).
Figure 11.
Transfection of microglia with anti-HMGB1 (high-mobility group box 1) siRNAs and effect on organic dust extract (ODE)-induced cytokine production. Compared to medium treated control cells, cells treated with ODE (with saline or negative control [NC] siRNA) produced significantly increased amounts of TNF-α (B) and IL-6 (A). Following anti-HMGB1 siRNA treatment, ODE-induced TNF-α (B) did not change whereas IL-6 production significantly decreased (A, n = 4, both A and B).
DISCUSSION
Higher incidences of neurodegenerative diseases in the mid-western and north-eastern part of the USA are known (Wright Willis et al., 2010). High intensity crop and food animal production through CAFOs in the mid-western USA as well as known dangers of pesticides in causing neuroinflammation and neurodegenerative diseases formed the basis for our study. Among the many contaminants, OD-exposure induced respiratory disease symptoms and long-term lung function decline are under intense investigation. However, the impact of OD-exposure on the brain is largely unknown. Due to the emerging role of DAMPs in inflammation, we tested a hypothesis that OD-exposure of microglial cells induces cell activation and inflammation through HMGB1-RAGE signaling.
Our current results indicate that OD-exposure of microglial cells induces nucleocytoplasmic translocation of HMGB1 at 24 and 48 h as well as secretion into the cell culture medium. To our knowledge, this is possibly the first report of translocation and secretion of HMGB1 in a microglial cell model of OD exposure. These observations hold significance because HMGB1 is a normal nuclear protein that undergoes translocation and secretion under necrosis and immune activation but not during apoptosis (reviewed in Ugrinova and Pasheva, 2017). Therefore, ODE-induced nucleocytoplasmic translocation and secretion of HMGB1 indicate immunological activation of microglia. This conclusion is further confirmed by ODE-induced upregulation of microglial Iba1 expression.
HMGB1 is known to bind to multiple receptors (Paudel et al., 2018) and among them RAGE appears to be the major receptor (Ugrinova and Pasheva, 2017). Interestingly, ODE-induced microglial activation also increases the expression of RAGE in these cells. Because OD is a mixture of multiple PAMPs, it is possible that complex overlapping signaling may lead to an increase in both HMGB1 and RAGE expressions. Recently, our kinome analysis of human airway epithelial (BEAS-2B) and monocytic cell line (THP-1) after exposure to OD has shown multiple overlapping signaling events (Nath Neerukonda et al., 2018). ODE-exposure induced increase in RAGE expression is intriguing and both EP treatment and siRNA-mediated knockdown of HMGB1 mRNA reduced the expression of RAGE. We did not investigate the possible mechanisms that regulate RAGE expression via HMGB1. However, these results suggest that HMGB1 could be a potential therapeutic target to reduce neuroinflammation because it also reduces the expression of RAGE.
We found that ODE-exposure stimulated microglia to produce both ROS and RNS starting at 6 h post exposure. These results suggest that reactive species produced by microglia could also be a source of stimulation for microglia to drive them into a proinflammatory M1-like phenotype (reviewed in Thompson and Tsirka, 2017). Further ODE-induced production of TNF-α and IL-6 supports this conclusion. Interestingly, EP treatment could only reduce ROS production whereas MA (mitochondrial targeted anti-oxidant and NOX-inhibitor) could reduce ODE-induced RNS production but not ROS (Ghosh et al., 2016; Langley et al., 2017). These results suggest that ODE-induced RNS production could be primarily mitochondrial in origin and may lead to mitochondrial damage. EP is known to suppress Ca2+-mediated activations of PKCα, calcium/calmodulin-dependent protein kinase IV (CaMKIV) and the phosphorylation of HMGB1 (Shin et al., 2015). EP treatment could only reduce ODE-induced ROS production but not RNS. However, when we specifically down-regulated HMGB1 mRNA using siRNAs, it abrogated both ODE-induced ROS and RNS production. Overall, it appears that HMGB1 could be targeted to reduce ODE-induced neuroinflammation.
Next, ODE-exposure induced microglia activation. This activation was characterized by an increase in Iba1 surface marker expression along with increased production of TNF-α, IL-6 and TGF-β1 but not IL-10. ODE-exposure also increased the nuclear translocation of NF-κB p65 and increase in NF-κB p65 total protein levels by 48 h. These results suggest that ODE-exposure mainly turns microglia into a proinflammatory M1-like phenotype that drives the neuroinflammation via NF-κB activation (Thompson and Tsirka, 2017). Both EP and MA treatment reduced the Iba1 expression indicating that both HMGB1 and mitochondria could be potential downstream targets to curtail ODE-exposure induced -inflammation. EP treatment reduced ODE-induced production of TNF-α and IL-6 whereas siRNA-mediated knockdown of HMGB1 could only reduce IL-6. Surprisingly, EP did not alter NF-κB p65 nuclear translocation or protein levels at 6, 24, and 48 h.
The current work is a preliminary investigation into the neuroinflammatory potential of inhaled OD in a mouse microglial cell model. However, our manuscript did not address the neuroinflammatory mechanism of ODE in a relevant animal model such as a mouse. Because global deletion of HMGB1 has shown to be fatal, development of conditional knock-out mouse models would be ideal to address the cell specific role of HMGB1 in neuroinflammation. Further, it will be interesting to investigate if ODE-exposure induces mitochondrial dysfunction and drive persistent neuroinflammation in chronic exposure models.
CONCLUSIONS
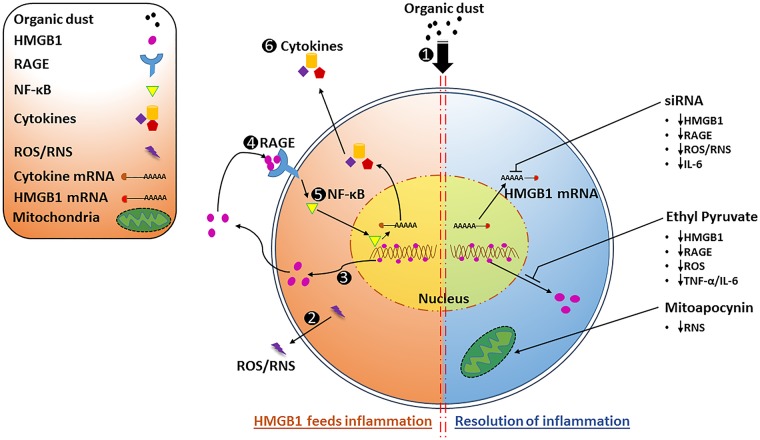
Our results demonstrate that ODE-exposure activates microglia, induces production of reactive species and proinflammatory cytokines as well as nucleocytoplasmic translocation and secretion of HMGB1. Targeting HMGB1 signaling in ODE-induced microglial activation has the potential to reduce neuroinflammation and promote resolution (Figure 12).
Figure 12.
Organic dust extract (ODE)-exposure of microglia leads to sustained inflammation via nucleocytoplasmic translocation of high-mobility group box 1 (HMGB1) and HMGB1-RAGE signaling whereas ethyl pyruvate (EP) or anti-HMGB1 siRNA treatment abrogates ODE-induced inflammation. ODE-exposure of microglial cells (1) leads to the production of reactive species (reactive oxygen species (ROS) and reactive nitrogen species (RNS) 2), nucleocytoplasmic translocation of HMGB1 (3) as well as HMGB1-RAGE (4) signaling leading to sustained levels of nuclear NF-κB p65 (5) to feed the inflammation (left side of the figure). EP or anti-HMGB1 siRNA or mitoapocynin (MA) treatment leads to a reduction in reactive species and inflammatory mediators promoting resolution of inflammation (right side of the figure).
DECLARATION OF CONFLICTING INTERESTS
A.G.K. is a shareholder of PK Biosciences Corporation (Ames, IA), which is interested in identifying novel biomarkers and potential therapeutic targets for Parkinson's disease. A.G.K does not have any commercial interests in the present work. All other authors declare that they have no potential conflicts of interest with respect to the research, authorship, and/or publication of this article.
ACKNOWLEDGMENTS
We would like to thank Dr Locke A. Karriker, VDPAM, Iowa State University for supplying us with OD samples collected from swine production units. We also thank Dr T. Thippeswamy’s laboratory (Biomedical Sciences, Iowa State University) for providing access to facilities and Ms Catharine A. Martens of Biomedical Sciences department for technical assistance.
FUNDING
C.C. laboratory is funded through startup grant through Iowa State University and a pilot grant (5 U54 OH007548) from Centers for Disease Control and Prevention- The National Institute for Occupational Safety and Health. A.G.K. laboratory is supported by National Institutes of Health grants (ES026892, ES027245 and NS100090).
REFERENCES
- Bhat S. M., Massey N., Karriker L. A., Singh B., Charavaryamath C. (2019). Ethyl pyruvate reduces organic dust-induced airway inflammation by targeting HMGB1-RAGE signaling. Respir. Res 20, 27.. [DOI] [PMC free article] [PubMed] [Google Scholar]
- Braun M., Vaibhav K., Saad N. M., Fatima S., Vender J. R., Baban B., Hoda M. N., Dhandapani K. M. (2017). White matter damage after traumatic brain injury: A role for damage associated molecular patterns. Biochim. Biophys. Acta 1863, 2614–2626. [DOI] [PMC free article] [PubMed] [Google Scholar]
- Charavaryamath C., Janardhan K. S., Townsend H. G., Willson P., Singh B. (2005). Multiple exposures to swine barn air induce lung inflammation and airway hyper-responsiveness. Respir. Res 6, 50.. [DOI] [PMC free article] [PubMed] [Google Scholar]
- Charavaryamath C., Juneau V., Suri S. S., Janardhan K. S., Townsend H., Singh B. (2008). Role of toll-like receptor 4 in lung inflammation following exposure to swine barn air. Exp. Lung Res. 34, 19–35. [DOI] [PubMed] [Google Scholar]
- Chin-Chan M., Navarro-Yepes J., Quintanilla-Vega B. (2015). Environmental pollutants as risk factors for neurodegenerative disorders: Alzheimer and Parkinson diseases. Front. Cell. Neurosci. 9, 124.. [DOI] [PMC free article] [PubMed] [Google Scholar]
- Di Candia L., Gomez E., Venereau E., Chachi L., Kaur D., Bianchi M. E., Challiss R. A. J., Brightling C. E., Saunders R. M. (2017). HMGB1 is upregulated in the airways in asthma and potentiates airway smooth muscle contraction via TLR4. J. Allergy Clin. Immunol. 140, 584–587.e588. [DOI] [PMC free article] [PubMed] [Google Scholar]
- Dosman J. A., Senthilselvan A., Kirychuk S. P., Lemay S., Barber E. M., Willson P., Cormier Y., Hurst T. S. (2000). Positive human health effects of wearing a respirator in a swine barn. Chest 118, 852–860. [DOI] [PubMed] [Google Scholar]
- Dusad A., Thiele G. M., Klassen L. W., Gleason A. M., Bauer C., Mikuls T. R., Duryee M. J., West W. W., Romberger D. J., Poole J. A. (2013). Organic dust, lipopolysaccharide, and peptidoglycan inhalant exposures result in bone loss/disease. Am. J. Respir. Cell. Mol. Biol. 49, 829–836. [DOI] [PMC free article] [PubMed] [Google Scholar]
- Fonken L. K., Frank M. G., Kitt M. M., D’Angelo H. M., Norden D. M., Weber M. D., Barrientos R. M., Godbout J. P., Watkins L. R., Maier S. F. (2016). The alarmin HMGB1 mediates age-induced neuroinflammatory priming. J. Neurosci. 36, 7946–7956. [DOI] [PMC free article] [PubMed] [Google Scholar]
- Fu H. Q., Yang T., Xiao W., Fan L., Wu Y., Terrando N., Wang T. L. (2014). Prolonged neuroinflammation after lipopolysaccharide exposure in aged rats. PLoS One 9, e106331.. [DOI] [PMC free article] [PubMed] [Google Scholar]
- Ghosh A., Langley M. R., Harischandra D. S., Neal M. L., Jin H., Anantharam V., Joseph J., Brenza T., Narasimhan B., Kanthasamy A., et al. (2016). Mitoapocynin treatment protects against neuroinflammation and dopaminergic neurodegeneration in a preclinical animal model of Parkinson’s disease. J. Neuroimmune Pharmacol. 11, 259–278. [DOI] [PMC free article] [PubMed] [Google Scholar]
- Halle A., Hornung V., Petzold G. C., Stewart C. R., Monks B. G., Reinheckel T., Fitzgerald K. A., Latz E., Moore K. J., Golenbock D. T. (2008). The NALP3 inflammasome is involved in the innate immune response to amyloid-[beta]. Nat. Immunol. 9, 857–865. [DOI] [PMC free article] [PubMed] [Google Scholar]
- International Labor Organization. (2018). Agriculture: a hazardous work. Available at: http://www.ilo.org/safework/areasofwork/hazardous-work/WCMS_110188/lang–en/index.htm. Accessed March 25, 2019.
- Iowa State University and University of Iowa. (2002). Iowa concentrated animal feeding operations air quality study. Available at: http://library.state.or.us/repository/2012/201204101013082/appendix_L.pdf. Accessed March 25, 2019. [Google Scholar]
- Jiang S., Chen X. (2017). HMGB1 siRNA can reduce damage to retinal cells induced by high glucose in vitro and in vivo. Drug Des. Devel. Ther. 11, 783–795. [DOI] [PMC free article] [PubMed] [Google Scholar]
- Kang R., Chen R., Zhang Q., Hou W., Wu S., Cao L., Huang J., Yu Y., Fan X. G., Yan Z., et al. (2014). HMGB1 in health and disease. Mol. Aspects Med. 40, 1–116. [DOI] [PMC free article] [PubMed] [Google Scholar]
- Kim I.-D., Shin J.-H., Kim S.-W., Choi S., Ahn J., Han P.-L., Park J.-S., Lee J.-K. (2012). Intranasal delivery of HMGB1 siRNA confers target gene knockdown and robust neuroprotection in the postischemic brain. Mol. Ther. 20, 829–839. [DOI] [PMC free article] [PubMed] [Google Scholar]
- Langley M., Ghosh A., Charli A., Sarkar S., Ay M., Luo J., Zielonka J., Brenza T., Bennett B., Jin H., et al. (2017). Mito-apocynin prevents mitochondrial dysfunction, microglial activation, oxidative damage, and progressive neurodegeneration in MitoPark transgenic mice. Antioxid. Redox Signal. 27, 1048–1066. [DOI] [PMC free article] [PubMed] [Google Scholar]
- Liu L., Jiang Y., Steinle J. J. (2017). Inhibition of HMGB1 protects the retina from ischemia-reperfusion, as well as reduces insulin resistance proteins. PLoS One 12, e0178236.. [DOI] [PMC free article] [PubMed] [Google Scholar]
- Musumeci D., Roviello G. N., Montesarchio D. (2014). An overview on HMGB1 inhibitors as potential therapeutic agents in HMGB1-related pathologies. Pharmacol. Ther 141, 347–357. [DOI] [PubMed] [Google Scholar]
- Nath Neerukonda S., Mahadev-Bhat S., Aylward B., Johnson C., Charavaryamath C., Arsenault R. J. (2018). Kinome analyses of inflammatory responses to swine barn dust extract in human bronchial epithelial and monocyte cell lines. Innate Immun. 24, 366–381. [DOI] [PMC free article] [PubMed] [Google Scholar]
- Ouyang F., Huang H., Zhang M., Chen M., Huang H., Huang F., Zhou S. (2016). HMGB1 induces apoptosis and EMT in association with increased autophagy following H/R injury in cardiomyocytes. Int. J. Mol. Med. 37, 679–689. [DOI] [PMC free article] [PubMed] [Google Scholar]
- Paudel Y. N., Shaikh M. F., Chakraborti A., Kumari Y., Aledo-Serrano A., Aleksovska K., Alvim M. K. M., Othman I. (2018). HMGB1: A common biomarker and potential target for TBI, neuroinflammation, epilepsy, and cognitive dysfunction. Front. Neurosci. 12, 628.. [DOI] [PMC free article] [PubMed] [Google Scholar]
- Poole J. A., Burrell A. M., Wyatt T. A., Kielian T. L., Romberger D. J. (2010). NOD2 negatively regulates organic dust-induced inflammation in monocytes/macrophages. J. Allergy Clin. Immunol. 125, AB118. [Google Scholar]
- Romberger D. J., Bodlak V., Von Essen S. G., Mathisen T., Wyatt T. A. (2002). Hog barn dust extract stimulates IL-8 and IL-6 release in human bronchial epithelial cells via PKC activation. J. Appl. Physiol. (1985) 93, 289–296. [DOI] [PubMed] [Google Scholar]
- Saijo K., Glass C. K. (2011). Microglial cell origin and phenotypes in health and disease. Nat. Rev. Immunol. 11, 775–787. [DOI] [PubMed] [Google Scholar]
- Sarkar S., Malovic E., Harishchandra D. S., Ghaisas S., Panicker N., Charli A., Palanisamy B. N., Rokad D., Jin H., Anantharam V., et al. (2017). Mitochondrial impairment in microglia amplifies NLRP3 inflammasome proinflammatory signaling in cell culture and animal models of Parkinson’s disease. NPJ Parkinson’s Dis. 3, 30.. [DOI] [PMC free article] [PubMed] [Google Scholar]
- Schneberger D., Aulakh G., Channabasappa S., Singh B. (2016). Toll-like receptor 9 partially regulates lung inflammation induced following exposure to chicken barn air. J. Occup. Med. Toxicol. 11, 31.. [DOI] [PMC free article] [PubMed] [Google Scholar]
- Sethi R. S., Schneberger D., Charavaryamath C., Singh B. (2017). Pulmonary innate inflammatory responses to agricultural occupational contaminants. Cell Tissue Res. 367, 1–16. [DOI] [PubMed] [Google Scholar]
- Shin J. H., Kim I. D., Kim S. W., Lee H. K., Jin Y., Park J. H., Kim T. K., Suh C. K., Kwak J., Lee K. H., et al. (2015). Ethyl pyruvate inhibits HMGB1 phosphorylation and release by chelating calcium. Mol. Med. 20, 649–657. [DOI] [PMC free article] [PubMed] [Google Scholar]
- Staab E., Thiele G. M., Clarey D., Wyatt T. A., Romberger D. J., Wells A. D., Dusad A., Wang D., Klassen L. W., Mikuls T. R., et al. (2016). Toll-like receptor 4 signaling pathway mediates inhalant organic dust-induced bone loss. PLoS One 11, e0158735.. [DOI] [PMC free article] [PubMed] [Google Scholar]
- Thompson K. K., Tsirka S. E. (2017). The diverse roles of microglia in the neurodegenerative aspects of central nervous system (CNS) autoimmunity. Int. J. Mol. Sci. 18, 504.. [DOI] [PMC free article] [PubMed] [Google Scholar]
- Ugrinova I., Pasheva E. (2017). HMGB1 protein: A therapeutic target inside and outside the cell. Adv. Protein Chem. Struct. Biol. 107, 37–76. [DOI] [PubMed] [Google Scholar]
- United States Department of Agriculture. (2018). Farm demographics – U.S. farmers by gender, age, race, ethnicity, and more. Available at: https://www.agcensus.usda.gov/Newsroom/2014/05_02_2014.php. Accessed March 25, 2019.
- Wright Willis A., Evanoff B. A., Lian M., Criswell S. R., Racette B. A. (2010). Geographic and ethnic variation in Parkinson disease: A population-based study of US Medicare beneficiaries. Neuroepidemiology 34, 143–151. [DOI] [PMC free article] [PubMed] [Google Scholar]


