

Abstract
Safe and effective DNA delivery systems are required to enable or enhance clinical strategies and research involving gene therapy and DNA vaccinations. To address this delivery problem, a series of charge-altering releasable transporters (CARTs) with varied lipid content were prepared and evaluated for plasmid DNA (pDNA) delivery into cultured cells. These lipid-modified CART co-oligomers were synthesized in only two steps via sequential organocatalytic ringopening polymerization of lipid-containing cyclic carbonate monomers and morpholinone monomers. Lipid variations of the CARTs substantially impacted the delivery efficiency of pDNA, with oleyl- and linoleyl-based CARTs showing enhanced performance relative to the commercial transfection agent Lipofectamine 2000 (L2000). The best-performing oleyl CART was carried forward to study stable luciferase transfection with a Sleeping Beauty (SB) transposon system. The oleyl CART outperformed the L2000 positive control with respect to stable transfection efficiency. CART−pDNA complexes represent a new DNA delivery system for research and clinical applications.
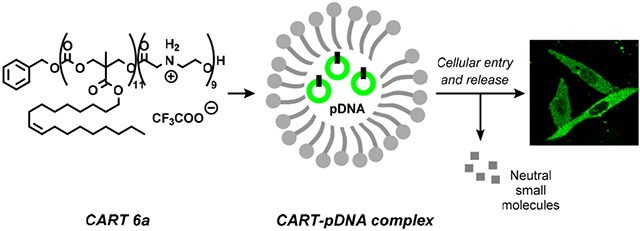
Graphical Abstract
INTRODUCTION
Plasmid DNA (pDNA) delivery systems are critically needed to enable or enhance many emerging biomedical applications directed at gene therapy or DNA vaccinations.1,2 The importance of such delivery systems is further amplified by the growing interest in and use of gene modification by CRISPR/Cas9 and transposon systems, many of which rely on delivery of multiple DNA components.3,4 However, the safe and effective delivery of DNA remains a major goal for optimal clinical translation.2 DNA is a large, hydrophilic polyanion that does not readily traverse the nonpolar plasma membrane of cells and other biological barriers. Additionally, because plasmid DNA is susceptible to nuclease degradation and has a half-life of minutes after intravenous injection, it needs to be protected and packaged for delivery into cells.5,6 Finally, the DNA must be released from the delivery vehicle after cell entry and move to the nucleus to enable transcription by DNA-dependent RNA polymerases. Thus, the ideal delivery system would successfully complex, protect, deliver, and release its DNA cargo; be easily accessible synthetically; allow for facile nanoparticle formation; and achieve high transfection efficiencies with low toxicity.
Approaches to DNA delivery have fallen into three categories: (1) physical, (2) viral, and (3) nonviral delivery methods.2,7–9 Physical delivery methods such as electroporation have been shown to enhance gene delivery but often suffer from toxicities associated with the transient formation of membrane pores.10 Viral vectors are efficient delivery vehicles; however, they have a limited carrying capacity, with size constraints on the nucleic acid cargo of approximately 4−12 kb, depending on the virus family.11 Viral delivery also introduces concomitant biosafety concerns related to the immunogenicity of the viral components.12,13 Nonviral methods can overcome these drawbacks. Typically, nonviral delivery agents are designed to take advantage of electrostatic interactions between the negatively charged phosphate groups of the nucleic acid and a polycationic transporter, such as polyethylenimine (PEI), cationic lipids, or cationic peptides (e.g., poly-l-lysine, PLL). In recent years, polycationic transporters have been expanded to other functional backbones and “smart” polymers for stimuli-responsive nucleic acid release.14–17 The resulting nucleic acid−transporter complexes undergo cellular internalization through initial interactions with the membrane followed by mainly endosomal uptake.2,18 The larger carrying capacity and tunability of nonviral vectors notwithstanding, these molecular transporters often suffer from relatively low gene delivery efficiencies and high cytotoxicity. For example, Lipofectamine 2000 (L2000, Invitrogen-Thermo-Fisher), consisting of a cationic and a neutral lipid, is one of the most commonly used commercial transfection reagents, yet its use—especially in the clinic—is limited by the toxicity associated with some lipoplexes.19 The cytotoxicity of other cationic polymers, like PEI and PLL, often precludes their use in gene delivery, further emphasizing the ongoing need for a nontoxic transfection agent.20,21
Recent studies show that the transfection efficiency of PEI can be improved with the addition of various lipophilic groups, underscoring the importance of the lipid component to optimal delivery.22–24 The incorporation of lipid-rich functionalities into other cationic systems has also improved their transfection efficiency.25–28 In one example, the conjugation of lipophilic C18 tails onto the arms of cationic peptide tweezers increased transfection efficiencies to levels comparable to L2000.29 Similarly, increasing the lipophilicity of cationic poly- (alkylamidoamine)s by varying the length of methylene linkers also leads to enhanced plasmid delivery.30 However, delivery, a dynamic process involving DNA complexation and release, is often hampered by static, charge-invariant systems, which exhibit delayed or incomplete release of DNA after cellular entry, leading to reduced transfection efficiencies.
Dynamic biodegradable systems, such as PLL, poly(β-hydroxyalkanoates), imidazolium polyesters, and poly(β-amino esters), have been designed to enhance DNA release, resulting in subsequent increases in transfection efficiency.31–35 Specifically, poly(β-aminoester)s were developed to electrostatically associate with pDNA and degrade via hydrolysis of the esters to bis(β-amino acid) byproducts at physiological pH.36 Furthermore, it has been shown that poly(β-aminoester)-based nanoparticles can deliver minicircle DNA into cells in vitro and in vivo.37 In addition to facilitated release and higher transfection levels, these degradable delivery vehicles also exhibit low accumulation and reduced toxicity. Recently, we reported the utility of a new polycationic oligo(carbonate-block-α-amino ester) system, charge-altering releasable transporters (CARTs), for the complexation and delivery of mRNA into cells in vitro and in vivo.38 The polycationic α-amino ester block initially promotes RNA complexation and then degrades to neutral small molecules, a dynamic structural change that eliminates electrostatic complexation as the initial cationic amines convert irreversibly to neutral amides, thereby releasing free mRNA.
The current study aimed to determine whether the CART-mRNA technology could be adapted to the delivery of the larger and more complex pDNA cargo as well as to examine the role of lipid domain variations on complexation, delivery, and release. To address this challenge, we prepared a series of lipophilic transporters, each consisting of a lipid and a cationic block, with various lipid monomers and block lengths. Here we report on the transfection efficiencies of these transporters for the delivery of pDNA and in particular the as yet unexplored effects of the lipid group. Oleyl- and linoleyl-based systems were found to perform better than L2000. We further demonstrated that these lipid-modified CARTs deliver plasmids of various sizes to multiple cell lines. We also successfully employed these CARTs for stable transfection of cells in vitro using a Sleeping Beauty (SB) transposon system, which required the codelivery of multiple integrating transposon plasmids. These studies demonstrate a proof-of-concept application for delivery of multiple plasmids with the intention of genome modification using CART complexes.
EXPERIMENTAL SECTION
Materials.
Chemical reagents were purchased from Sigma-Aldrich or Ark Pharm and used without further purification. The NBoc morpholinone monomer,39 MTC monomer precursor,40 and 1-(3,5- bis-trifluoromethylphenyl)-3-cyclohexylthiourea41 were all prepared according to published procedures. Unless otherwise noted, commercial solvents and reagents were used without further purification. Dimethyl sulfoxide (DMSO), ethyl acetate (EtOAc), pentane, toluene, and methanol (MeOH) were obtained from Fisher Scientific. Methylene chloride (CH2Cl2) and tetrahydrofuran (THF) were passed through an alumina drying column (Solv-Tek Inc.) using nitrogen pressure before use. Cholesterol and dodecyl cyclic carbonate monomers were synthesized according to previously published procedures.42 Linoleyl alcohol was purchased from Cayman Chemical as a solution in ethanol, which was removed in vacuo, and the resulting material was used without further purification. Toluene and CH2Cl2 for glovebox polymerizations were degassed by three freeze−pump− thaw cycles or passed through an alumina drying column. Deuterated NMR solvents were purchased from Cambridge Isotope Laboratories. Regenerated cellulose dialysis membranes (Spectra/Por 6 Standard RC; MWCO 1000) were purchased from Spectrum Laboratories, Inc. Dulbecco’s modified Eagle’s medium (DMEM) was purchased from Invitrogen, and Ham’s F-12K (Kaighn’s) medium was purchased from Fisher Scientific. Both were supplemented with 10% FBS and 1% penicillin/streptomycin unless otherwise noted. Lipofectamine 2000 was purchased from Life Technologies (Carlsbad, CA). 3-(4,5- Dimethylthiazol-2-yl)-2,5-diphenyltetrazolium bromide (MTT) was purchased from Fluka. Bryostatin 1 was synthesized by the Wender group as previously reported.43 PKCδ-GFP and PKCγ-GFP (Addgene No. 21204) plasmids were a generous gift of Dr. Tobias Meyer. The hyperactive Sleeping Beauty (SB) transposase plasmid pCMV(CAT)- T7-SB100 (Addgene No. 34879, short: pCMV-SB100)44 was a generous gift from Dr. Zsuzsanna Izsvak, Max Delbrück Center, Berlin, Germany. The fLuc=tdTom transposon plasmid pKT2/CAG-Luc=tdTom-SP (short: pKT2/CAGL=tTP) expressing a firefly luciferase-tandem Tomato red fluorescent protein (Addgene, Plasmid No. 32904) under control of the CAG promoter was generated by modification of the vector pKT2/LuBIG45 (Bachmann, M. H., manuscript in preparation) and provided as a mix with SB100 transposase plasmid (Supporting Information, Table S1).
Analytical Methods.
NMR spectra were recorded on a Varian Inova 300, Varian Inova 400, or Varian Inova 500 magnetic resonance spectrometer, as noted. 1H chemical shifts are reported relative to the residual solvent peak (CDCl3 = 7.26 ppm, CD OD = 3.31 ppm). 13C chemical shifts are reported relative to the residual solvent peak (CDCl3 = 77.16 ppm). Infrared (IR) spectra were measured on a PerkinElmer 1600 Series Fourier transform spectrometer (FTIR) and are reported in wavenumbers (cm−1). High-resolution mass spectra (HRMS) were obtained from the Stanford University Mass Spectrometry facility, Stanford, CA 94305. Gel permeation chromatography (GPC) was performed in THF (5 mg/mL) on a Malvern Viscotek VE2001 chromatography system equipped with four 5 μm Waters columns (300 × 7.7 mm) connected in series at a flow rate of 1.0 mL/min. Number-average molecular weights (Mn in g mol−1) and dispersity (Đ) were calibrated using monodisperse polystyrene standards (Polymer Laboratories). Particle size and zeta potential were measured by dynamic light scattering (DLS) on a Malvern Zetasizer Nano ZS90. Scanning electron microscopy (SEM) was performed on a Zeiss Sigma FESEM (Stanford University Cell Sciences Imaging Facility). Flow cytometry analysis was performed on a BD LSRII FACS Analyzer (Stanford University Shared FACS Facility, LSRII.UV). Laser scanning confocal microscopy was carried out using a Leica SP8 white light two-photon/confocal microscope with a 40× HC PL APO, CS2 oil objective lens (Stanford University Cell Sciences Imaging Facility). Bioluminescence was measured using a CCD camera (IVIS 50; Xenogen Corp.) and analyzed using Living Image Software (PerkinElmer).
Dynamic Light Scattering (DLS) and Zeta Potential Characterization.
DLS was used to determine the size of the CART−pDNA complexes. CART−pDNA solutions were made by preparing the complexes in PBS pH 5.5 (104−108 μL), with 0.53 μL of pPKCδ-GFP (3.9 μg/μL stock in RNase free PBS pH 7.4) and various amounts of oligomer from a 2 mM stock solution (7−10 μL in DMSO) to achieve charge ratios of 25:1 (+/−). The solution was mixed for 20 s then added to 835 μL of RNase-free water. 115 μL of this solution was then immediately transferred to a disposable cuvette for measurement. Size measurements were taken at the initial time (2 min), 30 min, and 60 min. The sizes reported are the z-averages and are reported in diameter nm (d.nm). Error is expressed as ± SD. For zeta potential measurements, complexes were prepared as described above, and then 825 μL was transferred to a zeta cell (DTS1060). Zeta potential measurements were taken at t = 2, 10, 20, 30, 40, 50, and 60 min. The values reported are the average of a minimum of three trial runs. Error is expressed as ±SD.
Scanning Electron Microscopy (SEM) Imaging.
CART−pDNA complexes were prepared in a manner similar to that described above to achieve charge ratios of 25:1 (+/−). The CART−pDNA complex solution was diluted into 740 μL of RNase-free water; then 10 μL of this solution was dropped onto a silicon wafer and dried overnight. Images were taken on a Zeiss Sigma FESEM.
Lipidated Cyclic Carbonate Monomer Synthesis.
Dodecyl and cholesterol monomers were prepared according to previously published procedures.42 Nonenyl, stearyl, oleyl, and linoleyl monomers were prepared in a similar manner. A representative synthesis of the nonenyl monomer is as follows. Catalytic dry dimethylformamide was added to a solution of 5-methyl-2-oxo-1, 3-dioxane-5-carboxylic acid (S1, synthesized according to published procedure,40 250 mg, 1.56 mmol, 1 equiv) in dry THF (8 mL) in an oven-dried 25 mL round-bottom flask under N2. To this solution was added oxalyl chloride (137 μL as a solution in 3 mL of THF, 1.60 mmol, 1.02 equiv). The reaction mixture was stirred for 1 h at rt before volatiles were removed in vacuo to yield the acid chloride as a pale yellow solid. The product was used immediately without further purification.
To a solution of cis-6-nonen-1-ol (261 μL, 1.56 mmol, 1 equiv) in THF (2 mL) was added freshly distilled triethylamine (238 μL, 1.71 mmol, 1.1 equiv). This solution was added to a solution of the crude acid chloride from above in THF (3 mL), and a white precipitate immediately formed. The reaction was stirred under N2 overnight at rt. The reaction mixture was filtered, washed with THF (3 × 5 mL), and then concentrated in vacuo. Purification of the resulting residue by silica gel column chromatography (30−40% EtOAc/pentane) resulted in the desired nonenyl cyclic carbonate monomer S2 as a clear oil in 43% yield. Detailed procedures for lipidated monomers and 1H NMR, 13C NMR, HRMS, and IR characterization are provided in the Supporting Information.
Boc-Protected Co-Oligomer Synthesis.
Boc-protected cooligomers were all prepared by similar procedures. A representative synthesis of Boc-protected CART co-oligomer N10:A10 is as follows. In a glovebox under N2, nonenyl cyclic carbonate monomer S2 (33.8 mg, 0.199 mmol, 12 equiv), thiourea catalyst (TU, 5 mol % with respect to monomer, 2.2 mg, 6 μmol, 0.63 equiv), and benzyl alcohol (or BDK 2) initiator (9.9 μL as a 1 M solution in toluene, 0.01 mmol, 1 equiv) were added to a 1-dram flame-dried vial. This was then further diluted with toluene (109 μL, for a final concentration of 1 M with respect to monomer). Catalytic DBU (5 mol % with respect to monomer, 6 μmol, 0.63 equiv) was added to the reaction vial, and the reaction was stirred in the glovebox at rt for 2 h before N-Boc morpholinone monomer 139 (26.5 mg, 0.132 mmol, 13.3 equiv) was added to the reaction. After stirring at rt for an additional 3.5 h, benzoic acid was added to quench the reaction. The crude reaction solution was dialyzed against MeOH (1.0 kDa dialysis bag) overnight. Concentration afforded protected nonenyl co-oligomer S6 as a clear oil. The degree of polymerization was determined by 1H NMR end-group analysis, and the number-average molecular weights (Mn) and dispersity (Đ) were determined by gel permeation chromatography (GPC). Detailed synthetic procedures and characterization are provided in the Supporting Information.
Boc-Deprotection of Co-Oligomers.
Trifluoroacetic acid (TFA, 0.5 mL) was added to a vial containing Boc-protected co-oligomer (7.5−45 mg) dissolved in dry CH2Cl2 (4.5 mL). The reaction was sealed under N2 and stirred at rt overnight. The solvent was concentrated in vacuo to afford the desired co-oligomers 3a−8 as a light brown oil. Complete deprotection was confirmed by 1H NMR; spectra are provided in the Supporting Information.
Cell Culture.
CHO-K1 cells were maintained in Ham’s F-12K (Kaighn’s) medium supplemented with 10% (v/v) FBS and 1% penicillin/streptomycin. HeLa and HEK-293 cells were maintained in DMEM supplemented with 10% FBS and 1% penicillin/streptomycin. All cells were grown at 37 °C in a 5% CO2 at ~80% confluence with 0.25% trypsin−EDTA.
Flow Cytometry.
CHO-K1 cells were seeded at 40 000 cells/well in 24-well plates and allowed to adhere overnight at 37 °C. CART−pDNA complexes were prepared by mixing RNase-free PBS, pH 5.5, (104−108 μL), and 0.53 μL of pPKCδ-GFP (3.9 mg/mL stock in RNase-free PBS) with various amounts of CART (7−10 μL, from a 2 mM DMSO stock solution) to achieve specific CART:pDNA ratios (optimized to a theoretical cation:anion charge ratio of 25:1, 115 μL total volume). The complexes were incubated for 20 s at room temperature prior to treatment. The L2000 control was prepared in OptiMEM per the manufacturer’s instructions. The cells were washed with ~0.5 mL of serum-free F-12K medium, and then 500 μL of serum-free F-12K medium was added to the wells with untreated cells, 425 μL to the wells treated with L2000−pDNA, and 462.5 μL to the wells treated with CART−pDNA complex. Then 75 μL of L2000−pDNA solution was added to each of three wells for a final volume of 500 μL/well and 674 ng pDNA/well. 37.5 μL of the CART−pDNA complex was added to each of three wells for a total volume of 500 μL and a final pDNA concentration of 674 ng/well. The cells were incubated for 24 h at 37 °C, at which time the medium was replaced with 500 μL of serum-containing F-12K medium. The cells were incubated for an additional 24 h, washed with PBS (1.0 mL), and then trypsinized with 0.5 mL of trypsin−EDTA (0.25%) for 5 min at 37 °C. F-12K medium (0.5 mL) was added, and the contents of each well were transferred to a 15 mL conical tube and centrifuged (1200 rpm for 5 min). The pelleted cells were redispersed in PBS (200 μL), transferred to FACS tubes, and analyzed by a flow cytometer (LSR-II.UV, Stanford University). Results were analyzed using FlowJo software. The data presented are the median fluorescent signals from 5000 to 10 000 cells analyzed. For transfection efficiency, untreated cells were gated for no GFP expression, and the data presented are the percentage of cells analyzed with higher GFP expression than untreated cells. Error is expressed as ±SD. All other cell lines were used as above in their respective media.
Cell Viability.
CHO-K1 cells were plated in a 96-well plate at a density of 6000 cells/well in 50 μL of F-12K medium. Cells were allowed to incubate for 24 h at 37 °C. Cells were washed with 50 μL of serum-free F-12K medium, and then 50 μL of serum-free F-12K medium was added to all wells. CART−pDNA complexes were formed at a charge ratio of 25:1 (+/−) and were prepared by mixing various amounts of CART 3a-8 from a 2 mM stock solution (7−10 μL in DMSO) with 0.53 μL of pPKCδ-GFP (3.9 mg/mL stock solution in RNase free PBS) and RNase-free PBS, pH 5.5 (39−43 μL). The complexes were allowed to incubate for 20 s at room temperature. Cells were dosed with CART−pDNA complexes (50 μL/well from a serially diluted compound plate) to afford final assay concentrations. One column of cells was left untreated for determination of percent maximal viability. Cells were incubated with complexes for 24 h at 37 °C; then the medium was removed and replaced with 100 μL of fresh, serum-containing F-12K medium. After an additional 24 h of incubation, 10 μL of a 5 mg/mL solution of MTT46 (Fluka) in cell culture media was added to all wells. The cells were further incubated for 2.5 h at 37 °C, at which time they were lysed with 100 μL of a solution of 10% Triton X in 0.1 N HCl in isopropanol and allowed to incubate for another 30 min. Plates were analyzed with a VERSAmax tunable microplate reader (Molecular Devices) using SOFTmax Pro version 3.1.1, reading at 570 nm and subtracting from 690 nm. Data from each row were normalized to the corresponding untreated cells. Experimental error is expressed as ±SD.
Translocation Assay with Bryostatin 1.
CHO-K1 cells were plated in a six-well plate at 600 000 cells/well for a final volume of 2.5 mL of (+/+ FBS/PS) F-12 Kaighn’s media. Cells were incubated 24 h at 37 °C (5% CO2). For each well of CHO-K1 cells, CART−pDNA complexes were prepared by mixing RNase-free PBS, pH 5.5, (80−89 μL) and 1.03 μL of pPKCδ-GFP (3.9 mg/mL stock in RNase-free PBS, pH 7.4) with CART 6a or 7 (10.2 or 19.1 μL, respectively, from a 2 mM DMSO stock solution) to achieve a net charge ratio of 15:1 or 25:1 (+/−), respectively, for 100 μL total volume. The complexes were incubated for 20 s at room temperature prior to treatment. 100 μL of the complex was added to the respective wells of the six-well plate in 2.4 mL of (−/− FBS/PS) F-12 Kaighn’s media. The cells were then incubated at 37 °C (5% CO2) for 24 h. After incubation, media was aspirated, and the cells were washed with PBS (1.5 mL) and trypsinized (500 μL). The cell suspension was then diluted with 2.0 mL of (+/+ FBS/PS) F-12 Kaighn’s media. For each run, a 800 μL aliquot of the cell suspension was placed in the center of a glassbottomed Fluorodish. The cells were incubated for at least 3 h at 37 °C. 2.0 mL of (+/+ FBS/PS) F-12 Kaighn’s media was then added to cover the Fluorodishes, and the cells were incubated at 37 °C until the time of the experiment.
Fluorescence images were obtained using a Leica SP8 white light two-photon/confocal upright microscope (40× HC PL APO, CS2 oil objective lens, 1024 × 1024 resolution, 488 nm argon laser) and the LaserSharp 2000 software package. Prior to analysis, the media in the Fluorodish was removed, and 800 μL of Dulbecco’s phosphate buffered saline (PBS, Gibco, no Ca+ or Mg2+) supplemented with glucose (10 mM) as the extracellular media was added to the cells. Bryostatin 1 in a DMSO stock solution was diluted to the desired concentration in the extracellular buffer just prior to dosing. The final concentration of DMSO the cells were exposed to did not exceed 0.1%. Cells were located for imaging, and data were recorded over a 20 min window, taking 41 images at 30 s intervals. After the fifth interval, the diluted bryostatin 1 solution (200 μL) was added to the Fluorodish (final concentration of 200 nM). Data were recorded at room temperature.
Stable Transfection and Bioluminescence Imaging (BLI) of CHO-K1 Cells.
CHO-K1 cells were seeded at 10 000 cells/well in black 96-well plates and allowed to adhere overnight at 37 °C. 6a− pDNA complexes were prepared by first premixing PBS at pH 5.5 with either 470 ng of a single fLuc=tdTom transposon plasmid, pKT2/ CAGL=tTP (9937 bp; Bachmann, M. H., unpublished), encoding a fusion reporter protein consisting of firefly luciferase and tandem Tomato red fluorescent protein under control of the CAGGS promoter, or 585 ng total of the same plasmid mixed with pCMV-SB100, a plasmid encoding the hyperactive SB100 transposase44 (4752 bp, Addgene, Plasmid No. 34879) in a 2:1 ratio. The L2000 control was prepared in serum-free OptiMEM medium (ThermoFisher) per the manufacturer’s instructions. Immediately before transfection, 6a was added to the plasmid/PBS solutions from a 2 mM stock solution in DMSO to achieve the indicated net charge ratio, typically 5:1 (+/−). The resulting complexes were incubated at room temperature for 20 s prior to addition to cells. Cells were rinsed with serum-free F- 12K medium; then 7.3 μL of complex was added to each well of the 96-well plate containing serum-free media for a final volume of 50 μL per well and a pDNA concentration of 137 ng/well (pKT2/ CAGL=tTP) or 171 ng/well (pKT2/CAGL=tTP/pCMV-SB100 mix). Cells were incubated with treatment for 24 h at 37 °C, at which time the medium was replaced with 100 μL of serum-containing F-12K medium with 0.3 mg/mL d-luciferin. The resultant bioluminescence intensity per well was measured using an IVIS 50 chargecoupled device (CCD) camera and Living Image Software (PerkinElmer, Waltham, MA). Error is expressed as ±SD. Upon confluency, cells were passaged to new wells using trypsin-EDTA (0.25%).
Puromycin Selection of Stably-Transfected CHO-K1 Cells.
CHO-K1 cells were seeded at 10 000 cells/well in black 96-well plates and allowed to adhere overnight at 37 °C. 6a−pDNA complexes were prepared by mixing PBS at pH 5.5 with 585 ng of pKT2/CAGL=tTP/ pCMV-SB100 mix. The L2000 control was prepared in serum-free OptiMEM medium per the manufacturer’s instructions. Immediately before transfection, 6a was added to the pDNA/PBS solution from a 2 mM stock solution in DMSO to achieve a net charge ratio of 5:1 (+/−). Complexes were incubated at room temperature for 20 s prior to addition to cells. Cells were rinsed with serum-free F-12K medium (50 μL); then 7.3 μL of complex was added to each of three wells of the 96-well plate containing serum-free media for a final volume of 50 μL per well and a pDNA concentration of 171 ng/well. After 24 h, the medium was replaced with 100 μL of serum-containing F-12K medium supplemented with 0.3 mg/mL d-luciferin and 6 μg/mL puromycin. Cells were imaged daily using an IVIS 50 charge-coupled device (CCD) camera as described above. Error is expressed as ±SD. Cells were passaged 72 h after transfection using 20 μL of trypsin- EDTA (0.25%) per well. Cells were incubated for 5 min and then diluted with 80 μL of serum-containing F-12K medium for a final volume of 100 μL per well. From each well, 30 μL of the cell solution was added to each of three new wells and diluted with 70 μL of serum-containing F-12K medium supplemented with 0.3 mg/mL d-luciferin and 6 μg/mL puromycin. The remaining 10 μL of cell solution in the original wells was diluted with 90 μL of serum-containing F-12K medium with 0.3 mg/mL d-luciferin and 6 μg/mL puromycin for a final volume of 100 μL in each well.
Mechanism of Cellular Uptake.
For studies at reduced temperature, CHO-K1 cells were seeded at 10 000 cells/well in black 96-well plates and allowed to adhere overnight at 37 °C. Cells were incubated in serum-free F-12K at 4 °C for 30 min before treatment with 6a−pDNA complexes. Complexes were prepared by first premixing PBS at pH 5.5 with 470 ng of pKT2/CAGL=tTP. Immediately before transfection, 6a was added to the plasmid and PBS solutions from a 2 mM stock solution in DMSO to achieve a net charge ratio of 5:1 (+/−). The resulting complexes were incubated at room temperature for 20 s prior to addition to cells. Cells were rinsed with serum-free F-12K medium at 4 °C; then 7.3 μL of complex was added to each well of the 96-well plate containing serum-free media for a final volume of 50 μL per well and a pDNA concentration of 137 ng/well. Cells were incubated with treatment for 4 h at either 4 or 37 °C, at which time the cells were washed and medium was replaced with 100 μL of serum-containing F-12K medium with 0.3 mg/mL d-luciferin. The cells were incubated for an additional 20 h at 37 °C before the resultant bioluminescence was measured as described above.
RESULTS AND DISCUSSION
Design and Synthesis of Lipid-Modified CARTs.
An attractive aspect of CART technology is that diblock cooligomers of any composition or length can be synthesized in only two steps from various lipidated cyclic carbonate monomers and N-Boc-protected morpholinone monomers using a previously reported organocatalytic ring-opening polymerization (OROP).38,39 This method employs a thiourea catalyst (TU, 1-(3,5-bis-trifluoromethylphenyl)-3-cyclohexylthiourea) to selectively activate the cyclic monomers by hydrogen bonding and a 1,8-diazabicyclo[5.4.0]undec-7-ene (DBU) cocatalyst to facilitate the reaction with a primary alcohol initiator, thus avoiding potential issues associated with metal contaminants encountered with some other polymerization methods.41,47 This two-step, three-component synthesis can be initiated with a variety of primary alcohol initiators, including simple molecules, dyes, and targeting agents. OROP also has high monomer functional group tolerance, results in oligomers with narrow molecular weight distributions, and by varying the ratio of initiator to monomer allows for control over the degree of polymerization, which determines oligomer composition and length.48
The dynamic, charge-altering co-oligomers investigated in this study were designed to contain a lipid-rich hydrophobic block to assist with particle formation and membrane interactions as well as a cationic block to effect initial pDNA electrostatic complexation and, subsequently upon neutralization, pDNA release. Previously, our group employed morpholinone-based cationic oligomers (CARTs) for the in vitro and in vivo delivery of mRNA and showed their rearrangement to neutral small molecules (diketopiperizine) over time, resulting in efficient release of their nucleic acid cargo.38 As our group and others have demonstrated, the lipophilic domain is indispensable for the complexation and efficient delivery of nucleic acids.42,49–51 To systematically investigate the role of the lipid domain on pDNA delivery, we varied both the identity of the lipid side chain and the lipid to cationic amine ratio using monomers incorporating lipid side chains of various lengths and degrees of unsaturation (6-cisnonenyl [nonenyl], dodecyl, stearyl, oleyl, or linoleyl, Scheme 1). As cholesterol-based systems often exhibit lower toxicity than other cationic lipids, in addition to improved cell association and uptake, a cholesterol side chain was also included to expand the series to polycyclic lipids.52 Toward these ends, a new family of lipidated cyclic carbonate monomers was synthesized via acid chloride formation from methyl trimethylene carbonate (MTC) carboxylic acid and subsequent esterification with the desired lipid alcohol.
Scheme 1.

Structures of Lipid-Modified CARTs and Their Two-Step Synthesis by Ring-Opening Polymerization and Deprotection
Lipid-modified CART co-oligomers of varying compositions were prepared by OROP of a lipidated carbonate monomer, followed by oligomerization of readily accessible morpholinone (Scheme 1, 1) to incorporate the protected amine block.38 Benzyl alcohol was originally used as the alcohol initiator as it provides a useful handle for 1H NMR characterization. Further demonstrating the scope of this oligomerization strategy, boron diketonate (BDK) initiator 2 was employed to synthesize fluorescent CARTs, which allow for real-time intracellular imaging.53 The general method for the preparation of CARTs 3a−8 is as follows. A solution of alcohol initiator (R′−OH, see Scheme 1) in toluene was added to a vial charged with thiourea catalyst and lipidated monomer. Catalytic DBU was added, and after 2 h at room temperature, protected morpholinone monomer 1 was added. After an additional 3.5 h the reaction was quenched with benzoic acid. The reaction mixture was dialyzed (MWCO 1000) against methanol overnight. Global deprotection with 10% trifluoroacetic acid yielded the desired CARTs. The degree of polymerization (DP) was determined by end-group analysis using 1H NMR of the Boc-protected CART, and gel permeation chromatography (GPC) was used to determine the dispersity, Đ (Table 1).
Table 1.
Representative Synthesized Lipid-Modified CARTs
| entry | CART namea | DP (n)b | DP (m)b | R | initiator | Đc |
|---|---|---|---|---|---|---|
| 3a | N10A10 | 10 | 10 | nonenyl | benzyl | 1.32 |
| 3b | N11A11 | 11 | 11 | nonenyl | benzyl | 1.22 |
| 4d | D13A11 | 13 | 11 | dodecyl | benzyl | 1.25 |
| 5a | S8.5A10.5 | 8.5 | 10.5 | stearyl | benzyl | 1.36 |
| 5b | S9.5A9 | 9.5 | 9 | stearyl | benzyl | 1.31 |
| 6a | O11A9 | 11 | 9 | oleyl | benzyl | 1.39 |
| 6b | O22A29 | 22 | 29 | oleyl | BDK, 2 | 1.31 |
| 7 | L7.5A8 | 7.5 | 8 | linoleyl | benzyl | 1.53 |
| 8 | Chol13A11 | 13 | 11 | cholesterol | benzyl | 1.27 |
Descriptors refer to the lipid side chain (N = nonenyl, D = dodecyl, S = stearyl, O = oleyl, L = linoleyl, Chol = cholesterol) and amine group (A) used, followed by numbers that reflect degree of polymerization, corresponding to n and m in Scheme 1.
Degree of polymerization (DP) was determined by 1H NMR end-group analysis of Bocprotected CART.
Dispersity (Đ) was determined on Boc-protected CART in THF relative to polystyrene standards.
From ref 38.
Delivery and Transient Expression of Plasmid DNA in Cultured Cells.
The ability of the lipid-modified CARTs to deliver and release plasmid DNA was first assayed using Chinese hamster ovary (CHO-K1) cells with a plasmid that upon uptake and expression would generate a GFP-labeled full-length protein kinase C δ (PKCδ-GFP) fusion protein.54,55 This plasmid has been used by us and others to study the translocation of the PKCδ-GFP fusion protein by bryostatin and its analogues, which are leads for treating Alzheimer’s disease, eradicating HIV/AIDS, and boosting the efficacy of CAR-T cells in cancer immunotherapy.56,57 Subsequent analysis of GFP fluorescence by flow cytometry allowed for quantification of both the fluorescence (linked to protein expression) and the fraction of cells expressing levels of protein above baseline (percent transfection). CART−pDNA complexes were formulated at pH 5.5 in PBS before addition to cell culture media (pH ~ 7.4) because while the CARTs are relatively stable at low pH, it has been shown that the oligo(α-amino ester)s degrade over time through a series of intramolecular cyclizations when the pH is increased. Thus, complex formation at pH 5.5 favors protonation of secondary amines, minimizes rearrangement, and promotes complexation with the DNA cargo.
Briefly, CART-pPKCδ-GFP complexes were formed at a 25:1 charge ratio (+/−, assuming all ionizable cationic groups are protonated) and added to CHO-K1 cells (4 × 10⁴ cells/well in a 24-well plate) with a final concentration of 674 ng of pDNA. Cells were incubated with CART−pDNA complexes for 24 h before cell media was replaced and then allowed to incubate for another 24 h before expression of GFP resulting from treatment with the CART complexes was compared with expression from transfection of either pDNA alone or pDNA complexed with L2000. As expected, incubation with pDNA alone did not result in high expression. In contrast, the lipid-modified CARTs show varied transfection rates with some comparable to or better than the L2000 positive control (Figure 1). CART−pDNA complexes using 4, 5a, 5b, and 8 showed comparable fluorescence to naked pDNA or cells alone, while 3a resulted in fluorescence comparable to L2000. CART−pDNA complexes derived from 6a and 7 outperformed L2000. When comparing the CARTs that outperformed L2000, it was found that in general a slightly longer lipid block relative to the amine block resulted in greater uptake and expression. For a given lipid block, shorter CARTs were more effective than longer CARTs, with O11A9 (6a) resulting in more than double the fluorescence achieved with O22A29 (6b). Linoleyl CART 7 induced the highest GFP fluorescence, around 4-fold greater than the commercial reagent, followed by CART 6a with nearly double the fluorescence of L2000. With 15% and 24% transfection, respectively, 6a and 7 demonstrated higher transfection efficiency than L2000 (7% transfection, Figure S1). Interestingly, among the C18-lipidated oligomers (stearyl, oleyl, linoleyl; 5−7) unsaturation was correlated to more effective delivery. The generally high performance of the CARTs indicated that this lipophilic, degradable system is effective for the delivery of pDNA.
Figure 1.

Comparison of plasmid delivery efficiency of lipid-modified CARTs. Median fluorescence (normalized to L2000 treatment) in CHO-K1 cells treated with naked pPKCδ-GFP (pDNA alone), a L2000−pDNA complex (L2000), and CART−pDNA complexes (see nomenclature in Table 1) as measured by flow cytometry. All treatments were for 24 h and 1.35 ng/μL with respect to pDNA. Complexes were formulated at 25:1 (+/−) charge ratio. Error is expressed as ±SD and is the average of at least three experiments.
Another important requirement for a successful DNA delivery agent is low toxicity, which has thus far been a limitation for many cationic polymers. It was envisioned that due to their rapid rearrangement to a neutral small molecule (diketopiperazine), these CARTs would exhibit acceptable tolerability. The relative cytotoxicity of CARTs (3a−8) was evaluated by an MTT assay in treated CHO-K1 cells relative to untreated cells. Complexes were formulated at 25:1 (+/−) charge ratios with pPKCδ-GFP. Cells exposed to complexes exhibited viabilities comparable to untreated cells up to concentrations of 0.84 ng/μL with respect to pDNA (Figure S2). At higher concentrations (1.7 ng/μL, slightly greater than that used in the in vitro analyses by flow cytometry), cell viabilities for several CARTs dropped below 50%, but all CART complexes were less toxic than the commonly used L2000 reagent. Cells exposed to complexes of O11A9 (6a), one of the top performing CARTs, resulted in cell viabilities of ~80% even at concentrations of 1.7 ng/μL, which compares favorably with other DNA delivery systems, including L2000 (30% viability). In addition, the EC50 value of the decomposed product, diketopiperazine, alone is >500 μM.38 Even though pDNA delivery using 7 resulted in the greatest fluorescence, 6a was selected as the lead CART because it still achieved twice the fluorescence of L2000 and was better tolerated than 7.
To determine the influence of charge ratio on delivery by lead CART 6a and to optimize its performance, we varied the ratio of cationic oligomer to anionic DNA, testing ratios of 10:1, 25:1, and 50:1 (cation:anion, reported as theoretical charge ratio of cationic amines to phosphate anions). The resulting fluorescence signal (Figure 2A) peaked at a charge ratio of 25:1 (+/−), as compared to the optimal charge ratio of 10:1 for mRNA delivery.38
Figure 2.

Delivery of pPKCδ-GFP using CART 6a. (A) The effect of the theoretical cation:anion charge ratio on percent transfection of CHO-K1 cells treated with complexes of pPKCδ-GFP and 6a in 24-well plates. All treatments were for 24 h and 1.35 ng/μL with respect to pDNA. Error is expressed as ±SD. (B) Cartoon representation of the translocation assay: (1) transfection of CHO-K1 cells with CART-pPKCδ-GFP complexes, (2) expression of the PKCδ-GFP fusion protein, (3) translocation of the PKCδ-GFP fusion protein upon treatment with bryostatin 1. (C) Confocal microscopy image of CHO-K1 cells treated with 6a−pPKCδ-GFP complexes. Cells were imaged 48 h after transfection. (D) Confocal microscopy image of the same CHO-K1 cells 9 min after treatment with 200 nM bryostatin 1, a PKC modulator that induces the translocation of the PKCδ-GFP construct to the plasma membrane.
To further confirm that delivery of the plasmid into cells and its subsequent transcription and translation leads to a properly folded, fully functional protein, a translocation assay was also performed (Figure 2B). CHO-K1 cells treated with plasmid encoding PKCδ-GFP fusion protein (in complex with 6a, formed as described above) show cytosolic GFP fluorescence by confocal microscopy, indicating the resulting fusion protein construct is distributed throughout the cytoplasm (Figure 2C). As previously reported, upon addition of the PKC modulator bryostatin 1, real-time translocation of the PKC fusion protein to the plasma membrane is observed in less than 9 min (Figure 2D), indicating that not only is the fluorescent fusion protein expressed but that it is properly folded and functional.43,58 Similar results in the translocation assay were observed after transfection with CART 7 (Figure S4), further demonstrating that plasmid delivery by these CARTs leads to a functional protein.
The releasable transporters were also evaluated for their ability to deliver the PKCδ-GFP plasmid to human-derived HeLa and HEK293 cells as well as for their ability to deliver other plasmids of various sizes encoding GFP to CHO-K1 cells.
In all cell lines and with all plasmids tested, the best-performing transporters (6a and 7) displayed transfection efficiencies comparable to or higher than L2000, indicating the versatility of this delivery strategy for both human and nonhuman cell types (Figures S1 and S3 for flow cytometry data of cell line and plasmid screens, respectively).
Characterization of CART−DNA Complexes.
As CARTs are novel transporters for pDNA, we conducted several experiments to characterize the CART−pDNA complexes. Dynamic light scattering (DLS) was used to determine the average diameter of complexes between various CARTs and pPKCδ-GFP. Complexes were prepared in PBS, pH 5.5, at the same charge ratio found to be optimal in the in vitro pPKCδ- GFP delivery experiments (cation:anion ratio of 25:1). Their size was then measured by DLS after dilution in RNase-free water (Figure 3A). The hydrodynamic diameters for most of the CART−pDNA complexes were approximately 100 nm, with the exception of the complex with linoleyl oligomer 7. The extra unsaturation present in 7 may disrupt its packing around pDNA, thus resulting in larger particles. The observed hydrodynamic diameters are smaller than those of the analogous CART−mRNA complexes (~250 nm for 4 with EGFP mRNA); these observations were not unexpected as it has been shown that encapsulation in nanoparticles can cause the plasmids to supercoil, leading to smaller sizes.36,59 Perhaps due to the supercoiled nature of the plasmid, smaller polyplexes have been shown to better facilitate endocytosis.60 The size range was also confirmed by scanning electron microscopy (SEM) for the lead CART 6a (Figure 3B and Figure S5). The particles appeared spherical in shape with an average diameter of 100−200 nm, near the 89−121 nm size range measured by DLS.
Figure 3.

Characterization of CART−pDNA complexes. (A) Hydrodynamic diameter of selected CART−pDNA complexes determined by dynamic light scattering. (B) Scanning electron microscope (SEM) image of 6a−pPKCδ-GFP complex. (C) Time course of the zeta potential (mV) of selected CART−pDNA complexes.
The change in charge of the complexes was studied over time by determining the zeta potential. The initial surface charge started positive (varied based on the CART, ranging between +7 mV for 7 and +35 mV for 6a) and decreased to around −40 mV over the course of an hour (Figure 3C). This trend is consistent with the CARTs rearranging from cationic ammonium- to neutral amide-containing small molecules, leaving the surface primarily anionic due to the negatively charged nucleic acid cargo.
Delivery of DNA for Stable Expression.
To explore the versatility of CART-mediated DNA delivery, CART O11A9 6a was also evaluated for the transfer of transposon DNA for stable integration into cellular genomes. In transient gene expression, the transfected DNA remains episomal and is transferred to daughter cells during cell division early on but is lost over time, likely through dilution at each cell division. While it is possible to obtain low levels of stable expression of transferred DNA through random integration into the genome, and cotransfecting another gene encoding a selectable marker allows these rare events to be selected from among all transfected cells (e.g., resistance toward a certain toxin that is presented to the cell), this process is relatively inefficient, time-consuming, and labor-intensive.61 Viral systems have been used for gene delivery with high efficiency, but this requires stringent biosafety precautions and is time-consuming.
Nonviral gene delivery systems, like the Sleeping Beauty (SB) transposon system used here, are employed to increase the integration of transferred DNA and facilitate stable expression. These systems mediate DNA integration via a “cut-and-paste” mechanism.62,63 The transposable DNA element (or transposon) is a DNA sequence that can change its position within a genome depending on the activity of the transposase enzyme. The transposase recognizes the transposon’s flanking short inverted repeat/direct repeat (IR/DR) sequences and catalyzes its excision and subsequent insertion into genome wide locations that are widely distributed, albeit with a small but significant bias toward genes and upstream regulatory sequences.64 Thus, delivery of a plasmid containing a gene(s) of interest that is flanked by SB transposase IR/DR recognition sites together with the SB transposase, either encoded in the same plasmid (cis delivery) or in a second plasmid (trans delivery), into cells results in SB-mediated insertions of the gene(s) of interest into the cellular genome.63,65
While either cis or trans delivery can mediate transposition and long-term expression, the trans system is slightly more complex from a delivery standpoint, since two plasmids must simultaneously be delivered into individual cells for stable incorporation. However, we had previously shown that the CART delivery platform is effective for the codelivery of several mRNAs.38 We therefore applied CART O11A9 (6a) to the trans delivery of a SB transposon system consisting of a mix of two plasmids: one (pCMV-SB100) encoding the hyperactive SB100 transposase44 and the other (pKT2/CAGL=tTP) expressing a fusion protein consisting of firefly luciferase (fLuc) fused to tandem Tomato red fluorescent protein (tdTom),66 under control of the CAGGS promoter, and a second expression cassette for puromycin resistance, all of which is flanked by IR/ DR sites (Figure 4 and Table S1). After incubation with d-luciferin, capture and analysis of fLuc bioluminescence using BLI allowed for the quantitative comparison of the gene transfer efficiency into populations of cells over time. Both premixed plasmids must be successfully codelivered by the resulting CART complexes for long-term expression—in the absence of the pKT2/CAGL=tTP plasmid there would be no luciferase expression, and without the SB transposase plasmid there would be minimal stable incorporation of the fLuc=tdTom gene.
Figure 4.

Proposed CART delivery of SB transposon system and subsequent cut-and-paste mechanism of SB transposons.63,65 After CART-mediated delivery of the SB transposase-encoding plasmid to the cytoplasm, it is transported into the nucleus, transcribed, and translated, and transported back into the nucleus. There the SB transposase (blue) binds to inverted repeat/direct repeat (IR/DR) sequences (gray double arrows) flanking the gene of interest (red), precisely cuts the transposon out of the plasmid, and inserts it into the target DNA (shown as chromosomal DNA). SB transposons integrate into TA dinucleotide base pairs, which are duplicated on each end of the insertion site.63
To determine transfection conditions for the simultaneous delivery of two different plasmids, CART 6a−pDNA complexes were first formed at various charge ratios with the fLuc=tdTom SB transposon plasmid (pKT2/CAGL=tTP) mixed with the hyperactive SB transposase expression plasmid (pCMV- SB100).44 Interestingly, the optimal charge ratio (5:1 cation Delivery of the mixed transposon/transposase plasmids into CHO-K1 cells by a CART 6a−pDNA complex at a 5:1 (+/−) charge ratio resulted in 36% transfection by flow cytometry, outperforming the 17% transfection with L2000 (Figure S6). Using this 5:1 (+/−) charge ratio to compare stable transfection by the SB transposon system with unmediated plasmid integration alone, CART 6a−pDNA complexes were formed with either the fLuc=tdTom transposon plasmid alone or with the combined transposon and transposase plasmids. These 6a−pDNA complexes were then added to CHO-K1 cells (10 000 cells/well) with a final concentration of 137 ng pDNA (for pKT2/CAGL=tTP alone) or 171 ng pDNA (for combined plasmids) per well in a 96-well plate. Cells were incubated with complexes for 24 h, at which time the medium was changed and d-luciferin was added. The resultant luciferase expression (measured as bioluminescence intensity in photons/s/cm2/sr) was compared to expression resulting from transfection with the L2000 reagent. As anticipated, delivery of the fLuc=tdTom transposon plasmid alone, whether with L2000 or 6a, resulted in minimal expression (Figure 6, pDNA 1). In the absence of the SB transposase plasmid, the level of luciferase delivered by 6a follows the known dynamics for transient protein expression, with a maximum at day 2 followed by a significant drop by day 3, as both the unincorporated plasmid and resulting luciferase begin to degrade.67 With the SB transposase plasmid, however, the transposon containing fLuc and tdTomato RFP is stably incorporated, which was reflected in the high bioluminescence signal over time (Figure 6, pDNA mix). In this case, transfection with 6a resulted in no decrease in bioluminescence at day 3 and sustained levels of luciferase expression even after 6 days. The absence of an increase in signal beyond day 2 for the 6a−pDNA mix corresponds to the point at which cells became confluent, inhibiting further growth and luciferase expression. CART 6a also significantly out-performed L2000 for delivery of the mix of plasmids, with nearly a 100-fold increase in bioluminescence intensity after 2 days.
Figure 6.

Bioluminescence intensity of CHO-K1 cells transfected with fLuc=tdTom transposon plasmid alone (pDNA 1) or in a 2:1 mix with SB transposase plasmid (pDNA mix) over 6 days. All treatments were for 24 h, and 6a−pDNA complexes were formulated at 5:1 (+/−) charge ratio. Error is expressed as ±SD. Bioluminescence images representative of each transfection condition at the 3-day time point are shown below.
In an effort to understand the extent of stable transfection, several additional studies with the fLuc=tdTom SB transposon system were performed in CHO-K1 cells. The luciferase expression was examined in a multigenerational cellular study to further confirm incorporation into the cellular genome and transmission to daughter cells. Initially, we treated a single cell population (as described previously for the 2:1 SB transposon plasmid mix) with one of three conditions (L2000−pDNA, 6a−pDNA, or untreated). After 2 days, these initial wells (G1) were split 0.3:0.3:0.3:0.1, tripling the number of wells for the second generation (G2) while leaving 10% of cells in the original well (for plate layout see Figure S7). This scheme was carried out over a total of four generations (G1−G4) and 10 days and monitored by BLI. Summing the total bioluminescence over all four generations gave a general indication of the levels of stable transfection over time, with significantly greater bioluminescence resulting from transfection with 6a than L2000 (Figure 7). The bioluminescence of cells transfected with 6a peaked around 6 days and then remained fairly constant. A possible reason may be that the cells were not split after the fourth generation (G4), so it was no longer possible to observe increases in bioluminescence due to increased numbers of cells expressing luciferase, and it is likely that cell growth was limited by crowding and contact-inhibition in the wells.
Figure 7.

Total bioluminescence intensity of CHO-K1 cells transfected with the mixed fLuc=tdTom SB transposon system over 10 days broken down by generation (G1−G4), transfecting with either L2000 (orange) or 6a (blue) for 24 h. 6a−pDNA complexes were formulated at 5:1 (+/−) charge ratio.
Comparing the bioluminescence signals across the generations of cells treated with 6a−pDNA complexes, levels appear to be relatively consistent for all generations out to 10 days. This indicates stable incorporation of the luciferaseencoding transposon, as G1 is still expressing luciferase 10 days after transfection, and the cells in the fourth-generation wells, which were not directly transfected, are able to express luciferase three generations after the initial transfection. All together these results demonstrate the successful stable transfer of genetic material that is passed on to progeny cells over generations.
Stable transfection was further confirmed by selection with the antibiotic puromycin, as the SB transposon plasmid encoding fLuc and tdTom also confers puromycin resistance. CHO-K1 cells were transfected with the premixed fLuc=tdTom SB transposon system using either CART 6a or L2000, as previously described, followed by treatment with puromycin (6 μg/mL) over two generations to select for stably transfected cells. As was previously observed, transfection using CART 6a resulted in greater bioluminescence than L2000, and puromycin selection validated stable transfection by both methods (Figure S8). Additionally, the CART−pDNA complexes with the mixed SB transposon system resulted in improved cell viability relative to L2000 in CHO-K1 cells, comparable to the trends observed with CART−pPKCδ-GFP complexes (Figure S9).
Uptake Mechanism of Complexes.
To explore the mechanism of cellular uptake for the CART−pDNA complexes, the fLuc=tdTom transposon plasmid (pKT2/CAGL=tTP) was delivered to CHO-K1 cells using the lead CART 6a at 4 °C (a condition known to inhibit endosomal uptake pathways), and the bioluminescence observed after incubation with d-luciferin was compared to that from cells treated at 37 °C (Figure 8).68,69 The lower temperature resulted in significantly decreased bioluminescence (reduced approximately to the level of untreated cells) as compared to uptake at 37 °C, indicating that endocytosis is a major contributor to the cellular uptake of the CART 6a−pDNA complexes. The uptake mechanism of the CART−pDNA complexes into CHO-K1 cells was further studied using a lysosomotropic agent, chloroquine,70,71 as well as uptake inhibitors including 5 mM methyl-β-cyclodextrin (inhibits clathrin-independent endocytosis),72 1 mM amiloride (inhibits macropinocytosis),73 and 0.1% sodium azide (induces ATP depletion)74 (Figure S10). While amiloride and methyl-β-cyclodextrin resulted in no significant change in luciferase expression, incubation with 0.1% sodium azide resulted in a 27% reduction in luciferase expression indicating the uptake is partially ATP dependent. Treatment with 100 μM chloroquine, which often enhances gene delivery due to increased endosomal buffering and rupture,71 actually resulted in a 26% reduction in protein expression. It has previously been shown for the corresponding CART−mRNA complexes that the chloroquine treatment condition also decreased protein expression (22% reduction).38 This result further demonstrates that CARTs are not limited by endosomal escape unlike many transfection reagents.
Figure 8.

Comparison of cellular uptake of 6a−pDNA complexes at 37 or 4 °C. Complexes were formulated at 5:1 (+/−) charge ratio. Error is expressed as ±SD. The reduction in bioluminescence intensity for complexes treated at 4 °C indicates that endocytotic mechanisms are required for the uptake of the 6a−pDNA complexes.
CONCLUSIONS
The development of safe, synthetically accessible, and efficacious nonviral agents for DNA delivery is critically needed to address the emerging research and biomedical opportunities associated with gene therapy and DNA vaccinations. Because electrostatic polycation−polyanion interactions enable DNA complexation but often hinder DNA release, we developed dynamic delivery systems that transform from polycationic to neutral byproducts over time, thereby releasing free DNA. Here, we show that these charge-altering releasable transporter (CART) systems can be used for the delivery of pDNA. We designed and synthesized a diverse library of lipid-modified CARTs with variable physical properties for the transfection of DNA. We investigated variations in the lipid side chain, transporter composition, and conditions for the complexation and delivery of pDNA to cells. The best-performing CARTs were shown to facilitate efficient pDNA delivery in multiple cell lines, and both outperformed and were less toxic than the commercial transfection agent Lipofectamine 2000 in CHO-K1 cells. CART O11A9 (6a) was selected as the lead for further studies as it exhibited greater in vitro tolerability than CART 7 with comparable delivery efficiency. CART 6a was used with a Sleeping Beauty transposon system to achieve stable (long-term) gene transfer, which gives promise for its use in various biomedical applications. These CARTs thus are directly applicable to in vitro DNA delivery studies. Ex vivo as well as in vivo transfection-based therapies are currently being explored.
Supplementary Material
Figure 5.

Bioluminescence intensity of CHO-K1 cells transfected with a 2:1 mixture of fLuc=tdTom transposon and SB transposase plasmids (pDNA mix) using 6a at various charge ratios. Error is expressed as ±SD.
ACKNOWLEDGMENTS
This work was supported in part by NIH Grants R01CA031845, NIHCA031841, and AI124743 (P.A.W.) as well as Department of Energy Grant DE-SC0018168 (R.M.W) and National Science Foundation Grant NSF CHE-1607092 (R.M.W.). This work was also funded by the Chambers Family Foundation for Excellence in Pediatric Research (C.H.C) and the Child Health Research Institute at Stanford University (C.H.C). The authors acknowledge the use of instruments from the Cell Sciences Imaging Facility (CSIF), supported by National Center for Research Resources Award 1S10OD010580, and the Stanford Shared FACS facility, obtained using funds from the NIH Shared Instrument Grant S10RR027431–01. We gratefully acknowledge Dr. Lydia-Marie Joubert for assistance with FESEM images, Dr. Lynette Cegelski for tissue culture equipment and a plate reader, and Dr. Richard Zare for the use of the Malvern Zetasizer DLS. Additionally, we gratefully acknowledge K. Pedram for the BDK initiator and T. Blake for CART 4. We also thank Drs. Tobias Meyer, Maria Barna, Peter Kim (all Stanford University), and Zsuzsanna Izsvak (Max Delbrück Center for Molecular Medicine, Berlin, Germany) for providing plasmid DNA and Dr. Masamitsu Kanada (Michigan State University) for help with the plasmid cloning.
ABBREVIATIONS
- DLS
dynamic light scattering
- L2000
Lipofectamine 2000
- SB
Sleeping Beauty
Footnotes
The authors declare no competing financial interest.
Supporting Information
The Supporting Information is available free of charge on the ACS Publications website at DOI: 10.1021/acs.biomac.8b00401.
Full descriptions of plasmids, detailed synthetic procedures, monomer and co-oligomer characterization, cytotoxicity assays, SEM images, and expanded in vitro data for the SB transposon system (PDF)
REFERENCES
- (1).ClinicalTrials.gov; https://clinicaltrials.gov/ct2/results?cond=&term=gene+therapy&cntry1=&state1=&recrs= (accessed July 25, 2017).
- (2).Shi B; Zheng M; Tao W; Chung R; Jin D; Ghaffari D; Farokhzad OC Challenges in DNA Delivery and Recent Advances in Multifunctional Polymeric DNA Delivery Systems. Biomacromolecules 2017, 18, 2231–2246. [DOI] [PubMed] [Google Scholar]
- (3).Yin H; Xue W; Chen S; Bogorad RL; Benedetti E; Grompe M; Koteliansky V; Sharp PA; Jacks T; Anderson DG Genome Editing with Cas9 in Adult Mice Corrects a Disease Mutation and Phenotype. Nat. Biotechnol 2014, 32 (6), 551–553. [DOI] [PMC free article] [PubMed] [Google Scholar]
- (4).Bakondi B; Lv W; Lu B; Jones MK; Tsai Y; Kim KJ; Levy R; Akhtar AA; Breunig JJ; Svendsen CN; Wang S In Vivo CRISPR/Cas9 Gene Editing Corrects Retinal Dystrophy in the S334ter-3 Rat Model of Autosomal Dominant Retinitis Pigmentosa. Mol. Ther 2016, 24 (3), 556–563. [DOI] [PMC free article] [PubMed] [Google Scholar]
- (5).Lechardeur D; Sohn K-J; Haardt M; Joshi PB; Monck M; Graham RW; Beatty B; Squire J; O’Brodovich H; Lukacs GL Metabolic Instability of Plasmid DNA in the Cytosol: A Potential Barrier to Gene Transfer. Gene Ther 1999, 6 (4), 482–497. [DOI] [PubMed] [Google Scholar]
- (6).Kawabata K; Takakura Y; Hashida M The Fate of Plasmid DNA After Intravenous Injection in Mice: Involvement of Scavenger Receptors in Its Hepatic Uptake. Pharm. Res 1995, 12 (6), 825–830. [DOI] [PubMed] [Google Scholar]
- (7).Prazeres D; Monteiro G Plasmid Biopharmaceuticals. Microbiol Spectrum 2014, 2 (3), 1–16. [DOI] [PubMed] [Google Scholar]
- (8).Draghici B; Ilies MA Synthetic Nucleic Acid Delivery Systems: Present and Perspectives. J. Med. Chem 2015, 58 (10), 4091–4130. [DOI] [PubMed] [Google Scholar]
- (9).Wang L; Li F; Dang L; Liang C; Wang C; He B; Liu J; Li D; Wu X; Xu X; Lu A; Zhang G In Vivo Delivery Systems for Therapeutic Genome Editing. Int. J. Mol. Sci 2016, 17 (5), 626. [DOI] [PMC free article] [PubMed] [Google Scholar]
- (10).Mehier-Humbert S; Guy RH Physical Methods for Gene Transfer: Improving the Kinetics of Gene Delivery into Cells. Adv. Drug Delivery Rev 2005, 57 (5), 733–753. [DOI] [PubMed] [Google Scholar]
- (11).al Yacoub N; Romanowska M; Haritonova N; Foerster J Optimized Production and Concentration of Lentiviral Vectors Containing Large Inserts. J. Gene Med 2007, 9 (7), 579–584. [DOI] [PubMed] [Google Scholar]
- (12).Cotrim AP; Baum BJ Gene Therapy: Some History, Applications, Problems, and Prospects. Toxicol. Pathol 2008, 36 (1), 97–103. [DOI] [PubMed] [Google Scholar]
- (13).Bouard D; Alazard-Dany D; Cosset F-L Viral Vectors: From Virology to Transgene Expression. Br. J. Pharmacol 2009, 157, 153–165. [DOI] [PMC free article] [PubMed] [Google Scholar]
- (14).Li Y; Humphries B; Wang Z; Lang S; Huang X; Xiao H; Jiang Y; Yang C Complex Coacervation-Integrated Hybrid Nanoparticles Increasing Plasmid DNA Delivery Efficiency in Vivo . ACS Appl. Mater. Interfaces 2016, 8 (45), 30735–30746. [DOI] [PMC free article] [PubMed] [Google Scholar]
- (15).Obata Y; Suzuki D; Takeoka S Evaluation of Cationic Assemblies Constructed with Amino Acid Based Lipids for Plasmid DNA Delivery. Bioconjugate Chem 2008, 19 (5), 1055–1063. [DOI] [PubMed] [Google Scholar]
- (16).Sprouse D; Reineke TM Investigating the Effects of Block versus Statistical Glycopolycations Containing Primary and Tertiary Amines for Plasmid DNA Delivery. Biomacromolecules 2014, 15 (7), 2616–2628. [DOI] [PMC free article] [PubMed] [Google Scholar]
- (17).Fatieiev Y; Croissant JG; Alsaiari S; Moosa BA; Anjum D; Khashab NM Photoresponsive Bridged Silsesquixane Nanoparticles with Tunable Morpholagy for Light-Triggered Plasmid DNA Delivery. ACS Appl. Mater. Interfaces 2015, 7, 24993–24997. [DOI] [PubMed] [Google Scholar]
- (18).ur Rehman Z; Zuhorn IS; Hoekstra D How Cationic Lipids Transfer Nucleic Acids into Cells and Across Cellular Membranes: Recent Advances. J. Controlled Release 2013, 166 (1), 46–56. [DOI] [PubMed] [Google Scholar]
- (19).Dalby B; Cates S; Harris A; Ohki EC; Tilkins ML; Price PJ; Ciccarone VC Advanced Transfection with Lipofectamine 2000 Reagent: Primary Neurons, siRNA, and High-Throughput Applications. Methods 2004, 33 (2), 95–103. [DOI] [PubMed] [Google Scholar]
- (20).Mintzer MA; Simanek EE Nonviral Vectors for Gene Delivery. Chem. Rev 2009, 109 (2), 259–302. [DOI] [PubMed] [Google Scholar]
- (21).Yamagata M; Kawano T; Shiba K; Mori T; Katayama Y; Niidome T Structural Advantage of Dendritic Poly(l-lysine) for Gene Delivery into Cells. Bioorg. Med. Chem 2007, 15 (1), 526–532. [DOI] [PubMed] [Google Scholar]
- (22).Bansal R; Tripathi SK; Gupta KC; Kumar P Lipophilic and Cationic Triphenylphosphonium Grafted Linear Polyethylenimine Polymers for Efficient Gene Delivery to Mammalian Cells. J. Mater. Chem 2012, 22 (48), 25427–25436. [Google Scholar]
- (23).Valencia-Serna J; Gul-Uludağ H; Mahdipoor P; Jiang X; Uludağ H Investigating siRNA Delivery to Chronic Myeloid Leukemia K562 Cells with Lipophilic Polymers for Therapeutic BCR-ABL Down-Regulation. J. Controlled Release 2013, 172 (2), 495–503. [DOI] [PubMed] [Google Scholar]
- (24).Deronde BM; Posey ND; Otter R; Caffrey LM; Minter LM; Tew GN Optimal Hydrophobicity in Ring-Opening Metathesis Polymerization-Based Protein Mimics Required for siRNA Internalization. Biomacromolecules 2016, 17 (6), 1969–1977. [DOI] [PMC free article] [PubMed] [Google Scholar]
- (25).Louzao I; Garcia-Fandino R; Montenegro J Hydrazone- Modulated Peptides for Efficient Gene Transfection. J. Mater. Chem. B 2017, 5, 4426–4434. [DOI] [PubMed] [Google Scholar]
- (26).Schaffert D; Troiber C; Wagner E New Sequence-Defined Polyaminoamides with Tailored Endosomolytic Properties for Plasmid DNA Delivery. Bioconjugate Chem 2012, 23 (6), 1157–1165. [DOI] [PubMed] [Google Scholar]
- (27).Incani V; Tunis E; Clements BA; Olson C; Kucharski C; Lavasanifar A; Uludag H Palmitic Acid Substitution on Cationic Polymers for Effective Delivery of Plasmid DNA to Bone Marrow Stromal Cells. J. Biomed. Mater. Res, Part A 2007, 81A (2), 493–504. [DOI] [PubMed] [Google Scholar]
- (28).Kim HJ; Ishii A; Miyata K; Lee Y; Wu S; Oba M; Nishiyama N; Kataoka K Introduction of Stearoyl Moieties into a Biocompatible Cationic Polyaspartamide Derivative, PAsp(DET), with Endosomal Escaping Function for Enhanced siRNA Mediated Gene Knockdown. J. Controlled Release 2010, 145 (2), 141–148. [DOI] [PubMed] [Google Scholar]
- (29).Kuchelmeister HY; Karczewski S; Gutschmidt A; Knauer S; Schmuck C Utilizing Combinatorial Chemistry and Rational Design: Peptidic Tweezers with Nanomolar Affinity to DNA Can Be Transformed into Efficient Vectors for Gene Delivery by Addition of a Lipophilic Tail. Angew. Chem., Int. Ed 2013, 52 (52), 14016–14020. [DOI] [PubMed] [Google Scholar]
- (30).Wu Y; Smith AE; Reineke TM Lipophilic Polycation Vehicles Display High Plasmid DNA Delivery to Multiple Cell Types. Bioconjugate Chem 2017, 28 (8), 2035–2040. [DOI] [PubMed] [Google Scholar]
- (31).Luten J; van Nostrum C; De Smedt SC; Hennink WE Biodegradable Polymers as Non-Viral Carriers for Plasmid DNA Delivery. J. Controlled Release 2008, 126, 97–110. [DOI] [PubMed] [Google Scholar]
- (32).Sparks J; Scholz C Evaluation of Cationic Poly(β- hydroxyalkanoate) as a Plasmid DNA Delivery System. Biomacromolecules 2009, 10, 1715–1719. [DOI] [PubMed] [Google Scholar]
- (33).Xu P; Li S-Y; Li Q; Ren J; Van Kirk EA; Murdoch WJ; Radosz M; Shen Y Biodegradable Cationic Polyester as an Efficient Carrier for Gene Delivery to Neonatal Cardiomyocytes. Biotechnol. Bioeng 2006, 95 (5), 893–903. [DOI] [PubMed] [Google Scholar]
- (34).Green JJ; Langer R; Anderson DG A Combinatorial Polymer Library Approach Yields Insight into Nonviral Gene Delivery. Acc. Chem. Res 2008, 41 (6), 749–759. [DOI] [PMC free article] [PubMed] [Google Scholar]
- (35).Nelson AM; Pekkanen AM; Forsythe NL; Herlihy JH; Zhang M; Long TE Synthesis of Water-Soluble Imidazolium Polyesters as Potential Nonviral Gene Delivery Vehicles. Biomacromolecules 2017, 18 (1), 68–76. [DOI] [PubMed] [Google Scholar]
- (36).Lynn D; Langer R Degradable Poly(β-amino esters): Synthesis, Characterization, and Self-Assembly with Plasmid DNA. J. Am. Chem. Soc 2000, 122, 10761–10768. [Google Scholar]
- (37).Keeney M; Ong S; Padilla A; Yao Z; Goodman S; Wu J; Yang F Development of Poly(β-amino ester)-Based Biodegradable Nanoparticles for Nonviral Delivery of Minicircle DNA. ACS Nano 2013, 7, 7241–7250. [DOI] [PMC free article] [PubMed] [Google Scholar]
- (38).McKinlay CJ; Vargas JR; Blake TR; Hardy JW; Kanada M; Contag CH; Wender PA; Waymouth RM Charge-Altering Releasable Transporters (CARTs) for the Delivery and Release of mRNA in Living Animals. Proc. Natl. Acad. Sci. U. S. A 2017, 114 (4), E448–E456. [DOI] [PMC free article] [PubMed] [Google Scholar]
- (39).Blake TR; Waymouth RM Organocatalytic Ring-Opening Polymerization of Morpholinones: New Strategies to Functionalized Polyesters. J. Am. Chem. Soc 2014, 136 (26), 9252–9255. [DOI] [PubMed] [Google Scholar]
- (40).Pratt RC; Nederberg F; Waymouth RM; Hedrick JL Tagging Alcohols with Cyclic Carbonate: A Versatile Equivalent of (meth)acrylate for Ring-Opening Polymerization. Chem. Commun 2008, 1, 114–116. [DOI] [PubMed] [Google Scholar]
- (41).Pratt RC; Lohmeijer BGG; Long DA; Lundberg PNP; Dove AP; Li H; Wade CG; Waymouth RM; Hedrick JL Exploration, Optimization, and Application of Supramolecular Thiourea−Amine Catalysts for the Synthesis of Lactide (Co)polymers. Macromolecules 2006, 39 (23), 7863–7871. [Google Scholar]
- (42).Geihe EI; Cooley CB; Simon JR; Kiesewetter MK; Edward JA; Hickerson RP; Kaspar RL; Hedrick JL; Waymouth RM; Wender PA Designed Guanidinium-Rich Amphipathic Oligocarbonate Molecular Transporters Complex, Deliver and Release siRNA in Cells. Proc. Natl. Acad. Sci. U. S. A 2012, 109 (33), 13171–13176. [DOI] [PMC free article] [PubMed] [Google Scholar]
- (43).Wender PA; Hardman CT; Ho S; Jeffreys MS; Maclaren JK; Quiroz RV; Ryckbosch SM; Shimizu AJ; Sloane JL; Stevens MC Scalable Synthesis of Bryostatin 1 and Analogs, Adjuvant Leads Against Latent HIV. Science 2017, 358 (6360), 218–223. [DOI] [PMC free article] [PubMed] [Google Scholar]
- (44).Mâtés L; Chuah MK; Belay E; Jerchow B; Manoj N; Acosta-Sanchez A; Grzela DP; Schmitt A; Becker K; Matrai J; Ma L; Samara-Kuko E; Gysemans C; Pryputniewicz D; Miskey C; Fletcher B; VandenDriessche T; Ivics Z; Izsvak Z Molecular Evolution of a Novel Hyperactive Sleeping Beauty Transposase Enables Robust Stable Gene Transfer in Vertebrates. Nat. Genet 2009, 41, 753–761. [DOI] [PubMed] [Google Scholar]
- (45).Multhaup M; Karlen AD; Swanson DL; Wilber A; Somia NV; Cowan MJ; McIvor RS Cytotoxicity Associated with Artemis Overexpression After Lentiviral Vector-Mediated Gene Transfer. Hum. Gene Ther 2010, 21, 865–875. [DOI] [PMC free article] [PubMed] [Google Scholar]
- (46).Mosmann TJ Rapid Colorimetric Assay for Cellular Growth and Survival: Application to Proliferation and Cytotoxicity Assays. J. Immunol. Methods 1983, 65, 55–63. [DOI] [PubMed] [Google Scholar]
- (47).Dove AP; Pratt RC; Lohmeijer BGG; Waymouth RM; Hedrick JL Thiourea-Based Bifunctional Organocatalysis: Supramolecular Recognition for Living Polymerization. J. Am. Chem. Soc 2005, 127 (40), 13798–13799. [DOI] [PubMed] [Google Scholar]
- (48).Kamber NE; Jeong W; Waymouth RM; et al. Organocatalytic Ring-Opening Polymerization. Chem. Rev 2007, 107, 5813–5840. [DOI] [PubMed] [Google Scholar]
- (49).Siprashvili Z; Scholl FA; Oliver SF; Adams A; Contag CH; Wender PA; Khavari PA Gene Transfer via Reversible Plasmid Condensation with Cysteine-Flanked, Internally Spaced Arginine-Rich Peptides. Hum. Gene Ther 2003, 14 (13), 1225–1233. [DOI] [PubMed] [Google Scholar]
- (50).Alshamsan A; Haddadi V; Incani V; Samuel J; Lavasanifar A; Uludağ H Formulation and Delivery of siRNA by Oleic Acid and Stearic Acid Modified Polyethyleneimine. Mol. Pharmaceutics 2009, 6, 121–133. [DOI] [PubMed] [Google Scholar]
- (51).Futaki S; Ohashi W; Suzuki T; Niwa M; Tanaka S; Ueda K; Harashima H; Sugiura Y Stearylated Arginine-Rich Peptides: A New Class of Transfection Systems. Bioconjugate Chem 2001, 12, 1005–1011. [DOI] [PubMed] [Google Scholar]
- (52).Maslov MA; Zenkova MA Non-Viral Gene Delivery Systems Based on Cholesterol Cationic Lipids: Structure-Activity Relationships INTECH Open Access Publisher; InTech: 2011. [Google Scholar]
- (53).Zhang G; Chen J; Payne SJ; Kooi SE; Demas JN; Fraser CL Multi-Emissive Difluoroboron Dibenzoylmethane Polylactide Exhibiting Intense Fluorescence and Oxygen-Sensitive Room-Temperature Phosphorescence. J. Am. Chem. Soc 2007, 129 (29), 8942–8943. [DOI] [PubMed] [Google Scholar]
- (54).Codazzi F; Teruel MN; Meyer T Control of Astrocyte Ca(2+) Oscillations and Waves by Oscillating Translocation and Activation of Protein Kinase C. Curr. Biol 2001, 11 (14), 1089–1097. [DOI] [PubMed] [Google Scholar]
- (55).Wender PA; Baryza JL; Brenner SE; Clarke MO; Craske ML; Horan JC; Meyer T Function-Oriented Synthesis: The Design, Synthesis, PKC Binding and Translocation Activity of a New Bryostatin Analog. Curr. Drug Discovery Technol 2004, 1, 1–11. [DOI] [PubMed] [Google Scholar]
- (56).Wender PA; Baryza JL; Brenner SE; DeChristopher BA; Loy BA; Schrier AJ; Verma VA Design, Synthesis, and Evaluation of Potent Bryostatin Analogs that Modulate PKC Translocation Selectivity. Proc. Natl. Acad. Sci. U. S. A 2011, 108 (17), 6721–6726. [DOI] [PMC free article] [PubMed] [Google Scholar]
- (57).Biberacher V; Decker T; Oelsner M; Wagner M; Bogner C; Schmidt B; Kreitman RJ; Peschel C; Pastan I; zum Büschenfelde CM; Ringshausen I The Cytotoxicity of Anti-CD22-Immunotoxin is Enhanced by Bryostatin 1 in B-Cell Lymphomas Through CD22 Upregulation and PKC-βII Depeletion. Haematologica 2012, 97 (5), 771–779. [DOI] [PMC free article] [PubMed] [Google Scholar]
- (58).Baryza JL; Brenner SE; Craske ML; Meyer T; Wender PA Simplified Analogs of Bryostatin with Anticancer Activity Display Greater Potency for Translocation of PKCδ-GFP. Chem. Biol 2004, 11 (9), 1261–1267. [DOI] [PubMed] [Google Scholar]
- (59).Bhise NS; Shmueli RB; Gonzalez J; Green JJ A Novel Assay for Quantifying the Number of Plasmids Encapsulated by Polymer Nanoparticles. Small 2012, 8 (3), 367–373. [DOI] [PMC free article] [PubMed] [Google Scholar]
- (60).Gebhart CL; Kabanov AV Evaluation of Polyplexes as Gene Transfer Agents. J. Controlled Release 2001, 73 (2), 401–416. [DOI] [PubMed] [Google Scholar]
- (61).Huang X; Wilber AC; Bao L; Tuong D; Tolar J; Orchard PJ; Levine BL; June CH; McIvor RS; Blazar BR; Zhou X Stable Gene Transfer and Expression in Human Primary T Cells by the Sleeping Beauty Transposon System. Blood 2006, 107 (2), 483–491. [DOI] [PMC free article] [PubMed] [Google Scholar]
- (62).Ivics Z; Hackett PB; Plasterk RH; Izsvák Z Molecular Reconstruction of Sleeping Beauty, a Tc1-like Transposon from Fish, and Its Transposition in Human Cells. Cell 1997, 91 (4), 501–510. [DOI] [PubMed] [Google Scholar]
- (63).Hackett PB; Ekker SC; Largaespada DA; McIvor RS Sleeping Beauty Transposon-Mediated Gene Therapy for Prolonged Expression. Adv. Genet 2005, 54, 189–232. [DOI] [PubMed] [Google Scholar]
- (64).Yant SR; Wu X; Huang Y; Garrison B; Burgess SM; Kay MA High-Resolution Genome-Wide Mapping of Transposon Integration in Mammals. Mol. Cell. Biol 2005, 25 (6), 2085–2094. [DOI] [PMC free article] [PubMed] [Google Scholar]
- (65).Hudecek M; Izsvák Z; Johnen S; Renner M; Thumann G; Ivics Z Going Non-Viral: The Sleeping Beauty Transposon System Breaks on through to the Clinical Side. Crit. Rev. Biochem. Mol. Biol 2017, 52 (4), 355–380. [DOI] [PubMed] [Google Scholar]
- (66).Patel MR; Chang YF; Chen IY; Bachmann MH; Yan X; Contag CH; Gambhir SS Longitudinal, Noninvasive Imaging of T-Cell Effector Function and Proliferation in Living Subjects. Cancer Res 2010, 70, 10141–10149. [DOI] [PMC free article] [PubMed] [Google Scholar]
- (67).Zou S; Scarfo K; Nantz MH; Hecker JG Lipid-Mediated Delivery of RNA is More Efficient than Delivery of DNA in Non- Dividing Cells. Int. J. Pharm 2010, 389 (1−2), 232–243. [DOI] [PMC free article] [PubMed] [Google Scholar]
- (68).Weigel PH; Oka JA Temperature Dependence of Endocytosis Mediated by the Asialoglycoprotein Receptor in Isolated Rat Hepatocytes. Evidence for Two Potentially Rate-Limiting Steps. J. Biol. Chem 1981, 256 (6), 2615–2617. [PubMed] [Google Scholar]
- (69).Wender PA; Galliher WC; Goun EA; Jones LR; Pillow TH The Design of Guanidinium-Rich Transporters and their Internalization Mechanisms. Adv. Drug Delivery Rev 2008, 60 (4−5), 452–472. [DOI] [PMC free article] [PubMed] [Google Scholar]
- (70).Erbacher P; Roche AC; Monsigny M; Midoux P Putative Role of Chloroquine in Gene Transfer into a Human Hepatoma Cell Line by DNA/Lactosylated Polylysine Complexes. Exp. Cell Res 1996, 225 (1), 186–194. [DOI] [PubMed] [Google Scholar]
- (71).Akinc A; Thomas M; Klibanov AM; Langer R Exploring Polyethylenimine-Mediated DNA Transfection and the Proton Sponge Hypothesis. J. Gene Med 2005, 7 (5), 657–653. [DOI] [PubMed] [Google Scholar]
- (72).Vercauteren D; Vandenbroucke RE; Jones AT; Rejman J; Demeester J; De Smedt SC; Sanders NN; Braeckmans K The Use of Inhibitors to Study Endocytotic Pathways of Gene Carriers: Optimization and Pitfalls. Mol. Ther 2010, 18 (3), 561–569. [DOI] [PMC free article] [PubMed] [Google Scholar]
- (73).Huang K; Jacobs M; Rzayev J De Novo Synthesis and Cellular Uptake of Organic Nanocapsules with Tunable Surface Chemistry. Biomacromolecules 2011, 12, 2327–2334. [DOI] [PubMed] [Google Scholar]
- (74).Sandvig K; Olsnes S Entry of the Toxic Proteins Abrin, Modeccin, Ricin, and Diphtheria Toxin into Cells. II. Effect of pH, Metabolic Inhibitors, and Ionophores and Evidence for Toxin Penetration from Endocytotic Vesicles. J. Biol. Chem 1982, 257, 7504–7513. [PubMed] [Google Scholar]
Associated Data
This section collects any data citations, data availability statements, or supplementary materials included in this article.