Abstract
We have examined in situ detection of hepatitis B virus 1762T/1764A double mutation (HBVDM) in urine using a (Pb(Mg1/3Nb2/3)O3)0.65(PbTiO3)0.35 (PMN-PT) piezoelectric plate sensor (PEPS) coated with a 16-nucleotide (nt) probe DNA (pDNA) complementary to the HBVDM. The in situ mutation (MT) detection was carried out in a flow with the PEPS vertically situated at the center of the flow in a background of the wild type (WT). For validation, the detection was followed with detection in the mixture of MT fluorescent reporter microspheres (FRMs) (MT FRMs) and WT FRMs that emitted different fluorescent colours and were designed to specifically bind to MT and WT, respectively. At 30°C and 4 ml/min, a PEPS was shown to specifically detect HBVDM in situ with 60 copies/ml analytical sensitivity in a background of clinically-relevant 250-fold more WT in 30 min without DNA isolation, amplification, or labelling as validated by the visualization of the captured MT FRMs and WT FRMs following the FRMs detection where the captured MT FRMs outnumbered WT FRMs by a factor of 5 to 1.
Introduction
Detection of gene mutations and epigenetic changes is important for cancer diagnosis and treatment. Genetic analyses of cancer typically rely on gene sequencing of high-quality solid-tumor samples where cancer cells constitute more than 50% of the cells. The challenge for gene sequencing of solid tumor samples is that once the primary tumor is removed by surgery there are no more tumor samples for further gene analysis for treatment decision and monitoring, or recurrence detection. Furthermore, the biopsy procedures used for cancers of the internal organs are highly intrusive and expensive. These limitations make it highly desirable to use blood or urine for cancer genetic analysis.
Polymer chain reaction (PCR) has been the method of detecting circulating deoxyribonucleic acid (DNA) markers in serum or urine. To detect gene mutation, PCR typically involves melting temperature control to differentiate mutant (MT) from wild type (WT), the normal form of the gene. So far, detecting mutations in sera or urine has been challenging because (A) the melting-temperature difference between the MT and the WT can be only a few degrees1, (B) the concentrations of circulating MT markers are exceeding low (much lower than 10−18 M or 600 copies/ml), (C) circulating MT markers are typically outnumbered by the WT by a factor of 240 or larger2. The combinations of those factors make it difficult to detect circulating mutations sensitively and specifically. Recent studies indicated that circulating DNA can pass through kidneys and exist in urine in the form of short fragments often less than 200 base pairs (bp)3 which presents an additional challenge for PCR as PCR needs two primers and one probe for reliable amplification and detection. Within a small fragment, the mutation site is not likely at the center of the fragment, making it difficult for a small fragment to completely overlap with the two primers and the probe2. As a result, not all fragments will be amplified to allow detection. Therefore, if there is a genetic detection method that can detect genetic mutations from short DNA fragments of less than 200 bp at concentrations lower than aM (10−18 M) and in a background of more than 240-fold wild type (WT) without the need of DNA isolation and DNA amplification it would be ideal for reliably detecting circulating genetic alterations in urine to help cancer diagnosis and treatment decision and monitoring.
Genetic detection technologies currently under development rely on fluorescence4, quartz crystal microbalance (QCM)5, 6, electrochemical7, binding to nano-metal particles8, surface plasmon resonance (SPR)9, silicon-based microcantilever sensor as well as piezoelectric microcantilever sensor. For DNA detection, nanoparticle-amplified QCM exhibited a concentration sensitivity of 1 pM10. Nanoparticle enhanced SPR exhibited concentration sensitivity of 10–100 aM11. The electrochemical methods involving nanofibers and nanotubes also exhibited concentration sensitivity on the order of 30 fM12. Nanowires13–17, and nanotubes18, 19 exhibited concentration sensitivity ranging from 100 fM to 1 fM. Microcantilevers coupled with nano-metal particles exhibited 0.01 nM concentration sensitivity20. Although many of these methods--e.g., QCM, SPR, silicon-based microcantilever sensor as well as lead zirconate titanate (PZT) piezoelectric microcantilver sensor (PEMS)21, 22--are label-free, the sensitivity was still many orders of magnitude away from the attomolar (aM, or 10−18 M) requirement. Similarly, the 10−16 M sensitivity achieved by magnetic beads isolation coupled with electrochemical enhancement was still not sufficient23. Nano-scale mechanical imaging by atomic force microscopy (AFM) could differentiate unhybridized single-stranded DNAs (ssDNAs) from hybridized double-stranded DNAs (dsDNAs) at aM (10−18 M) sensitivity but it required sophisticated instrument such as AFM24. Carbon nanotube impedance biosensors exhibited 100 aM sensitivity in DNA detection, which was insufficient for clinical applications25. GaN nanowire extended-gate field-effect-transistors26 and streptavidin horseradish peroxidase functionalized carbon nanotubes27 have aM sensitivity in DNA detection. However, these detections are not in situ and typically require tedious washing steps before the measurements can be made. Peptide nucleic acid (PNA) probe-enhanced electrochemical biosensors based on an integrated chip also exhibited aM sensitivity. However, they also required washing28. Recently a disposable electrochemical biosensor based on magnetic bead amplification and target DNA biotinylation exhibited aM sensitivity29. However, it also required multiple steps of amplification and biotinylation of the target DNA29. Note all the above sensors under development only addressed the hybridization detection and have not addressed the crucial challenge of differentiating the mutated gene from the WT. Let alone doing so in the blood or urine.
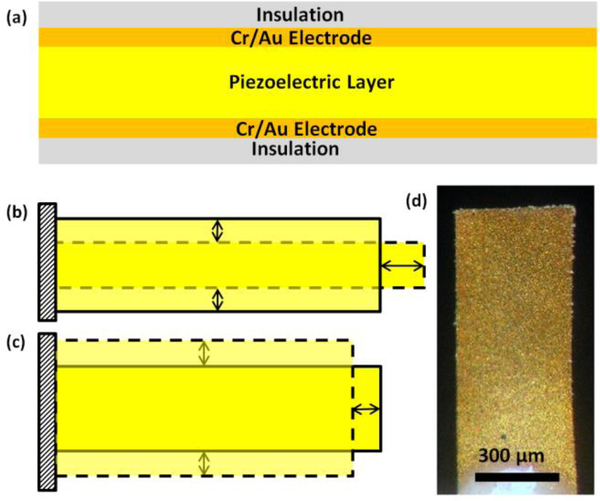
Lead magnesium niobate–lead titanate (Pb(Mg1/3Nb2/3)O3)0.65(PbTiO3)0.35 (PMN-PT) piezoelectric plate sensors (PEPS) consisting of a PMN-PT freestanding film 8 μm in thickness30 thinly coated with gold electrodes on the two major surfaces and encapsulated with a thin electrical insulation as schematically shown in Fig 1a are a new type of sensor. By covalently immobilizing a probe DNA (pDNA) complementary to a target DNA (tDNA) and immersing the pDNA-coated PEPS in a biological fluid sample, binding of the tDNA from the biological fluid sample to the pDNA on PEPS surface shifts the PEPS length extension mode (LEM) (Fig. 1b) and width extension mode (WEM) (Fig. 1c) resonance frequency, f. In situ detection of the tDNA from the biological fluid sample has been achieved by monitoring the PEPS LEM31 or WEM32 resonance frequency shift, Δf in real time. An optical micrograph of the PEPS used in this study is shown in Fig. 1d. What is unique about the PMN-PT PEPS is its ability to inherently enhance the detection resonance frequency shift by more than 1000 times by the polarization orientation switching within the piezoelectric PMN-PT layer, which was induced by the surface stress generated by the binding of the target analyte on the PEPS surface31, 33–37. Using 200-neocleotide (nt) Hepatitis B virus 1762T/1764A double mutation (HBVDM) as a model single-stranded MT tDNA, PEPS has exhibited unprecedented PCR-like 100 zM (10−19M) analytical sensitivity in detecting HBVDM in urine in situ and in real time without DNA isolation or amplification32. HBVDM has been shown to be a risk factor for Hepatocellular Carcinoma (HCC)38 and more than 60% of HCC patients have circulating HBVDM in their sera39, 40. That PEPS could detect hybridization of 200-nt HBVDM in urine in situ with high sensitivity suggests that it might be useful for detecting short mutation fragments in urine. In addition, in a recent study using fluorescent reporter microspheres (FRMs) as a tool for visual detection, we have illustrated that incorporating flow in mutation detection the impingement force generated by the flow can help discriminate the weaker binding of the WT and enhance the specificity of mutation detection against the WT 41.
Fig. 1.
A schematic of (a) a piezoelectric plate sensor (PEPS), (b) the first length extension mode (LEM), (c) width extension mode (WEM) vibration of a PEPS where the shaded bars illustrated the initial position of the PEPS and the dash–dotted shapes illustrate the extended positions, and (d) a top-view optical micrograph
In view of the sensitivity PEPS in situ detection and flow can further enhance mutation detection specificity; the goal of this study is to examine the analytical sensitivity and specificity of PEPS in situ mutation detection in a flow in urine in the background of WT. Following the earlier study41, HBVDM will be used as the model mutation (MT) with the same 16-nt pDNA as shown Table I. The melting temperatures of this pDNA with the MT and the WT were 47°C and 23°C41, respectively. As such, without flow the optimal temperature for specific MT detection was 35°C, the midpoint between the MT and WT melting temperatures. With a flow of 4 ml/min, specific MT detection could be achieved at a lower temperature of 30°C while accomplishing better detecting sensitivity than at 35°C41. We will carry out PEPS in situ HBVDM MT detection in a flow at 30°C and at 4 ml/min41. The specificity of the MT detection will be examined visually using blue MT FMRs to image the captured MT and green WT FRMs to image the captured WT.
Table 1.
The sequences pDNA, MT, WT, MTrDNA, and WTrDNA and the melting temperatures (Tm) for MT with pDNA, WT with pDNA, MTrDNA MT, and WTrDNA with WT adjusted for salt concentration in PBS.
| Type of DNA | Sequencea | Tm (°C) |
|---|---|---|
| pDNA | 5’-ACAAAGATCA TTAACC-3’ |
|
| MT | 5’-TTTAAAGACTGGGA GGAGTTGGGGGAGGAG ATTAGGTTAATGATCTT TGT-3’ |
47 |
| WT | 5’-GGTTAAAGGTCTTTG TACTAGGAGGCTGTAG GCATAAATTGGTCTGTT CA-3’ |
23 |
| MT rDNA | 5’-AATCTCCTCCCCCAA CTCCTCCCAGTCTTT-3’ |
77 |
| WT rDNA | 5’-ACAGACCAATTTATG CCTACAGCCTCCTAG-3’ |
76 |
Note the mutated sites of the MT are in bold type.
Experimental
pDNA, MT, WT, rDNAs and FRMs
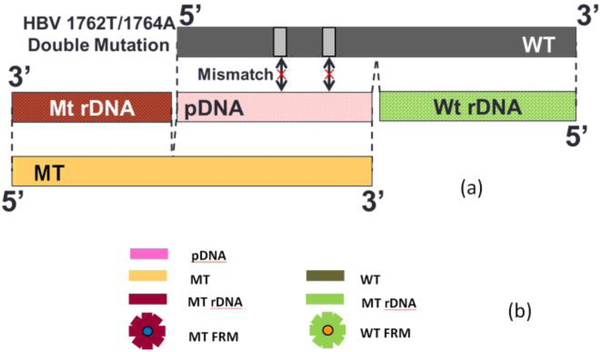
The pDNA used to detect HBVDM MT was a 16-nt long synthetic single-stranded DNA (Sigma) complementary the sequence of the HBVDM (GeneBank Accession #X04615) centered around the 1762T/1764A double mutations31 as shown in Table I. The pDNA was amine activated with a 12-polyethyleneglycol (PEG) spacer at the 5’ end. The sequence of the pDNA is shown in Table I. As mentioned above, the 50-nt MT was a synthetic single-stranded DNA (Sigma) containing the sequence complementary to the pDNA (as shown in red with the two mutations in bold type in Table I) plus a 34-nt upstream sequence (as shown in blue and black in Table I) while the 50-nt WT contained the sequence complementary to the pDNA (except the two mutations) (as shown in red in Table I) plus a 34-nt downstream sequence (as shown in green and black in Table I). Also shown in Table I are the sequence of the MTrDNA complementary to the blue upstream sequence of the MT in Table I and the sequence of the WTrDNA complementary to the green downstream sequence of the WT in Table I. Both MTrDNA and WTrDNA were 30-nt long (Sigma) with much higher melting temperatures than those of the pDNA to the WT or the MT (see Table I). The MTrDNA was amine activated with a 12-PEG spacer at the 5’ end and the WTrDNA was also amine activated but with a 7-PEG spacer at the 3’ end. Also shown in Table I are the melting temperature (Tm) for the binding of the MT with the pDNA, that for the binding of the WT with the pDNA, that for the MTrDNA to MT, and that for the WTrDNA to WT. MTrDNA and WTrDNA were covalently conjugated to MT FRMs and WT FRMs, respectively. Both MT and WT FRMs were 6 μm in size but differed in the fluorescent color. MT FRMs emitted blue light (Bright Blue (BB) (≅ Coumarin), Polysciences) with excitation maximum at 360 nm and emission maximum at 407 nm whereas the WT FRMS emitted yellow-green light (Yellow Green (YG) (≅ Fluorescein), Polysciences) with excitation maximum at 441 nm and emission maximum at 486 nm. Figures 2a and 2b together show a schematic illustrating the relationship between pDNA, MT, WT, MT rDNA, WT rDNA, MT FRMs, and WT FRMs. As can be seen, the sequences of MT, WT, MT rDNA, and WT rDNA were chosen such that the MT FRMs would report only the presence of MT and the WT FRMs would report only the presence of WT. For this purpose, after FRMs detection, two fluorescent images of the PEPS surface were taken using an Olympus BX41 fluorescent microscope. One image contained only the MT FRMs by using a D350/50 filter (Chroma) for excitation and a 400 nm long-pass filter (Chroma) for emission while the other image contained only the WT FRMs by using a D460/50 filter (Chroma) for excitation and a HQ545/30 filter (Chroma) for emission. Even though the MT FRMs images were taken with a 400 long pass emission filter, they did not contain the images of WT FRMs because the WT FRMs could not be excited with the D350/50 excitation filter. For the latter image, a longer exposure time was used to make up for the fact that the emission filter did not completely overlap with the emission spectrum of the WT FRMs. The fluorescent spots in the MT FRMs image were then colored blue to denote that they are MT FRMs and those in the WT FRMs image were then colored orange to denote that they are WT FRMs using MatLab. After coloring, the blue and orange images were merged using MatLab. Because MT FRMS and WT FRMS exhibited different fluorescent colours, by examining the colours of the FRMs captured on the PEPS surface following MT detection in a mixture of MT and WT, one could determine how specific the MT detection was in a background of WT.
Fig. 2.
(a) A schematic of the relationship between probe DNA (pDNA), mutant (MT) target DNA (tDNA), wild type (WT), MT reporter DNA (MT rDNA), and WT rDNA (WT rDMA) for HBV 1762/1764 double mutation and (b) a schematic representation of (a) pDNA, MT, MT rDNA, and blue MT fluorescent reporter microsphere (MT FRM), and WT, WT rDNA, and orange WT fluorescent reporter microsphere (WT FRM).
PEPS fabrication and electrical insulation
The PEPS used in this study was 1.2 mm long and 0.45 mm wide fabricated from (PbMg1/3Nb2/3O3)0.65-(PbTiO3)0.35 (PMN-PT) freestanding films 8 μm thick that was coated with 110 nm thick Cr/Au electrode by thermal deposition (Thermionics VE 90) cut into 2.5 mm by 0.7 mm strips by a wire saw (Princeton Scientific Precision, Princeton, NJ). Gold wires 10 μm in diameter were glued to the top and bottom electrodes of each strip using conductive glue (XCE 3104XL, Emerson and Cuming Company, Billerica, MA). The rear end of the strip was fixed on a glass substrate by a nonconductive glue (Loctite 1C Hysol Epoxy Adhesive) to form the PEPS geometry and poled at 15KV/cm at 90°C for 60 min in an incubator (Digital Control Steel Door Incubator 10–180E, Quincy Lab). The dielectric constant of the PEPS was measured using an electrical impedance analyzer (Agilent 4294A) to be about 1800 with a loss factor of 2.5–3.7% at 1 kHz. The PEPS was electrically insulated to stabilize the resonance peaks for in-liquid detection by using a new 3-mercaptopropyltrimethoxysilane (MPS) (Sigma-Aldrich Co. LLC.) solutions coating scheme involving enhanced MPS cross-linking at pH=9.0 and with the addition of water42. This PEPS was the PEPS A used in the earlier study where with this insulation scheme and with an improved resonance peak frequency determination algorithm, this PEPS has demonstrated 100 zM hybridization sensitivity in urine32. We will follow the electric insulation and peak insulation procedures described previously32.
pDNA immobilization, nonspecific binding blocking, and FRMs conjugation
To immobilize the amine-activated pDNA on the PEPS surface, the MPS-coated PEPS was first immersed in 200 μl of 5mM of sulfosuccinimidyl-4-(N-maleimidomethyl)cyclohexane-1-carboxylate (sulfo-SMCC) (Pierce) in PBS with the pH adjusted to 6.5 for 1 hour. The PEPS was then washed three times with deionized water and immersed in 200μl of 10 μM of amine-activated pDNA in phosphate buffer saline (PBS) for 30 min. After pDNA immobilization, the PEPS was treated with 3% bovine serum albumin (Sigma) in PBS solution for 1 hr followed by washing 5 times with PBS. As demonstrated by the previous study, 3% BSA was sufficient to completely block the nonspecific bindings for DNA detection in urine32. The MT FRMs were covalently conjugated to MT rDNA and the WT FRMS to the WT rDNA using procedures described previously.31, 32, 41
Spiked urine samples and flow setup
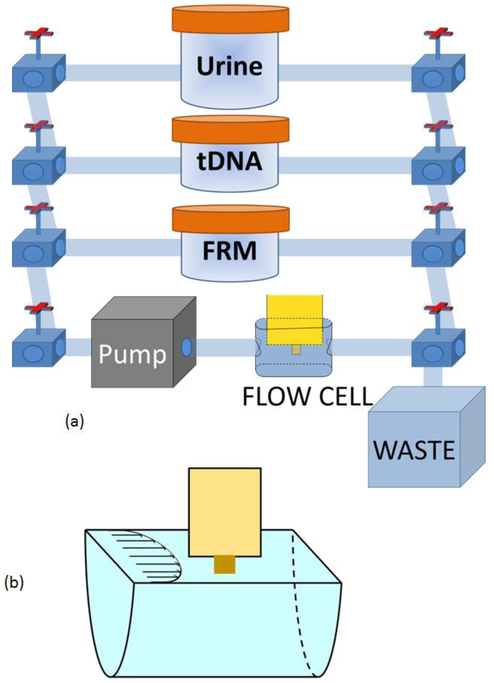
A schematic of the flow system for carrying out the detection is shown in Fig. 3a which contains a peristaltic pump (Cole-Parmer 77120–62), a flow cell where detection took place, and reservoirs containing DNA-spiked urine samples, FRMs, and PBS interconnected with tubing of a 0.8-mm inner diameter. The urine came from one individual. The subject was free of HBV infection. The urine samples were collected in a “First Morning Specimen” manner, i.e., bladder was emptied before bed and sample was collected first thing in the morning. A total of 9 such urine samples were collected for the study and visually there was no significant difference among these 9 urine samples and 12 more that were used for a previous study32 in terms of color and turbidity. The flow was driven by the peristaltic pump and controlled by the valves. In each detection, the volume of the DNA-spiked urine sample was fixed at 50 ml and the pDNA-coated PEPS was placed in the center of the flow cell as illustrated in Fig. 3b. The flow setup was placed inside an incubator (Digital Control Steel Door Incubator 10–180E, Quincy Lab) for temperature control. Because the flow cell was open a 2-litre water bath was included in the incubator to minimize potential frequency shifts due to the changes in the flow-cell liquid level by evaporation. In what follows, all HBVDM detection experiments were carried out with the optimal 4ml/min flow rate and 30oC as determined by the previous study41. The resonance spectra were measured using a portable AIM 4170 C impedance analyzer (Array Solutions).
Fig. 3.
(a) A schematic of the flow system for mutation detection in urine and (b) a blow-up of the PEPS situated in the center of the flow cell.
Results
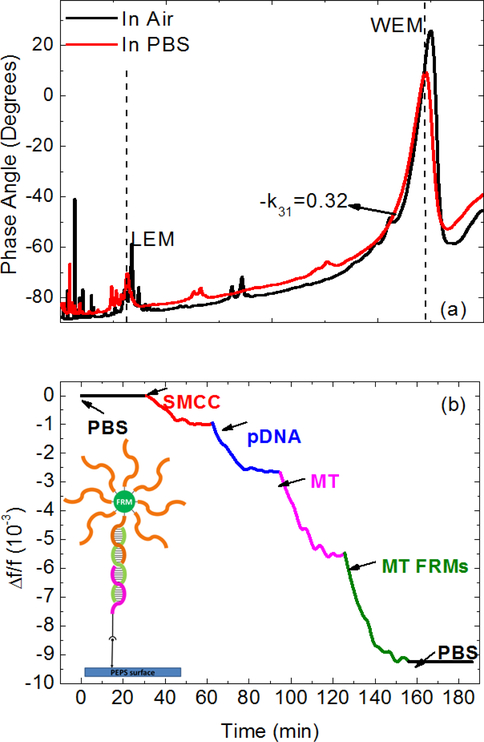
The in-air and in-PBS phase angle versus frequency resonance spectra of the PEPS are shown in Fig. 4a. As can be seen, the base-line and the length-extension-mode (LEM) resonance peak and the width-extension-mode resonance (WEM) peak of the in-liquid spectrum were close to that of the in-air spectrum, indicating the effectiveness of the new MPS coating at pH=9.0 with water. The relative resonance frequency shift, Δf/f, of the first WEM peak during the SMCC bonding (30–60 min), the pDNA immobilization (60–90 min), the subsequent MT detection at 1 pM in PBS (90–120 min) and the following MT FRMs detection (120–150 min) is shown in Fig. 4b. Also shown in the insert in Fig. 4b is a schematic of the molecules in various steps involved in the immobilization process.
Fig. 4.
(a) In-air (black) and in-PBS (red) phase angle-versus-frequency resonance spectra, and (b) relative resonance frequency shift, Δf/f, of the PMN-PT PEPS going through PBS step (0–30 min), the SMCC bonding step (30–60 min), the pDNA immobilization step(60–90 min), the MT tDNA detection step (90–120 min), the MT FRMs detection step (120–150 min), and the final PBS step (150–180 min). The insert in (b) shows a schematic of the molecules in these steps.
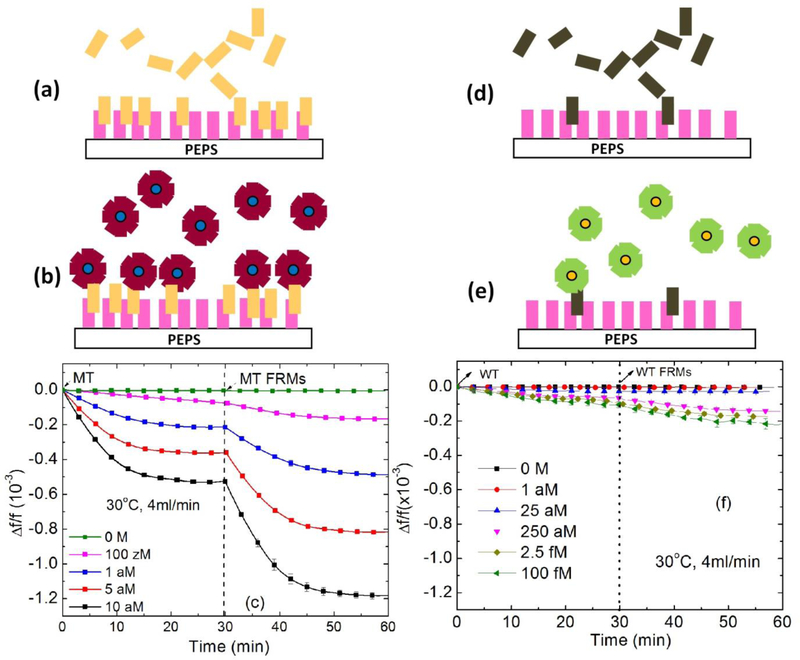
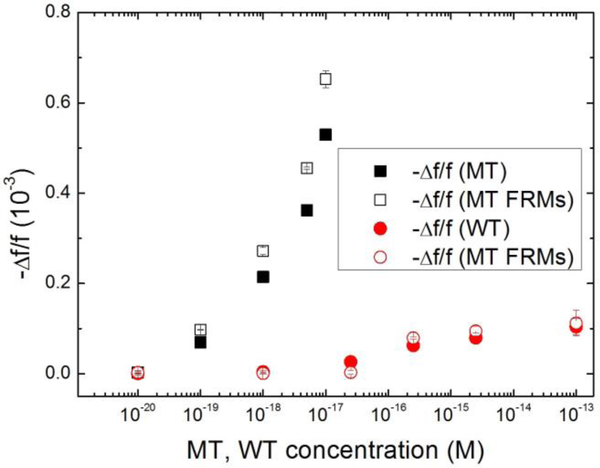
According to our previous temperature and flow rate studies, detection at 30°C and at a flow rate of 4ml/min provided the optimal detection sensitivity and specificity of the HBVDM MT against the WT41. In what follows all detection experiments were carried out at 30°C and at a flow rate of 4ml/min. For detection reliability and repeatability, three independent experiments were carried out for each detection condition. In the following, all detection results were the average of three independent detection experiments for each detection condition. First, we examined the detection of spiked MT in urine followed by in situ validation by MT FRMs detection in PBS and compared the results with those of detection of spiked WT in urine followed by in situ validation by WT FRMs detection in PBS. Figures 5a and 5b show the schematic of the MT detection in urine and that of the following MT FRMs detection, respectively. Figure 5c shows the detection Δf/f versus time of the MT detection in urine at various MT concentrations followed by the MT FRMs detection in PBS at 1×10⁵ FRMs/ml. Note the results for each concentration shown in Figure 5c were consistent with those obtained in the previous in-urine hybridization detection study of the same HBVDM target DNA using the same PEPS coated with the same pDNA32, indicative of the repeatability of the detection. Figures 5d and 5e show the schematic of the WT detection in urine and that of the following detection of the WT FRMs in PBS, respectively. The detection Δf/f versus time in urine at various WT concentrations followed by the WT FRMs detection in PBS at 1×10⁵ FRMs/ml is shown in Figure 5f. Note that Δf/f versus time of the negative control in Fig. 5c and that in Fig. 5f were both within their standard deviations, 0.003×10⁻³, supporting that non-specific binding from urine was negligible and also consistent with the results of the previous study32. Clearly, the detection -Δf/f for MT at 5 aM (5×10⁻¹⁸ M) at t = 30 min was about 0.2×10⁻³, which was still much larger than the detection -Δf/f of <0.1×10⁻³ for WT at 100 fM (1×10⁻¹³ M) at t = 30 min, indicating the specificity of the MT detection by PEPS at the chosen detection conditions of 30°C and 4ml/min flow rate. A more quantitative comparison of the detection -Δf/f of MT detection in urine and that of WT detection in urine is shown in Fig. 6 where the average MT detection -Δf/f over t = 25–30 min versus MT concentration (black full squares) and the average WT detection -Δf/f over t = 25–30 min versus WT concentration (red full circles) are shown. Clearly, even at a concentration as low as 10−19 M the average MT detection -Δf/f was still far larger than the average WT detection -Δf/f at a WT concentration of 2.5×10⁻¹⁷ M. Also shown in Fig. 6 are the average detection -Δf/f of the follow-up MT or WT FRMs detections at t=55–60 min versus MT (black open squares) or WT (red open circles) concentration. As can be seen, the MT FRMs (open squares) and WT FRMs (open circles) detections results closely reflected those of the MT (full squares) and WT (full circles) detections in urine, respectively.
Fig. 5.
Schematic representations of (a) MT detection and (b) MT FRMs detection following MT detection, and (c) Δf/f versus time of MT detection followed by MT FRMs detection at various MT concentrations, and schematic representations of (d) WT detection and (e) WT FRMs detection following WT detection, and (f) Δf/f versus time of WT tDNA detection followed by WT FRMs detection at various WT concentrations. Clearly, at 30°C and at a flow rate of 4 ml/min, the detection -Δf/f of MT at 5 aM at t = 30 min (-Δf/f = 0.4×10⁻³) was much larger than that of WT at 100 fM at t = 30 min, (-Δf/f <0.1×10⁻³), indicating the specificity of the MT detection at such detection conditions.
Fig. 6.
-Δf/f for detection of spiked MT (full squares) in urine from t =0 min to t=30 min averaged over t = 25–30 min from Fig. 5c and that for detection of spiked WT (full circles) in urine taken from Fig. 5f versus the MT or WT concentration and -Δf/f from t =30 min to 60 min averaged over t = 55–60 min of MT FRMs detection following MT detection in urine (open squares) taken from Fig. 5c and WT FRMs detection following the WT detection in urine (open circles) taken from Fig. 5f. Clearly, the detection -Δf/f of 0.076×10⁻³ for MT at 100 zM (10−19M) at t = 30 min was still more than three times larger than the detection -Δf/f of 0.025×10⁻³ of WT at 25 aM (2.5×10⁻¹⁷M) or 250-fold that of MT at t = 30 min, (-Δf/f <01×10−3), indicating MT detection could be specific even at zM MT concentrations against more than two-orders-of-magnitude more WT.
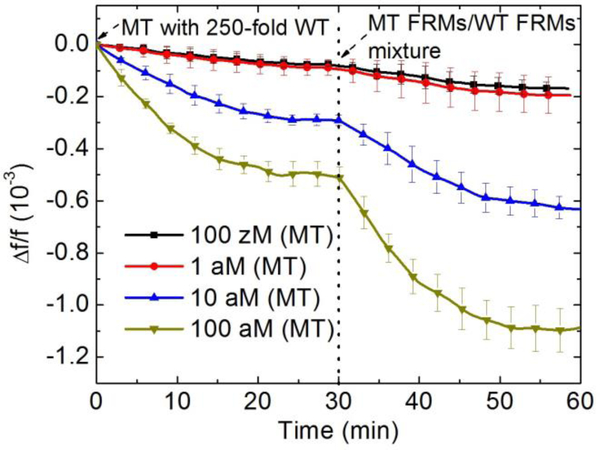
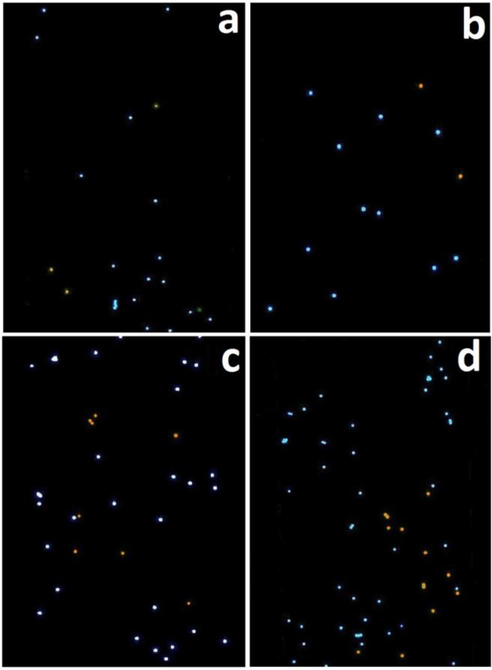
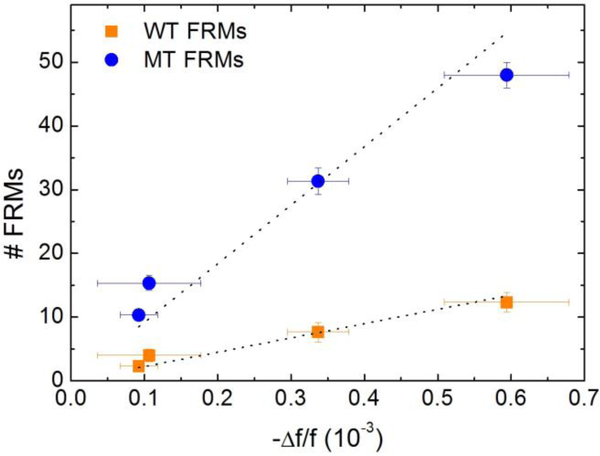
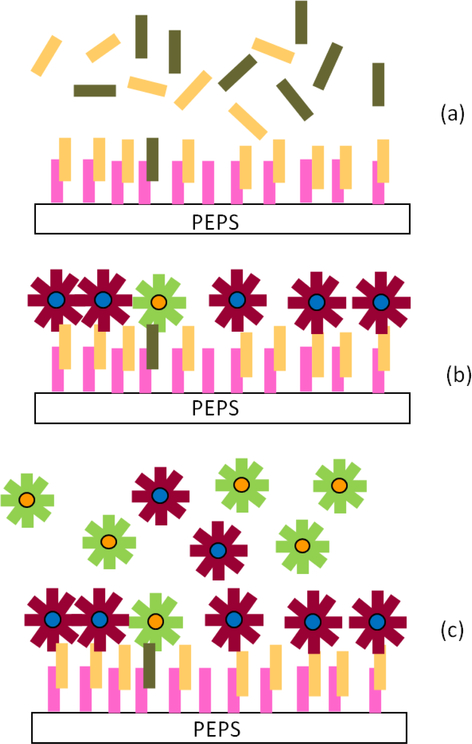
To see if PEPS detection of HBVDM MT under the current detection conditions, i.e., 30°C and a flow rate of 4 ml/min was indeed sensitive and specific, we carried out MT detection in a background of 250-fold higher WT at various MT concentrations. In Figure 7, we show the Δf/f versus time of PEPS detection in urine containing a mixture of MT in a background of 250-fold more WT at various MT concentrations followed by detection in an equal mixture of 105 FRMs/ml of MT FRMs and 105 FRMs/ml of WT FRMs in PBS. After the detection in the mixture of MT FRMs and WT FRMs and washing, the PEPS was examined using a fluorescent microscope and the obtained fluorescent images from detection at various MT concentrations are shown in Figures 8a–8d where the blue spots represent the MT FRMs and the orange ones WT FRMs. As can be seen, in all four MT concentrations (i.e., 100 zM, 1 aM, 10 aM and 100 aM) the blue MT FRMs outnumbered the orange WT FRMs. In addition, both the number of MT FRMs and that of the WT FRMs increased with an increasing MT concentration since the WT concentration was increased in proportion as well. The number of MT FRMs and that of WT FRMs versus the average -Δf/f of MT detection in MT/WT mixtures at t = 25–30 min of Fig. 7 is shown in Figure 9. Clearly, the majority of the FRMs were blue MT FRMs with a MT FRMs/WT FRMs number ratio of 5 and that the number of the blue MT FMRs increased with an increasing detection -Δf/f in the MT/WT mixture, validating that the Δf/f obtained in a MT/WT mixture with a MT/WT ratio similar to that in clinical urine samples 2 was mostly due to the binding of MT on the PEPS surface such that the bound FRMs were mostly MT FRMs. These results are schematically illustrated in Figures 10a–10c. Figure 10a illustrates that even in a mixture of MT with 250-fold more WT, still more MT than WT were captured on the PEPS surface because the temperature and flow condition favored MT to bind to the pDNA on the PEPS surface. Figure 10b illustrates that in detection in an equal mixture of MT FRMs and WT FRMs following the detection in the mixture of MT with 250-fold more WT, more MT FRMS would bond on the PEPS surface due to more MT captured on the PEPS surface. Figure 10c illustrates that the final PEPS surface had more bound MT FRMs with a MT FRMs/ WT FRMs number ratio of about 5 after detection in the equal mixture of MT FRMs and WT FRMs and washing.
Fig. 7.
Relative resonance frequency shift, Δf/f versus time of PEPS detection of MT in a background of 250-fold more WT at various MT concentrations followed by detection in an equal mixture of 105 FRMs/ml of MT FRMs and 105 FRMs/ml of WT FRMs in PBS.
Fig. 8.
Fluorescent images of the PEPS obtained after the FRMS detection that followed the MT detections in a mixture of MT with 250 times more WT at (a) 100 zM, (b) 1 aM, (c) 10 aM, and (d) 100 aM MT concentrations. The blue color denotes the MT FRMs while the orange color denotes the WT FRMs. That there were far more MT FRMs captured than WT FRMs indicates that the detection of MT was specific even in a background of 250 times more WT.
Fig. 9.
Number of MT FRMs (blue full circles) and that of WT FRMs (orange full squares) obtained from Fig. 8 versus average PEPS MT detection -Δf/f at t = 25–30 min taken from Fig 7. Note for each MT concentration the number of MT FRMs (blue) was still roughly 4 times higher than that of the WT even the concentration of the WT was 250 times higher than that of the MT. This indicates that in each case more than 80% of the detection Δf/f was due to the binding of the MT and that PEPS’s MT detection was specific even the concentration of the WT was 250 times higher than that of the MT.
Fig. 10.
A schematic of (a) a mixture of MT and WT flowing over the PEPS coated with pDNA, (b) a mixture of MT FRMs and WT FRMS flowing over the PEPS following detection in the MT/WT mixture, and (c) the MT FRMs and WT FRMs bound on the PEPS after PBS washing to be visualized under a fluorescent microscope.
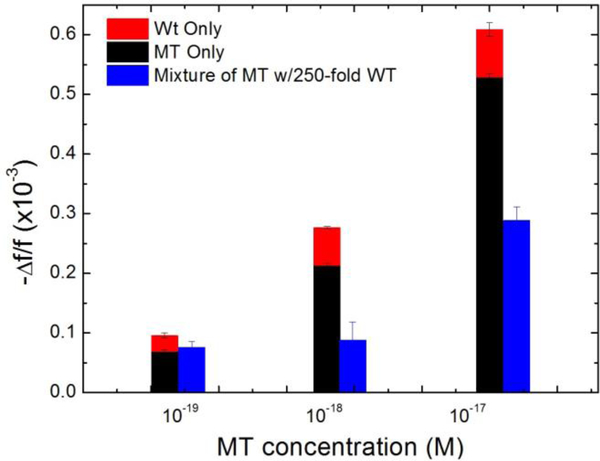
To see how the detection of MT in a background of 250-fold WT shown in Figs. 7 compared detection in pure MT and that in pure WT, we plot in Figure 11 the average -Δf/f over t = 25–30 min (blue) at 10−19 M, 10−18 M, and 10−17 M with the sum of the average -Δf/f over t = 25–30 min of pure MT detection (black) at the same concentrations and those of pure WT detection at 250-fold higher concentrations (red). As can be seen from Figure 11, at the low concentration of 10−19 MT concentration, the 250-fold WT has negligible effect on the MT detection as the WT concentration was also very low under these conditions. As the MT concentration increased so did the 250-fold WT and the background WT began to interfere with the detection of MT, causing the overall detection -Δf/f in a mixture (blue) to be somewhat smaller than that of pure MT detection at the same concentration (black). Note in Fig. 11, the -Δf/f of the pure MT detection (black) of all three concentrations were also roughly about 5 times that of the pure WT detection at a 250-fold higher concentration, consistent with the results from the detection in MT/WT mixture shown in Figures 8a–8d and further supporting that under the detection conditions of 30°C and 4ml/min, roughly 83% (5 out of 6) of the detection signals were due to MT. However as the concentration is increased competitive inhibition due to WT becomes apparent. It is important to state that even patients with urinary tract infections have less than 147 genome-equivalents per ml (GE/ml) of DNA in urine which is less than 300 copies of any sequence per ml or less than 5×10⁻¹⁹ M.43 Thus concentrations above 10−18 are not clinically important.
Fig. 11.
-Δf/f for detection of pure MT, pure WT and mixtures of MT and 250 fold more WT in urine from t =0 min to t=30 min averaged over t = 25–30 min from Fig. 5c Fig. 5f and Fig. 7. Average frequency shifts of pure MT and 250-fold more pure WT are added together and compared with the average frequency shifts of mixtures of the concentrations.
Conclusions
We have examined the analytical sensitivity and selectivity of in situ detection of gene mutation in urine using a PMN-PT PEPS using HBVDM as the model gene mutation. The PEPS was coated with a 16-nt pDNA complementary to the HBVDM and the detection was carried out in a flow with the PEPS located at the center of the flow with a flow rate of 4 ml/min and at 30°C which was below the melting temperature of the MT with the pDNA but above that of the WT with the pDNA. To examine the specificity of the mutation detection in a background of wild type, we follow the detection in the mixture of MT and WT with detection in a mixture of MT FRMs and WT FRMs in which MT FRMS and WT FRMS were designed to bind only to MT and WT, respectively. The specificity can be further confirmed by visual inspection of the colors of the bound FRMs as the MT and WT FRMs emitted different fluorescent colors. The results indicated that under the optimal detection conditions of 30°C and 4 ml/min, a PEPS detected the HBVDM with an analytical sensitivity of 60 copies/ml in a background of 250 more WT without DNA isolation or amplification. Counting the captured MT FRMs and WT FRMs after the following FRMs detection indicated that roughly 83% (5/6) of the detection signals were due to the MT even in the presence of 250-fold more WT. Finally, the same principles can be used for specific single-nucleotide mutation detection. Work is under way to detect single-nucleotide K-Ras mutations using pDNAs each containing 3 locked nucleic acid (LNA) nucleotides, which will be published in a future publication.
Acknowledgements
This work was supported in part by the Coulter-Drexel Translational Research Partnership grant, the Nanotechnology Institute of Benjamin Franklin Partnership of Southeastern Pennsylvania, and National Institute of Health Grant No. 1R41AI1122224.
Notes and references
- 1.Lipsky RH, Mazzanti CM, Rudolph JG, Xu K, Vyas G, Bozak D, Radel MQ and Goldman D, Clin Chem, 2001, 47, 635–644. [PubMed] [Google Scholar]
- 2.Su YH, Wang M, Block TM, Landt O, Botezatu I, Serdyuk O, Lichtenstein A, Melkonyan H, Tomei LD and Umansky S, Ann N Y Acad Sci, 2004, 1022, 81–89. [DOI] [PubMed] [Google Scholar]
- 3.Su YH, Wang MJ, Brenner DE, Ng A, Melkonyan H, Umansky S, Syngal S and Block TM, Journal of Molecular Diagnostics, 2004, 6, 101–107. [DOI] [PMC free article] [PubMed] [Google Scholar]
- 4.Hammond DM, Manetto A, Gierlich J, Azov VA, Gramlich PM, Burley GA, Maul M and Carell T, Angew Chem Int Ed Engl, 2007, 46, 4184–4187. [DOI] [PubMed] [Google Scholar]
- 5.Passamano M and Pighini M, Sensors and Actuators B: Chemical, 2006, 118, 177–181. [Google Scholar]
- 6.Feng K, Li J, Jiang JH, Shen GL and Yu RQ, Biosens Bioelectron, 2007, 22, 1651–1657. [DOI] [PubMed] [Google Scholar]
- 7.Gasparac R, Taft BJ, Lapierre-Devlin MA, Lazareck AD, Xu JM and Kelley SO, Journal of the American Chemical Society, 2004, 126, 12270–12271. [DOI] [PubMed] [Google Scholar]
- 8.Park SJ, Taton TA and Mirkin CA, Science, 2002, 295, 1503–1506. [DOI] [PubMed] [Google Scholar]
- 9.He L, Musick MD, Nicewarner SR, Salinas FG, Benkovic SJ, Natan MJ and Keating CD, Journal of the American Chemical Society, 2000, 122, 9071–9077. [Google Scholar]
- 10.Mao X, Yang L, Su XL and Li Y, Biosens Bioelectron, 2006, 21, 1178–1185. [DOI] [PubMed] [Google Scholar]
- 11.Gifford LK, Sendroiu IE, Corn RM and Luptak A, J Am Chem Soc, 2010, 132, 9265–9267. [DOI] [PMC free article] [PubMed] [Google Scholar]
- 12.Yang T, Zhou N, Zhang Y, Zhang W, Jiao K and Li G, Biosens Bioelectron, 2009, 24, 2165–2170. [DOI] [PubMed] [Google Scholar]
- 13.Zheng G, Patolsky F, Cui Y, Wang WU and Lieber CM, Nat Biotechnol, 2005, 23, 1294–1301. [DOI] [PubMed] [Google Scholar]
- 14.Zhang GJ, Luo ZH, Huang MJ, Tay GK and Lim EJ, Biosens Bioelectron, 2010, 25, 2447–2453. [DOI] [PubMed] [Google Scholar]
- 15.Andreu A, Merkert JW, Lecaros LA, Broglin BL, Brazell JT and El-Kouedi M, Sensors and Actuators B: Chemical, 2006, 114, 1116–1120. [Google Scholar]
- 16.Gao Z, Agarwal A, Trigg AD, Singh N, Fang C, Tung CH, Fan Y, Buddharaju KD and Kong J, Anal Chem, 2007, 79, 3291–3297. [DOI] [PubMed] [Google Scholar]
- 17.Hahm J.-i. and Lieber CM, Nano Letters, 2003, 4, 51–54. [Google Scholar]
- 18.Wang J, Polsky R, Merkoci A and Turner KL, Langmuir, 2003, 19, 989–991. [Google Scholar]
- 19.Chang H, Yuan Y, Shi N and Guan Y, Anal Chem, 2007, 79, 5111–5115. [DOI] [PubMed] [Google Scholar]
- 20.Su M, Li S and Dravid VP, Applied Physics Letters, 2003, 82, 3562–3564. [Google Scholar]
- 21.Rijal K and Mutharasan R, Anal Chem, 2007, 79, 7392–7400. [DOI] [PubMed] [Google Scholar]
- 22.Zheng S, Choi JH, Lee SM, Hwang KS, Kim SK and Kim TS, Lab on a Chip, 2011, 11, 63–69. [DOI] [PubMed] [Google Scholar]
- 23.Wang J, Kawde AN and Musameh M, Analyst, 2003, 128, 912–916. [DOI] [PubMed] [Google Scholar]
- 24.Husale S, Persson HH and Sahin O, Nature, 2009, 462, 1075–1078. [DOI] [PMC free article] [PubMed] [Google Scholar]
- 25.Kurkina T, Vlandas A, Ahmad A, Kern K and Balasubramanian K, Angew Chem Int Ed Engl, 2011, 50, 3710–3714. [DOI] [PubMed] [Google Scholar]
- 26.Chen C-P, Ganguly A, Lu C-Y, Chen T-Y, Kuo C-C, Chen R-S, Tu W-H, Fischer WB, Chen K-H and Chen L-C, Anal Chem, 2011, 83, 1938–1943. [DOI] [PubMed] [Google Scholar]
- 27.Gao W, Dong H, Lei J, Ji H and Ju H, Chem Commun (Camb), 2011, 47, 5220–5222. [DOI] [PubMed] [Google Scholar]
- 28.Soleymani L, Fang Z, Kelley SO and Sargent EH, Applied Physics Letters, 2009, 95, 143701–143703. [Google Scholar]
- 29.Loaiza OA, Campuzano S, Pedrero M, Pividori MI, Garcia P and Pingarron JM, Anal Chem, 2008, 80, 8239–8245. [DOI] [PubMed] [Google Scholar]
- 30.Shih WY, Luo H, Li H, Martorano C and Shih W-H, Applied Physics Letters, 2006, 89, 242913–242913. [Google Scholar]
- 31.Wu W, Kirimli CE, Shih WH and Shih WY, Biosens Bioelectron, 2013, 43, 391–399. [DOI] [PubMed] [Google Scholar]
- 32.Kirimli CE, Shih WH and Shih WY, Analyst, 2014, 139, 2754–2763. [DOI] [PMC free article] [PubMed] [Google Scholar]
- 33.Zhu Q, Shih WY and Shi WH, Sensor Actuat B-Chem, 2009, 138, 1–4. [DOI] [PMC free article] [PubMed] [Google Scholar]
- 34.Zhu Q, Shih WY and Shih W-H, Appl Phys Lett, 2008, 92, 183505. [DOI] [PMC free article] [PubMed] [Google Scholar]
- 35.Shih WY, Zhu Q and Shih WH, J Appl Phys, 2008, 104. [DOI] [PMC free article] [PubMed] [Google Scholar]
- 36.Zhu Q, Shih WH and Shih WY, Sensor Actuat B-Chem, 2013, 182, 9. [Google Scholar]
- 37.Wu W, Shih WY and Shih WH, Journal of Applied Physics, 2013, 114. [Google Scholar]
- 38.Munoz A, Chen JG, Egner PA, Marshall ML, Johnson JL, Schneider MF, Lu JH, Zhu YR, Wang JB, Chen TY, Kensler TW and Groopman JD, Carcinogenesis, 2011, 32, 860–865. [DOI] [PMC free article] [PubMed] [Google Scholar]
- 39.Arbuthnot P and Kew M, International Journal of Experimental Pathology, 2001, 82, 77–100. [DOI] [PMC free article] [PubMed] [Google Scholar]
- 40.Kuang SY, Jackson PE, Wang JB, Lu PX, Munoz A, Qian GS, Kensler TW and Groopman JD, Proc Natl Acad Sci U S A, 2004, 101, 3575–3580. [DOI] [PMC free article] [PubMed] [Google Scholar]
- 41.Kirimli CE, Shih W-H and Shih WY, The Analyst, 2013, 138, 6117–6126. [DOI] [PubMed] [Google Scholar]
- 42.Soylu MC, Shih W-H and Shih WY, Industrial & Engineering Chemistry Research, 2013, 52, 2590–2597. [Google Scholar]
- 43.Garcia Moreira V., Prieto Garcia B., de la Cera Martinez T and Alvarez Menendez FV, Clin Biochem, 2009, 42, 729–731. [DOI] [PubMed] [Google Scholar]


