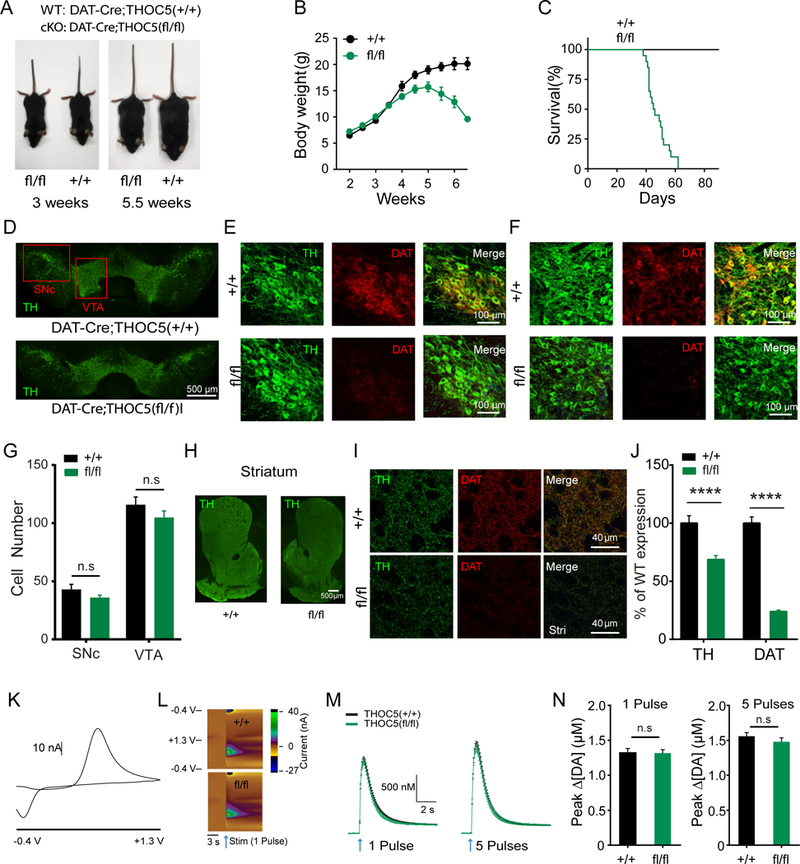
Figure 4. THOC5 cKO mice exhibit developmental defects, reduced DAT expression, but normal DA release at 3 weeks of age.

(A) Representative body size in 3 week old (left) and 5.5 week old (right) DAT-cre;Thoc5+/+ (wt) and DAT-cre;Thoc5fl/fl (cKO).
(B) Summary of wt and cKO body weight (N=10 for wt, and N=10 for cKO)
(C) Survival curve (N=13 for wt, and N=21 for cKO)
(D) Representative images of midbrain TH immufluorescence in 3 weeks old wt and cKO mice.
(E) Representative images of TH and DAT immunofluorescence in SNc from 3 weeks old wt (top) and cKO (bottom) mice.
(F) Representative images of TH and DAT immunofluorescence in VTA from wt (top) and cKO (bottom).
(G) Quantification of DA cell number in midbrain (p>0.05, two-way ANOVA with Bonferroni post-hoc test, wt: N = 12, cKO: N = 18)
(H) Representative images of striatum showing TH immufluorescence in wt (left) and cKO (right) mice.
(I) Representative high magnification images of TH and DAT immunofluorescence in dorsal striatum from wt (top) and cKO (bottom).
(J) Quantification of TH and DAT immunofluorescence in striatum (****, p<0.0001, two-way ANOVA with Bonferroni post-hoc test, wt: N = 24, cKO: N = 36).
(K) 2D voltammogram showing oxidation and reduction peaks of DA.
(L) Representative 3D voltammograms from 1 pulse. x-axis: recording time, y-axis: applied potential, color map: recorded current. Arrows represent time of stimulation.
(M) Summary of fast-scan cyclic voltammetry (FSCV) recordings evoked by 1 pulse (left) and 5 pulses (right) stimulations (wt: N=24, cKO: N=29).
(N) Quantification of peak DA release evoked by 1 pulse (left) and 5 pulses (right) stimulations (p>0.05, Mann-Whitney, wt: N=24, cKO: N=29).
