Abstract
BACKGROUND
Sepsis is a complex clinical syndrome with substantial heterogeneity. We sought to identify patterns of serum biomarkers of endothelial activation and dysfunction in individuals with sepsis and evaluate subgroup-specific differences in mortality.
METHODS
Adult patients with sepsis (n = 426) were consecutively recruited from 2 hospitals in Uganda. Clinical information was collected, and serum concentrations of 11 biomarkers involved in the endothelial response to infection were measured in samples from 315 patients. Latent variable models were fit to evaluate whether the endothelial response to sepsis consists of one unified biologic process or multiple processes and to identify subgroups of patients with distinct host-response profiles. Differences in survival at day 28 were evaluated using Kaplan-Meier survival curves.
RESULTS
We identified 3 patient subgroups characterized by unique host endothelial response profiles. Patients fitting profile 2 had significantly worse survival (log-rank P < 0.001). Four latent factors (factors 1–4) were identified, each potentially representing distinct biologic processes for the endothelial response to sepsis: factor 1 (CHI3L1, sTREM1, sFLT1), factor 2 (ANGPT1, PF4, VEGF), factor 3 (CXCL10, vWF, sICAM1), and factor 4 (ANGPT2, sTEK).
CONCLUSION
Patient profiles based on patterns of circulating biomarkers of endothelial responses may provide a clinically meaningful way to categorize patients into homogeneous subgroups and may identify patients with a high risk of mortality. Profile 2 may represent dysfunction of the endothelial response to infection.
FUNDING
Primary funding: Investigator-Initiated Award provided by Pfizer Inc. Additional support: Canadian Institutes of Health Research Foundation grant (FDN-148439) and the Canada Research Chair program.
Keywords: Clinical Trials, Infectious disease
Keywords: Clinical practice
Patient profiles based on patterns of circulating biomarkers of endothelial responses may provide a clinically meaningful way to categorize sepsis patients.
Introduction
Sepsis remains a leading cause of death globally, with estimates of over 50.9 million cases resulting in over 5.3 million deaths each year (1). Although accurate estimates are lacking, the burden of sepsis may be greatest in low- and middle-income countries (2). In Africa, a systematic review and meta-analysis estimated that approximately 13.5% of hospitalized adult patients had a bloodstream infection (3).
Sepsis is defined as “life-threatening organ dysfunction due to a dysregulated host response to infection” (4). Underlying this definition is the assumption that the host response to the infectious insult is uniform across pathogens and affected organ systems. However, sepsis is a complex syndrome caused by a wide range of microbial pathogens that results in disturbances of several organ systems. In the United States, common causative bacterial pathogens include E. coli, Staphylococcus aureus, and Streptococcus pneumoniae (5). In Africa, additional common sepsis etiologies include nontyphoidal Salmonella and Mycobacterium tuberculosis, particularly in HIV-infected persons (3, 6). Sepsis can originate from a range of infected sites, with the respiratory, genitourinary, and gastrointestinal tracts most frequently implicated (7). Moreover, the signs and symptoms of sepsis are highly variable and typically nonspecific, including aberrations in vital signs like tachycardia and tachypnea alongside signs of organ dysfunction, such as altered mental status, hypotension, and renal dysfunction, ultimately leading to shock and death. Ultimately, the pathogen, pathogen load, site of infection, and host susceptibility contribute to the clinical presentation and course of disease.
Failure to develop effective therapeutics and the limited success in developing diagnostic or prognostic tests are often attributed to the heterogeneity inherent in sepsis (8, 9). There are currently no US FDA–approved treatments for sepsis, despite several decades of clinical trials. Activated protein C was approved by the FDA but subsequently removed from the market after further studies failed to demonstrate a treatment effect. Restricting the evaluation of candidate therapeutics to homogeneous subsets of patients, such as patients with a specific infectious etiology, has been proposed (8, 10). However, despite widespread recognition that the pathogenic processes leading to organ failure and death often differ between microorganisms and infection source, most clinical trials continue to group together all patients with sepsis (9).
The current sepsis treatment strategies are based on evidence-based guidelines covering multiple domains of sepsis management including hemodynamics, infection, adjunctive therapies, metabolic factors, and ventilation (11). Early recognition and treatment is considered paramount, as several studies have demonstrated an increased risk of mortality in patients receiving delayed treatment (12, 13). However, early recognition of sepsis is difficult as physiologic derangements such as hypotension may be absent early in the course of illness. Biomarkers to aid in clinical recognition and prognostication are needed, and extensive research in this area is ongoing.
A recent systematic review of sepsis identified 178 biomarkers that were altered during sepsis in 3370 clinical and experimental studies (14). The biomarkers encompassed a wide range of biologic pathways, including coagulation, the complement cascade, endothelial activation, inflammation, and apoptosis. The authors concluded that none of the biomarkers with published validity estimates had adequate sensitivity or specificity for use in clinical practice, but combinations of biomarkers should be evaluated in future studies.
The role of the endothelium has increasingly been recognized as an integral component of the host response to sepsis. Involvement of the endothelium in sepsis is characterized by microvascular leak, which manifests clinically as hypotension, tissue edema, hypoperfusion, and organ dysfunction (15, 16). During the course of infection, the endothelium becomes prone to clots, leukocyte trafficking increases, and the vessels become leaky (16). The vascular leak resulting from endothelial activation is thought to contribute to the tissue hypoxia and organ dysfunction that are integral to the pathogenesis of sepsis. Compared with ICU controls, the capillaries of patients with sepsis have decreased or intermittent flow as well as decreased vascular density (15). Several mechanisms have been proposed to account for the microcirculatory alterations, including dysfunction of the endothelium (15).
Patient profiles based on patterns of circulating biomarkers of endothelial response may provide a clinically meaningful way to categorize patients into homogeneous subgroups. In this study, we evaluated the role of 11 biomarkers for their clinical relevance and role in mechanistic pathways in a cohort of Ugandan adult patients with sepsis. Specifically, we evaluated with latent profile analysis whether patients with sepsis can be characterized in patient subgroups, each with distinct endothelial response profiles. We also investigated the clinical relevance of the observed endothelial response profiles. Lastly, we investigated with latent factor analysis whether the host response to any infectious insult is uniform across all patients by exploring whether specific endothelial markers were part of one coordinated process or several distinct processes.
Results
Patient characteristics.
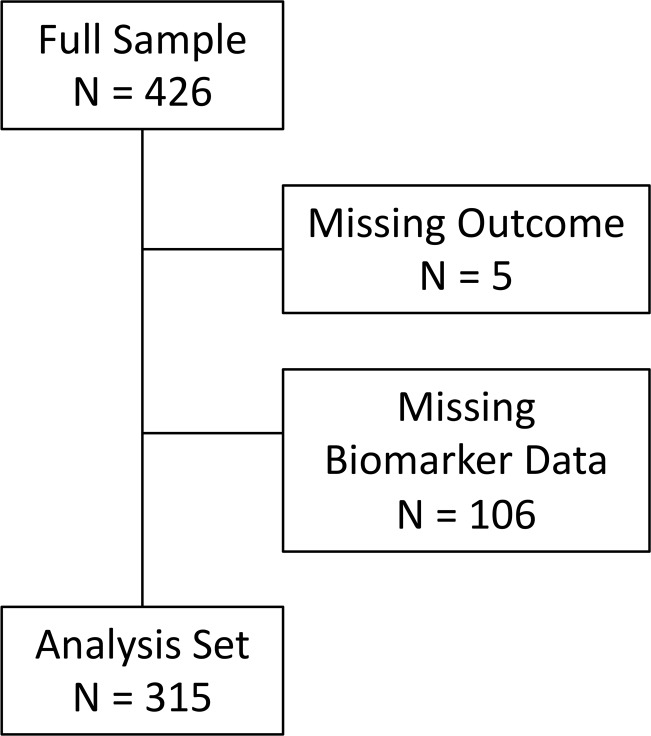
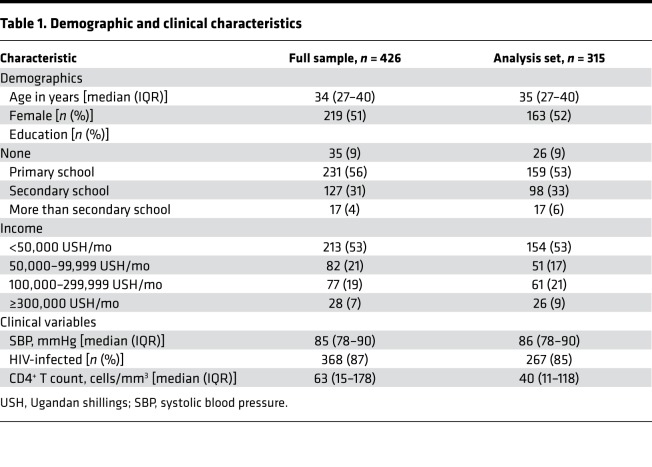
A total of 426 patients were enrolled in the PRISM-U2 study, of whom 315 had complete biomarker values and outcome measures available for analysis (Figure 1). The demographic and clinical characteristics of the full sample and the analysis sample were comparable (Table 1). All remaining analyses were conducted using the analysis set (n = 315). The median patient age was 35 years (IQR 27–40), with approximately equal numbers of males and females. The majority of patients had a primary (53%) or secondary (33%) school education and earned less than 50,000 Ugandan shillings per month (53%), approximately US$20 per month. The median systolic blood pressure was 86 mmHg (IQR 78–90). Most patients were HIV-infected (85%), with a median CD4+ T cell count of 40 cells/mm3 (IQR 11–118). Twelve percent (n = 39) had a peripheral blood smear positive for malaria.
Figure 1. Flow diagram.
The full cohort consisted of 426 subjects. The subjects were removed from the analysis if the clinical outcome was missing (n = 5), or if data were missing on biomarker values (n = 106).
Table 1. Demographic and clinical characteristics.
Biomarkers.
Data on 11 endothelial biomarkers were analyzed: angiopoietin-1 (ANGPT1), ANGPT2, soluble TEK receptor tyrosine kinase (sTEK), vascular endothelial growth factor (VEGF), soluble fms-like tyrosine kinase-1 (sFLT1), soluble intercellular adhesion molecule-1 (sICAM1), soluble triggering receptor expressed on myeloid cells 1 (sTREM1), chitinase 3 like 1 (CHI3L1), von Willebrand factor (vWF), platelet factor 4 (PF4), and C-X-C motif chemokine 10 (CXCL10). Biomarker concentrations did not differ significantly by sex or age. HIV-infected patients had biomarker concentrations similar to those of uninfected patients (data not shown). Visual inspection of scatterplots of the biomarkers suggested a positive, linear correlation between ANGPT1 and PF4 as well as between sICAM1 and CXCL10.
Patient subgroups and mortality.
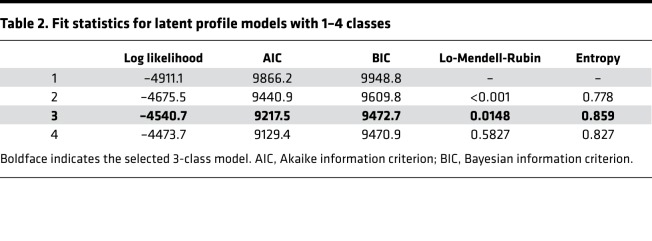
Several fit-statistics were evaluated to determine the number of classes (i.e., patient subgroups) (Table 2). The 4-class model had slightly lower log likelihoods, Akaike information criterion, and Bayesian information criterion statistics than the 3-class model. However, the Lo-Mendell-Rubin test indicated there was no improvement in fit for a 4-class versus a 3-class model. Furthermore, the entropy of the 3-class model was higher, suggesting higher classification certainty. Based on these results, a 3-class model was selected.
Table 2. Fit statistics for latent profile models with 1–4 classes.
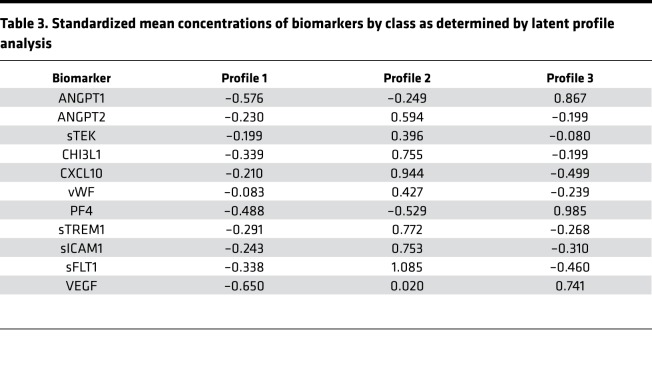
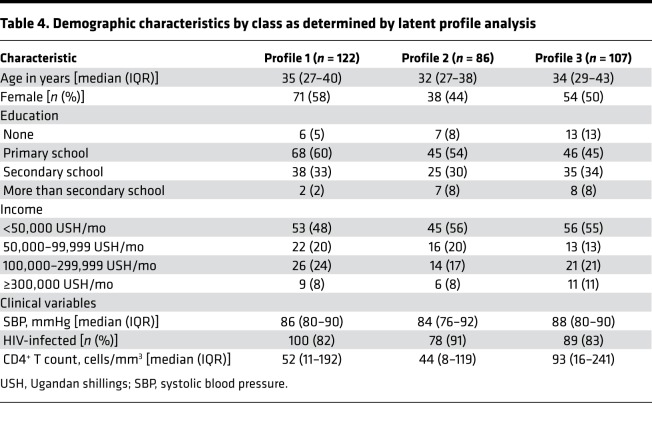
Profile 1 was the most prevalent, comprising 39% of the patients (n = 122). Thirty-four percent of the patients had a biomarker profile consistent with profile 3 (n = 107) and 27% with profile 2 (n = 86). The 3 groups were similar in their demographic characteristics (Table 3). Patients fitting profile 2 had a slightly lower percentage of females, but the difference was not statistically significant. A trend toward a higher percentage of patients infected with HIV was observed in the profile 2 group (91%) compared with the profile 1 (82%) and profile 3 (83%) groups (P = 0.193).
Table 3. Standardized mean concentrations of biomarkers by class as determined by latent profile analysis.
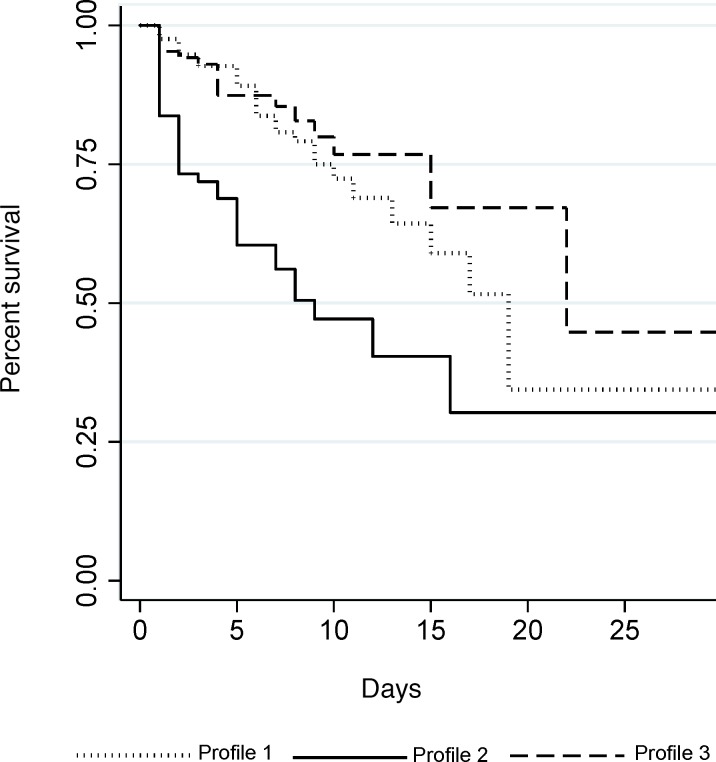
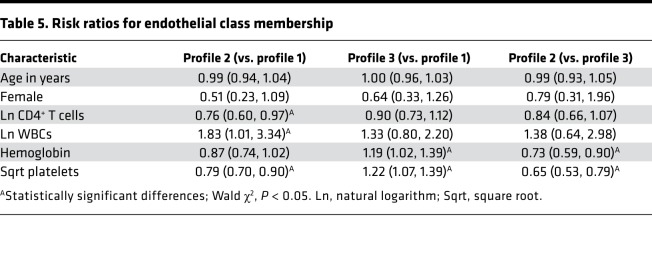
Patients fitting profile 2 had significantly worse survival outcomes than patients with the other 2 profiles (log-rank P < 0.0001) (Figure 2). The endothelial response profiles (1, 2, and 3) corresponded to differences in other frequently used clinical laboratory measures of patient status, including CD4+ T cell counts, white blood cell (WBC) counts, platelet counts, and hemoglobin concentration (Table 4). Controlling for age and sex, the relative risk (RR) of being categorized in profile 2 compared with profile 1 nearly doubled with every 1 unit increase in log-transformed WBC count (RR = 1.83, 95% CI: 1.01, 3.34) and decreased with increasing CD4+ T cell (RR = 0.76, 95% CI: 0.60, 0.97) and platelet counts (RR = 0.79, 95% CI: 0.70, 0.90; Table 5). In addition, all 3 groups differed from each other in their platelet counts, with decreased risk of being categorized in profile 2 with increasing platelet counts.
Figure 2. Kaplan-Meier survival curves by endothelial response profile.
Patients fitting profile 2 died significantly sooner than patients fitting profile 1 or profile 3 (log-rank P < 0.001).
Table 4. Demographic characteristics by class as determined by latent profile analysis.
Table 5. Risk ratios for endothelial class membership.
M. tuberculosis infection was significantly associated with the profile 2 subgroup. The RR of profile 2 versus 3 was 2.7 times higher for patients with M. tuberculosis bacteremia (95% CI: 1.16, 6.33), controlling for age, sex, and CD4+ T cell count. Similarly, the RR of profile 2 versus 1 was 2.5 times higher for patients with M. tuberculosis bacteremia (95% CI: 1.16, 5.39), controlling for age, sex, and CD4+ T cell count.
The RR of profile 2 versus 3 increased 2.8 times with every 1 unit increase in log-transformed procalcitonin (PCT) (95% CI: 1.98, 4.03), controlling for age, sex, and CD4+ T cell count. Similarly, the RR of profile 2 versus 1 increased 3 times with every 1 unit increase in log-transformed PCT (95% CI: 2.07, 4.50), controlling for age, sex, and CD4+ T cell count.
Endothelial processes.
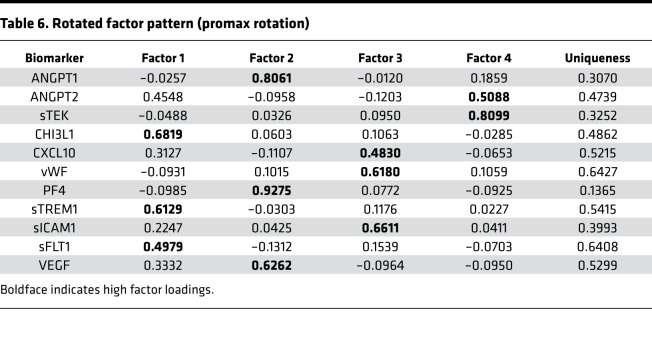
The principal component analysis parsed the data into 11 components, 4 of which had eigenvalues greater than 1, suggesting that a maximum of 4 latent factors should be retained. The fourth component explained 10% of the variance in the data, and together the 4 components explained 70% of the variance. A 4-factor model was also corroborated by the results of the scree plot and parallel analysis. Factor 1 was characterized by high factor loadings for CHI3L1 (0.68), sTREM1 (0.61), and sFLT1 (0.50; Table 6). ANGPT1 (0.81), PF4 (0.93), and VEGF (0.63) loaded on factor 2. Factor 3 was characterized by high loadings of CXCL10 (0.48), vWF (0.62), and sICAM1 (0.66). Lastly, high loadings of ANGPT2 (0.51) and sTEK (0.81) characterized factor 4. Factors 1 and 3 had a promax rotation correlation (rho) of 0.38, and factors 2 and 3 had rho of 0.26. The remaining correlations were negligible.
Table 6. Rotated factor pattern (promax rotation).
The uniqueness of most biomarkers (i.e., the proportion of the variance that was not explained by the factors) was moderate, indicating that the variance in the biomarkers was partially explained by the 4 factors (Table 6). In particular, the high factor loadings of all 3 biomarkers constituting factor 2 suggest that this factor was a strong predictor of ANGPT1, PF4, and VEGF. Two of the biomarkers (sFLT1 and vWF) had uniqueness values greater than 0.6, suggesting that there was a greater level of residual variability in these biomarkers. Factor 4 was identified by only 2 biomarkers and is, therefore, at risk for misinterpretation.
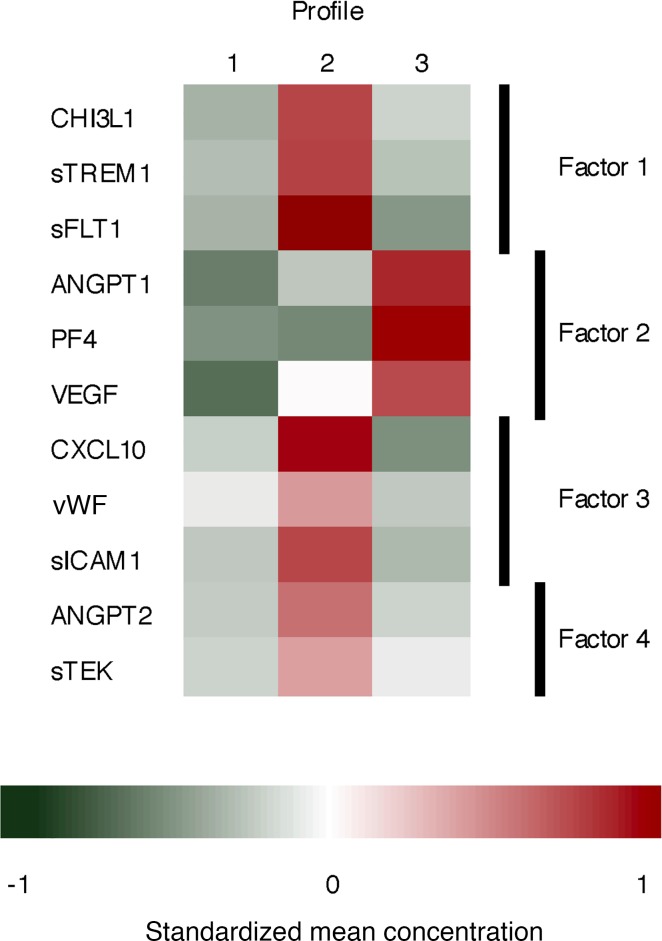
Patients fitting profile 1 had biomarker concentrations that were below average for all 11 biomarkers (Table 3 and Figure 3). The biomarkers identified through the latent factor analysis as belonging to factor 2 (ANGPT1, PF4, and VEGF) were particularly low in profile 1. Profile 2 was characterized by elevated concentrations of all biomarkers except for those belonging to factor 2. Conversely, profile 3 consisted of elevated concentrations of biomarkers belonging to factor 2 and low concentrations of the other biomarkers.
Figure 3. Heatmap of standardized mean biomarker concentrations by patient profile.
The 3 patient profiles have distinct biomarker patterns. Patients in profile 1 have below-average biomarker concentrations of all 11 biomarkers, particularly biomarkers belonging to factor 2. Patients in profile 2 have above-average concentrations of all biomarkers except those in factor 2. Profile 3 was characterized by elevated concentrations of biomarkers in factor 2, and below-average biomarker concentrations of the other biomarkers.
Discussion
Sepsis is widely recognized as a complex, heterogeneous syndrome (9). A panel of biomarkers involved in the endothelial response to sepsis was rigorously evaluated to better characterize the underlying heterogeneity in the pathways of host response and injury that underlie multiorgan dysfunction and mortality in sepsis.
Three subgroups of patients with sepsis were identified with distinct host endothelial response profiles. The patients in the 3 subgroups were similar in their demographic characteristics, yet there were significant differences in their clinical laboratory values. This finding suggests that there is clinical relevance to the 3 endothelial response profiles. Profile 2 was associated with low CD4+ T cell counts, low platelet counts, low hemoglobin concentrations, and elevated WBC counts. In contrast, the risk of being in the profile 3 group increased with increasing hemoglobin concentrations and platelet counts.
Patients infected with M. tuberculosis were at approximately 2.5 times higher risk of being in profile 2 compared with patients without M. tuberculosis bacteremia, controlling for age, sex, and CD4+ T cell count. This finding supports the theory that different pathogens may elicit different endothelial responses. However, only 38% of patients estimated to be in profile 2 based on most likely class membership were infected with M. tuberculosis, suggesting that the endothelial response is not pathogen-specific. Few studies have specifically investigated endothelial activation in patients with M. tuberculosis. Ragno et al. examined changes in gene expression in macrophages infected with M. tuberculosis and found upregulation of genes encoding VEGF and its receptor sFLT1, among other genes thought to be involved in immunoregulation (17). VEGF (18, 19) and sICAM1 (20) concentrations were also found to be higher in patients with active than inactive pulmonary tuberculosis. Patients with active pulmonary tuberculosis had significantly higher concentrations of PF4 than control patients (21, 22), and one study found PF4 levels correlated with the extent of pulmonary lesions on chest radiography (22). In a study of patients with pleural effusions, vWF levels were significantly higher in patients with tuberculosis than other etiologies (23). Among patients with pulmonary M. tuberculosis, a sTREM1 concentration of ≥128 pg/ml was associated with 6-month mortality and the presence of disseminated tuberculosis (24), but did not differentiate tuberculosis from pneumonia caused by extracellular bacteria (25). Although the evidence for the contribution of endothelial dysfunction to M. tuberculosis pathogenesis is limited, further investigation may be warranted, particularly as most studies focused on pulmonary (rather than extrapulmonary) tuberculosis.
The impact of infectious etiology on the relationship between markers of the inflammatory and endothelial responses and mortality risk was recently investigated in a cohort of subjects with bloodstream infections meeting at least 2 SIRS criteria and admitted to the ICU at an academic medical center in the United States (26). Multivariate analysis of plasma biomarkers identified statistically significant associations between ANGPT2 and the ANGPT2/ANGPT1 ratio and 28-day mortality. Subjects infected with Gram-negative bacilli infections (predominantly E. coli) had similar biomarker concentration profiles to patients infected with Gram-positive cocci, with the exception of ANGPT2/ANGPT1 concentration ratios. However, bacterial class was not associated with 28-day mortality. The investigators concluded that the inflammatory and endothelial marker concentrations did not differ significantly by Gram-positive or Gram-negative infections, and 28-day mortality did not differ by bacterial class (26).
Latent factor analysis of the correlation structure of the biomarkers identified patterns suggesting that the biomarkers are involved in 4 distinct processes. Factor 1 was loaded highly by the biomarkers CHI3L1, sTREM1, and sFLT1. All three are involved in the monocyte response to infection. sTREM1 and sFLT1 are receptors expressed on monocytes, which lead to secretion of proinflammatory mediators when activated. Factor 1 could, therefore, be interpreted as an inflammatory process. sTREM1 amplifies the inflammatory response in extracellular bacterial and fungal infections (27). Once activated, the cellular receptors are shed from the cell surface. Activated macrophages and neutrophils secrete CHI3L1, which has a proinflammatory effect. While the biologic activity of CHI3L1 is not completely understood, it is associated with inflammatory conditions such as rheumatoid arthritis and has been shown to upregulate VEGF expression and promote angiogenesis (28).
ANGPT1, PF4, and VEGF loaded on factor 2, which could be interpreted as a vessel stabilization process. All 3 molecules are involved in angiogenesis, the formation of blood vessels from preexisting blood vessels. Prior investigation of the biologic relationship between ANGPT1 and VEGF found that ANGPT1 prevents VEGF from disrupting endothelial cell-to-cell contacts, thus stabilizing blood vessels and preventing vascular leak (29). PF4 has several biologic functions and inhibits the angiogenic effects of VEGF (30). Furthermore, a murine model of sepsis-induced acute lung injury demonstrated that disruption of PF4 prevented lung edema and tissue damage (31). Given the biologic functions of the constituent biomarkers, this factor likely plays a protective role in sepsis pathogenesis.
Factor 3 was characterized by high loadings of CXCL10, vWF, and sICAM1, and could be interpreted as a leukocyte recruitment process. Transendothelial migration of leukocytes to sites of inflammation occurs in a multistep process involving rolling across the endothelium, integrin activation to stop leukocyte motility, and adhesion and transmigration of the cell across the endothelium. The processes of leukocyte rolling and leukocyte adhesion have both been shown to be dependent on the presence of vWF in inflamed veins (32). CXCL10 is a chemokine that is produced at high levels by activated endothelial cells and is involved in leukocyte transmigration (33). The firm adhesion of leukocytes to the endothelial cell is mediated by sICAM1, an adhesion molecule expressed on endothelial cells.
Lastly, high loadings of ANGPT2 and sTEK characterized factor 4, which could be interpreted as endothelial vessel instability. ANGPT2 competes with ANG-1 for their receptor, sTEK. When bound to sTEK, ANGPT2 primes the endothelium to respond to proinflammatory and angiogenic (e.g., VEGF) stimuli, propagating further endothelial activation and destabilizing the endothelial vasculature (34). Endothelial barrier integrity is tightly regulated and is altered during sepsis. ANGPT2 and sTEK signaling plays a critical role in disrupting the endothelial barrier, resulting in net extravasation of fluid from the vascular space into the tissues (35).
The 4-factor model explained the variability in most of the biomarkers; however, sFLT1 and vWF had high uniqueness values. It is possible that these biomarkers are involved in other relevant processes not captured in this analysis. Alternatively, these biomarkers may be more difficult to accurately measure. Factor 4 (vessel instability) was identified by only 2 biomarkers and is therefore at risk for misinterpretation. However, there has been extensive study on the relationship between ANGPT2 and its receptor, sTEK, supporting the interpretation of this factor as vessel instability.
Interpretation of the endothelial response profiles is complex. Patients fitting profile 1 had below-average concentrations of all 11 biomarkers, suggesting a quiescent phenotype. In particular, biomarkers belonging to factor 2 (ANGPT1, PF4, and VEGF), interpreted as the vessel stabilization factor, were particularly low in profile 1. Profile 2 was characterized by elevated concentrations of all biomarkers except for those belonging to the vessel stabilization factor (factor 2). Profile 2 could be interpreted as endothelial dysfunction. Conversely, profile 3 consisted of elevated concentrations of biomarkers belonging to factor 2 and low concentrations of the other biomarkers, perhaps suggesting that these patients fit an endothelial repair profile. The cytokine responses for patients with sepsis were summarized in a review to typically follow 1 of 3 patterns: (a) rapid production of both proinflammatory and antiinflammatory cytokines; (b) predominance of antiinflammatory cytokines; or (c) globally depressed production of cytokines (36). Future studies could investigate whether the 3 cytokine patterns described in the review correspond to the endothelial response profiles identified in this study.
Latent factor analysis (LFA) and latent profile analysis (LPA) offer a novel approach to understanding the host-response profiles in patients with sepsis. LFA provides information on the correlation structure of the biomarkers, where correlated biomarkers can be conceptualized as being part of a biologic process. LPA identifies subgroups of patients with similar host-response profiles. The use of both approaches in parallel provides insight into the biologic processes underlying the patient subgroups. In contrast, other methods often used in biomarker studies, such as logistic regression, provide information on the relationship between individual analytes and the outcome. In complex diseases such as sepsis, however, the outcome is likely a result of disruption in multiple biologic processes, which may not be well represented by individual analytes. Furthermore, traditional methods do not account for subgroups of patients that differ in their biomarker profiles and their risk of the outcome. However, LFA and LPA do have limitations. The decisions regarding both the number of factors and the number of subgroups were guided by several well-established criteria but are ultimately somewhat arbitrary. In the LFA, we chose a 4-factor model, but an argument could also be made for a 3-factor solution. Selection of too few or too many factors has consequences for the interpretation of the data. Specifying too many factors could lead to inclusion of minor factors but was considered more acceptable than potentially losing important information by specifying too few factors. Furthermore, the fourth factor was composed of ANG-2 and its receptor sTEK, which is conceptually consistent with the known biology of the 2 molecules. In the LPA, the log-likelihood and Bayesian information criterion were marginally better for the 4-class solution. However, simulation studies suggest that the Lo-Mendell-Rubin test is more accurate for selecting the correct number of classes. In addition, the entropy statistic suggested that the 3-class solution formed more distinct groups.
While our study had a number of strengths, it also had limitations, including that it was a single-country study that enrolled patients who were predominantly people living with HIV. We hypothesize that the biologic processes we observed in patients with sepsis in Uganda will be conserved across other patient populations; however, additional prospective confirmatory studies are required in geographically diverse areas to establish the generalizability of our findings. In this study, we focused on endothelial and immune activation during sepsis. Future research is also needed to examine the relative importance of other biologic processes implicated in the pathobiology of sepsis, including immune exhaustion, coagulopathy, and altered glucose and protein metabolism.
Patients in profile 2 had significantly worse survival outcomes than patients in the other subgroups. Profiling patients based on their endothelial response may have important implications for clinical management, as patients with endothelial dysfunction may benefit from targeted treatment strategies. Endothelial response profiles may also prove useful in future clinical trials where selection of homogeneous study populations is needed to detect potential treatment effects. Further research is needed to establish the clinical relevance of the endothelial response profiles and determine whether similar subgroups are found in populations with different pathogens, host genetics, and patient comorbidities.
Methods
Study population.
The primary cohort from which these biomarker data were collected has been described elsewhere (37). In brief, 426 adult patients admitted with sepsis to the medical wards of 2 Ugandan hospitals were enrolled in an intervention study of fluid resuscitation conducted between May 2008 and May 2009.
Data collection.
The primary outcome of interest was 28-day mortality, measured in days from study enrollment. Demographic, clinical history, and patient management data were systematically recorded in the evaluation. Double data entry was conducted for quality control using EpiData (The EpiData Association, Odense, Denmark).
Laboratory testing.
Blood samples were collected at the time of enrollment for complete blood counts, electrolytes, CD4+ T cell (CD4) counts, HIV serology, malaria blood smears, and blood cultures (both aerobic and mycobacterial).
All biomarker assays were conducted at the University of Toronto using blood drawn at study enrollment. The clinical samples were centrifuged at the hospital, and serum was stored at –20°C. Commercial ELISAs were used to measure biomarker levels (ANGPT1, ANGPT2, sICAM1, sTREM1, CHI3L1, PF4, CXCL10, sFLT1, sTEK, VEGF: R&D Systems; vWF: antibody from Dako, standard from American Diagnostica) (38). All assays were conducted in duplicate. The biomarker results were reported on a continuous scale, measured in either picograms or nanograms per milliliter. The upper and lower limits of detection for each assay were: ANGPT1, 0.039–20 ng/ml; ANGPT2, 0.016–8 ng/ml; sICAM, 0.078–4 ng/ml; sTREM1, 93.8–6000 pg/ml; CHI3L1, 31.2–2000 pg/ml; PF4, 15.6–1000 pg/ml; CXCL10, 31.2–2000 pg/ml; sFLT1, 125–8000 pg/ml; sTEK, 156–10,000 pg/ml; VEGF, 31.2–2000 pg/ml; vWF, 1.95–2000 ng/ml.
Statistics.
The analysis set included the 426 patients enrolled in the prospective study (the “full sample”), excluding patients whose mortality data (5 patients) or any biomarker values (106 patients) were missing. Ninety-three of the missing biomarker values were due to loss of a shipment of samples, suggesting the data were missing completely at random. The final analysis set included 315 patients. The biomarker variables were plotted to identify outliers and evaluate normality. The natural logarithms of the biomarker concentrations were used for all biomarkers except sTEK and CXCL10, which better approximated a normal distribution with a square root transformation as determined by visual inspection of the distributions. There were no extreme outliers (3 times the IQR below the 25th percentile or above the 75th percentile) after the transformations. The transformed variables were standardized to have a mean of 0 and standard deviation of 1.
Latent profile analysis (LPA) is a method to ascertain subgroups of patients conforming to a particular pattern of indicators from an otherwise heterogeneous population. In LPA, subgroups of individuals are formed such that individuals within the subgroup have common response probabilities. In turn, the fitted model can be used to classify patients with different biomarker patterns into different subgroups. LPA provides a useful means of identifying subgroups of patients with homogeneous biomarker patterns, thus reducing the heterogeneity in the study population. LPA is similar to latent class analysis but allows for continuous indicators.
A series of latent profile models was evaluated to determine the number of latent subgroups. Several criteria were used to determine the best-fitting model, including the Bayesian information criterion (39, 40), the log likelihood, the Lo-Mendell-Rubin test (41), entropy (42), and clinical interpretability (43). Once the optimal number of classes was determined, subjects were assigned to the most-likely class based on the posterior probability of class membership. Multinomial logistic regression using a 3-step approach was used to investigate the demographic and clinical characteristics of the latent subgroups. These models provide the risk of membership in a given latent class versus a reference latent class, with the corresponding confidence interval. The 3-step approach was used to account for the measurement error in the classification of patients into their most-likely class (44). Age, sex, and the natural logarithm of the CD4+ T cell count were included in the models as potential confounders. M-plus v7 (Muthén and Muthén, Los Angeles, California, USA) was used to identify the best-fitting LPA model and for multinomial logistic regression analysis. Kaplan-Meier survival curves were generated for each latent class, and the log-rank test was used to test whether the survival curves were significantly different. All statistical tests were 2-tailed, with a P value less than 0.05 considered significant.
To evaluate whether the endothelial response to sepsis consisted of one unified biologic process or multiple processes, LFA was used to analyze the correlation structure of the biomarkers. LFA is a multivariate statistical method for determining the number and nature of patterns of an observed correlation structure. In this study, each factor represented an underlying biologic process comprising a set of correlated biomarkers. Principal component analysis was used to estimate the number of dimensions of shared variation. The number of components was determined using several criteria, including the proportion of variance explained by the component (45); having an eigenvalue greater than 1 (46); scree plots analysis (47); and parallel analysis (PA) (48). The criterion of an eigenvalue greater than 1 was used as an upper bound for the number of factors to retain (45). In PA, 1000 data sets were simulated with the same number of observations and variables as the study data set. As the generated data were random, any correlation in the indicators was due to sampling error. Components corresponding to eigenvalues greater than the random eigenvalues obtained from the PA were retained. Components corresponding to eigenvalues less than or equal to the random eigenvalues were considered to be due to sampling error (45). The iterated principal factor method was then used to estimate factor model loadings for the selected number of factor dimensions. Since correlation among biomarkers within the biologic processes was expected, a promax rotation was used (49). Factor rotations simplify the factor structure and interpretability. The rotated factor pattern matrix was used to interpret the meaning of the factors. The rotated factor loadings in this matrix were standardized regression coefficients, representing the correlation between a biomarker and the factor, holding other factors constant. The LFA was conducted using Stata (StataCorp 2009, Stata Statistical Software, release 11).
Study approval.
Informed consent was obtained from the patient or a surrogate if the patient was unable to provide written consent. Institutional review board (IRB) approval was obtained from the University of Virginia, Makerere University, Mulago Hospital, the Infectious Disease Institute, and the Uganda National Council of Science and Technology. The Johns Hopkins Bloomberg School of Public Health IRB deemed the secondary data analysis not human subjects research.
Author contributions
STJ, WMS, and PB designed and conducted the clinical study in Uganda. KCK and WCL designed the laboratory experiments and analyzed laboratory data. DVC developed the analysis plan in conjunction with STJ, KBR, and WJM; DVC analyzed the data. All authors reviewed, provided edits to, and approved the final submitted manuscript.
Acknowledgments
We thank the PRISM-U study team and study participants for their contribution to this work, as well as James Lawler for his thoughtful comments on the manuscript. We acknowledge the technical assistance and contributions of Nimerta Rajwans (deceased), who performed the biomarker assays in this study. This research was supported primarily by an Investigator-Initiated Award provided by Pfizer Inc. (to WMS and STJ). Pfizer Inc. had no role in the design or conduct of the study; the collection, management, analysis, or interpretation of the data; or the preparation, review, or approval of the manuscript. Additional support for biomarker laboratory analyses was provided by a Canadian Institutes of Health Research Foundation grant (FDN-148439 to KCK) and the Canada Research Chair program (to KCK and WCL).
Version 1. 04/23/2019
In-Press Preview
Version 2. 05/16/2019
Electronic publication
Footnotes
Conflict of interest: KCK and WCL are inventors on patents related to the use of angiopoietin markers, entitled “Angiopoietin-1 and -2 biomarkers for infectious diseases that compromise endothelial integrity” (application WO2009059404) and “Biomarkers for early determination of a critical or life threatening response to illness and monitoring response to treatment” (application CA2769433).
Copyright: © 2019 American Society for Clinical Investigation
Reference information: JCI Insight. 2019;4(10):e127623. https://doi.org/10.1172/jci.insight.127623.
Contributor Information
Danielle V. Clark, Email: dclark@aceso-sepsis.org.
Patrick Banura, Email: banura20031@gmail.com.
Karen Bandeen-Roche, Email: kbandee1@jhu.edu.
W. Conrad Liles, Email: wcliles@uw.edu.
Kevin C. Kain, Email: kevin.kain@uhn.on.ca.
W. Michael Scheld, Email: WMS@hscmail.mcc.virginia.edu.
William J. Moss, Email: wmoss@jhsph.edu.
Shevin T. Jacob, Email: Shevin.Jacob@lstmed.ac.uk.
References
- 1.Fleischmann C, et al. Assessment of global incidence and mortality of hospital-treated sepsis. Current estimates and limitations. Am J Respir Crit Care Med. 2016;193(3):259–272. doi: 10.1164/rccm.201504-0781OC. [DOI] [PubMed] [Google Scholar]
- 2.Cheng AC, West TE, Limmathurotsakul D, Peacock SJ. Strategies to reduce mortality from bacterial sepsis in adults in developing countries. PLoS Med. 2008;5(8):e175. doi: 10.1371/journal.pmed.0050175. [DOI] [PMC free article] [PubMed] [Google Scholar]
- 3.Reddy EA, Shaw AV, Crump JA. Community-acquired bloodstream infections in Africa: a systematic review and meta-analysis. Lancet Infect Dis. 2010;10(6):417–432. doi: 10.1016/S1473-3099(10)70072-4. [DOI] [PMC free article] [PubMed] [Google Scholar]
- 4.Singer M, et al. The third international consensus definitions for sepsis and septic shock (Sepsis-3) JAMA. 2016;315(8):801–810. doi: 10.1001/jama.2016.0287. [DOI] [PMC free article] [PubMed] [Google Scholar]
- 5.Angus DC, van der Poll T. Severe sepsis and septic shock. N Engl J Med. 2013;369(9):840–851. doi: 10.1056/NEJMra1208623. [DOI] [PubMed] [Google Scholar]
- 6.Jacob ST, et al. Mycobacterium tuberculosis bacteremia in a cohort of HIV-infected patients hospitalized with severe sepsis in Uganda—high frequency, low clinical suspicion [corrected] and derivation of a clinical prediction score. PLoS One. 2013;8(8):e70305. doi: 10.1371/journal.pone.0070305. [DOI] [PMC free article] [PubMed] [Google Scholar]
- 7.Mayr FB, Yende S, Angus DC. Epidemiology of severe sepsis. Virulence. 2014;5(1):4–11. doi: 10.4161/viru.27372. [DOI] [PMC free article] [PubMed] [Google Scholar]
- 8.Opal SM, Cross AS. Clinical trials for severe sepsis. Past failures, and future hopes. Infect Dis Clin North Am. 1999;13(2):285–297. doi: 10.1016/S0891-5520(05)70075-1. [DOI] [PubMed] [Google Scholar]
- 9.Carlet J, Cohen J, Calandra T, Opal SM, Masur H. Sepsis: time to reconsider the concept. Crit Care Med. 2008;36(3):964–966. doi: 10.1097/CCM.0B013E318165B886. [DOI] [PubMed] [Google Scholar]
- 10.Opal SM, Cohen J. Clinical gram-positive sepsis: does it fundamentally differ from gram-negative bacterial sepsis? Crit Care Med. 1999;27(8):1608–1616. doi: 10.1097/00003246-199908000-00039. [DOI] [PubMed] [Google Scholar]
- 11.Rhodes A, et al. Surviving Sepsis Campaign: International Guidelines for Management of Sepsis and Septic Shock: 2016. Crit Care Med. 2017;45(3):486–552. doi: 10.1097/CCM.0000000000002255. [DOI] [PubMed] [Google Scholar]
- 12.Permpikul C, Tongyoo S, Ratanarat R, Wilachone W, Poompichet A. Impact of septic shock hemodynamic resuscitation guidelines on rapid early volume replacement and reduced mortality. J Med Assoc Thai. 2010;93(suppl 1):S102–S109. [PubMed] [Google Scholar]
- 13.Lundberg JS, et al. Septic shock: an analysis of outcomes for patients with onset on hospital wards versus intensive care units. Crit Care Med. 1998;26(6):1020–1024. doi: 10.1097/00003246-199806000-00019. [DOI] [PubMed] [Google Scholar]
- 14.Pierrakos C, Vincent JL. Sepsis biomarkers: a review. Crit Care. 2010;14(1):R15. doi: 10.1186/cc8872. [DOI] [PMC free article] [PubMed] [Google Scholar]
- 15.De Backer D, Donadello K, Taccone FS, Ospina-Tascon G, Salgado D, Vincent JL. Microcirculatory alterations: potential mechanisms and implications for therapy. Ann Intensive Care. 2011;1(1):27. doi: 10.1186/2110-5820-1-27. [DOI] [PMC free article] [PubMed] [Google Scholar]
- 16.Goldenberg NM, Steinberg BE, Slutsky AS, Lee WL. Broken barriers: a new take on sepsis pathogenesis. Sci Transl Med. 2011;3(88):88ps25. doi: 10.1126/scitranslmed.3002011. [DOI] [PubMed] [Google Scholar]
- 17.Ragno S, Romano M, Howell S, Pappin DJ, Jenner PJ, Colston MJ. Changes in gene expression in macrophages infected with Mycobacterium tuberculosis: a combined transcriptomic and proteomic approach. Immunology. 2001;104(1):99–108. doi: 10.1046/j.1365-2567.2001.01274.x. [DOI] [PMC free article] [PubMed] [Google Scholar]
- 18.Alatas F, Alatas O, Metintas M, Ozarslan A, Erginel S, Yildirim H. Vascular endothelial growth factor levels in active pulmonary tuberculosis. Chest. 2004;125(6):2156–2159. doi: 10.1378/chest.125.6.2156. [DOI] [PubMed] [Google Scholar]
- 19.Matsuyama W, et al. Increased serum level of vascular endothelial growth factor in pulmonary tuberculosis. Am J Respir Crit Care Med. 2000;162(3 pt 1):1120–1122. doi: 10.1164/ajrccm.162.3.9911010. [DOI] [PubMed] [Google Scholar]
- 20.Lai CK, et al. Circulating adhesion molecules in tuberculosis. Clin Exp Immunol. 1993;94(3):522–526. [PMC free article] [PubMed] [Google Scholar]
- 21.Tarhan G, Gümüşlü F, Yilmaz N, Saka D, Ceyhan I, Cesur S. Serum adenosine deaminase enzyme and plasma platelet factor 4 activities in active pulmonary tuberculosis, HIV-seropositive subjects and cancer patients. J Infect. 2006;52(4):264–268. doi: 10.1016/j.jinf.2005.06.009. [DOI] [PubMed] [Google Scholar]
- 22.Büyükaşik Y, et al. In vivo platelet and T-lymphocyte activities during pulmonary tuberculosis. Eur Respir J. 1998;12(6):1375–1379. doi: 10.1183/09031936.98.12061375. [DOI] [PubMed] [Google Scholar]
- 23.Philip-Joët F, et al. Fibrinolytic and inflammatory processes in pleural effusions. Eur Respir J. 1995;8(8):1352–1356. doi: 10.1183/09031936.95.08081352. [DOI] [PubMed] [Google Scholar]
- 24.Huang CT, et al. High serum levels of procalcitonin and soluble TREM-1 correlated with poor prognosis in pulmonary tuberculosis. J Infect. 2014;68(5):440–447. doi: 10.1016/j.jinf.2013.12.012. [DOI] [PubMed] [Google Scholar]
- 25.Tintinger GR, van der Merwe JJ, Fickl H, Rheeder P, Feldman C, Anderson R. Soluble triggering receptor expressed on myeloid cells in sputum of patients with community-acquired pneumonia or pulmonary tuberculosis: a pilot study. Eur J Clin Microbiol Infect Dis. 2012;31(1):73–76. doi: 10.1007/s10096-011-1278-y. [DOI] [PubMed] [Google Scholar]
- 26.Hahn WO, et al. Host derived biomarkers of inflammation, apoptosis, and endothelial activation are associated with clinical outcomes in patients with bacteremia and sepsis regardless of microbial etiology. Virulence. 2016;7(4):387–394. doi: 10.1080/21505594.2016.1144003. [DOI] [PMC free article] [PubMed] [Google Scholar]
- 27.Colonna M. TREMs in the immune system and beyond. Nat Rev Immunol. 2003;3(6):445–453. doi: 10.1038/nri1106. [DOI] [PubMed] [Google Scholar]
- 28.Francescone RA, et al. Role of YKL-40 in the angiogenesis, radioresistance, and progression of glioblastoma. J Biol Chem. 2011;286(17):15332–15343. doi: 10.1074/jbc.M110.212514. [DOI] [PMC free article] [PubMed] [Google Scholar]
- 29.Gavard J, Patel V, Gutkind JS. Angiopoietin-1 prevents VEGF-induced endothelial permeability by sequestering Src through mDia. Dev Cell. 2008;14(1):25–36. doi: 10.1016/j.devcel.2007.10.019. [DOI] [PubMed] [Google Scholar]
- 30.Das A, Lauffenburger D, Asada H, Kamm R. Determining cell fate transition probabilities to VEGF/Ang 1 levels: relating computational modeling to microfluidic angiogenesis studies. Cell Mol Bioeng. 2010;3(4):345–360. doi: 10.1007/s12195-010-0146-7. [DOI] [Google Scholar]
- 31.Grommes J, et al. Disruption of platelet-derived chemokine heteromers prevents neutrophil extravasation in acute lung injury. Am J Respir Crit Care Med. 2012;185(6):628–636. doi: 10.1164/rccm.201108-1533OC. [DOI] [PMC free article] [PubMed] [Google Scholar]
- 32.Chauhan AK, Kisucka J, Brill A, Walsh MT, Scheiflinger F, Wagner DD. ADAMTS13: a new link between thrombosis and inflammation. J Exp Med. 2008;205(9):2065–2074. doi: 10.1084/jem.20080130. [DOI] [PMC free article] [PubMed] [Google Scholar]
- 33.Newton P, O’Boyle G, Jenkins Y, Ali S, Kirby JA. T cell extravasation: demonstration of synergy between activation of CXCR3 and the T cell receptor. Mol Immunol. 2009;47(2-3):485–492. doi: 10.1016/j.molimm.2009.08.021. [DOI] [PMC free article] [PubMed] [Google Scholar]
- 34.Fiedler U, Augustin HG. Angiopoietins: a link between angiogenesis and inflammation. Trends Immunol. 2006;27(12):552–558. doi: 10.1016/j.it.2006.10.004. [DOI] [PubMed] [Google Scholar]
- 35.Parikh SM, et al. Excess circulating angiopoietin-2 may contribute to pulmonary vascular leak in sepsis in humans. PLoS Med. 2006;3(3):e46. doi: 10.1371/journal.pmed.0030046. [DOI] [PMC free article] [PubMed] [Google Scholar]
- 36.Hotchkiss RS, Monneret G, Payen D. Immunosuppression in sepsis: a novel understanding of the disorder and a new therapeutic approach. Lancet Infect Dis. 2013;13(3):260–268. doi: 10.1016/S1473-3099(13)70001-X. [DOI] [PMC free article] [PubMed] [Google Scholar]
- 37.Jacob ST, et al. The impact of early monitored management on survival in hospitalized adult Ugandan patients with severe sepsis: a prospective intervention study. Crit Care Med. 2012;40(7):2050–2058. doi: 10.1097/CCM.0b013e31824e65d7. [DOI] [PMC free article] [PubMed] [Google Scholar]
- 38.Leligdowicz A, et al. Validation of two multiplex platforms to quantify circulating markers of inflammation and endothelial injury in severe infection. PLoS One. 2017;12(4):e0175130. doi: 10.1371/journal.pone.0175130. [DOI] [PMC free article] [PubMed] [Google Scholar]
- 39.Yang CC. Evaluating latent class analysis models in qualitative phenotype identification. Comput Stat Data Anal. 2006;50(4):1090–1104. doi: 10.1016/j.csda.2004.11.004. [DOI] [Google Scholar]
- 40.He T, Xue Z, Yu N, Nitsch PL, Teh BS, Wong ST. Estimating dynamic lung images from high-dimension chest surface motion using 4D statistical model. Med Image Comput Comput Assist Interv. 2014;17(pt 2):138–145. doi: 10.1007/978-3-319-10470-6_18. [DOI] [PubMed] [Google Scholar]
- 41.Lo Y, Mendell NR, Rubin DB. Testing the number of components in a normal mixture. Biometrika. 2001;88(3):767–778. doi: 10.1093/biomet/88.3.767. [DOI] [Google Scholar]
- 42.Celeux G, Soromenho G. An entropy criterion for assessing the number of clusters in a mixture model. J Classif. 1996;13(2):195–212. doi: 10.1007/BF01246098. [DOI] [Google Scholar]
- 43.Nylund KL, Asparouhov T, Muthen BO. Deciding on the number of classes in latent class analysis and growth mixture modeling: a Monte Carlo simulation study. Struct Equ Model Multidiscip J. 2007;14(4):535–569. doi: 10.1080/10705510701575396. [DOI] [Google Scholar]
- 44.Vermunt JK. Latent class modeling with covariates: two improved three-step approaches. Political Analysis. 2010;4(18):450–469. [Google Scholar]
- 45.Hayton JC, Allen DG, Scarpello V. Factor retention decisions in exploratory factor analysis: a tutorial on parallel analysis. Organ Res Methods. 2004;7(2):191–205. doi: 10.1177/1094428104263675. [DOI] [Google Scholar]
- 46.Kaiser HF. The application of electronic computers to factor analysis. Educ Psychol Meas. 1960;20:141–151. doi: 10.1177/001316446002000116. [DOI] [Google Scholar]
- 47.Cattell RB. The scree test for the number of factors. Multivariate Behav Res. 1966;1(2):245–276. doi: 10.1207/s15327906mbr0102_10. [DOI] [PubMed] [Google Scholar]
- 48.Horn JL. A rationale and test for the number of factors in factor analysis. Psychometrika. 1965;30:179–185. doi: 10.1007/BF02289447. [DOI] [PubMed] [Google Scholar]
- 49.Hendrickson AE, White PO. Promax: a quick method for rotation to oblique simple structure. Br J Stat Psychol. 1964;17(1):65–70. doi: 10.1111/j.2044-8317.1964.tb00244.x. [DOI] [Google Scholar]


